


Abstract
Serotonin 4 receptors (5-hydroxytryptamine receptor 4 [5HT4R]) hold promise as a novel therapeutic approach to multiple brain disorders, including Alzheimer and Huntington disease. In vivo imaging of these receptors with selective 5HT4R radiotracers and PET would be valuable to investigate alterations in 5HT4R in different brain disorders and to assist drug discovery. In this study, 18F-MNI698 was evaluated as a potential PET radiotracer for imaging of 5HT4R in the brain. Methods: Eighteen PET studies were performed in 3 adult rhesus monkeys. The radiotracer was administered as a bolus intravenous injection or bolus plus constant infusion (time that would be required to inject the bolus at the infusion rate = 60 min), and arterial blood was collected for data quantification. Kinetic models were used to estimate distribution volumes and binding potentials, for which the cerebellum was used as a reference region. 18F-MNI698 test–retest variability and upper mass dose limits were determined. Preblocking studies using several doses of SB204070, a selective 5HT4R antagonist, were performed. Results: 18F-MNI698 avidly entered the monkey brain (peak percentage injected dose of ∼6.6%), and its brain distribution was consistent with known 5HT4R densities. At 120 min after bolus injection and after the start of radiotracer infusion, only less than 5% and approximately 10% parent compound was present in blood, respectively. Measured binding potentials were underestimated by 22%–36% when noninvasive methods were used for data quantification in comparison with invasive methods. A good agreement was found between test–retest measurements. The radiotracer upper mass dose limit (<5% occupancy) was determined to be 13.1 μg per 70 kg of body weight. SB204070 blocked the radiotracer binding in a dose-dependent manner. Conclusion: Data indicate that 18F-MNI698 is a promising PET radiotracer for imaging of 5HT4R in the brain, and human studies are warranted based on these study results.
The serotonin 4 receptors (5-hydroxytryptamine receptor 4 [5HT4R]) are well-characterized G-protein–coupled receptors that can be found in a variety of organs and tissues, including the brain (1–3). High densities of 5HT4R are detected in the basal ganglia and limbic structures in the brain, whereas low densities are measured in the neocortex and negligible levels of binding are found in the cerebellum (4–7). The 5HT4Rs are involved in different brain functions and dysregulation of these receptors has been implicated in depression (8–10), attention-deficit/hyperactivity disorder (11,12), anorexia and obesity (12,13). Furthermore, autoradiographic examinations of brain tissue from Alzheimer disease subjects have shown a marked loss of 5HT4R in hippocampal and cortical regions, which is consistent with a role of 5HT4R in cognition; and brain tissue from Huntington disease subjects demonstrated a reduction of 5HT4R in the putamen (7). Evidence that 5HT4R agonists mediate enhancement of cognitive function in vivo and amyloid precursor protein processing in vitro has also been published recently (14). In a mouse model of Alzheimer disease, chronic administration of a 5HT4R agonist decreased soluble and insoluble β-amyloid plaques in the hippocampus (15).
A selective 5HT4R radiotracer would allow for in vivo imaging studies examining disease progression and treatment response in different brain disorders. In addition, it would also be valuable in studies assessing drugs targeting the 5HT4R, thus supporting drug discovery. The most promising 5HT4R radiotracers developed so far are the 11C-labeled SB207145 and the 123I-labeled SB207710 (16–19). The latter displayed high affinity for 5HT4R and was subsequently evaluated in nonhuman primates (19). The former has been evaluated in both animal studies and human studies (16–18). Although imaging data obtained using 11C-SB207145 demonstrated its suitability for imaging 5HT4R in the brain, a radiotracer incorporating the longer-lived 18F is desirable. An 18F-labeled radiotracer has the advantage of providing images with higher resolution and sensitivity than those obtained with an 123I-labeled radiotracer, without the need for a cyclotron in the imaging facility as required for a 11C-labeled radiotracer. Recently, we reported the synthesis of novel 18F-labeled radiotracers for imaging of 5HT4R in the brain, identifying 18F-MNI698 as the lead radiotracer (20). The current study aimed to characterize the in vivo pharmacokinetics of 18F-MNI698 in the nonhuman primate brain, to determine test–retest variability, to assess the radiotracer upper mass dose limit to avoid mass dose effects, and to measure receptor occupancy with a selective 5HT4R antagonist drug, SB204070.
MATERIALS AND METHODS
Radiotracer and Drug Preparation
18F-MNI698 was prepared as described previously (20), with an average decay-corrected radiochemical yield of approximately 3% (reaction time of 80 min; n = 14), a radiochemical purity greater than 97%, and a specific activity at the end of the synthesis between 45 and 1,090 GBq/μmol (1.2–29.4 Ci/μmol). For the mass dose experiments, different amounts of cold MNI698 were added to the radiotracer solution.
SB204070 was purchased from Tocris and formulated in 100 mM (pH 5.5) acetate buffer. All solutions were filtered through a 0.2-μm filter into a sterile empty vial and were tested for sterility and pyrogen content.
Animals
All experiments were conducted in accordance with institutional animal care protocols in compliance with federal regulations. Three adult rhesus monkeys, 1 male and 2 females (Macaca mulatta; mean weight ± SD, 7.00 ± 1.02 kg), were used for this study. Details on animal preparation and monitoring can be found in the supplemental file (supplemental materials are available at http://jnm.snmjournals.org).
PET Studies
Study Design
Eighteen PET scans were obtained with 18F-MNI698 (mean injected radioactivity ± SD, 135.42 ± 41.37 MBq). Scans were acquired after intravenous bolus injection or bolus plus constant infusion (B+CI; time that would be required to inject the bolus at the infusion rate [Kbol] = 60 min) of 18F-MNI698. Test–retest scans were obtained in 2 rhesus monkeys after intravenous B+CI of the radiotracer, with 2- to 4-wk intervals between test and retest imaging sessions. Rhesus monkey 1 was scanned 4 times at baseline conditions, and rhesus monkey 2 was scanned twice under baseline conditions. Studies aiming to assess the radiotracer mass dose effects on receptor occupancy and those estimating MNI698 dose resulting in 50% receptor occupancy (ID50) in vivo were acquired after intravenous B+CI of a radiotracer solution containing high levels of mass doses. In a separate set of studies, preblocking experiments with a selective 5HT4R antagonist drug, SB204070, were performed after intravenous B+CI of the radiotracer. Rhesus monkey 1 was scanned after preblocking with SB204070 at 4 different doses (0.3, 5.0, 50.0, and 500.0 μg/kg), and rhesus monkey 2 was scanned after preblocking with SB204070 at 3 different doses (0.6, 10.0, and 150.0 μg/kg). SB204070 was given as a 10-min intravenous injection at approximately 30 min before radiotracer administration.
Image Acquisition and Reconstruction
All PET data were acquired using a microPET Focus220 scanner (Siemens). A transmission scan was acquired, and then, immediately after radiotracer administration, a 120-min emission scan was obtained using 3-dimentional mode as follows: 6 × 30 s, 3 × 60 s, 2 × 2 min, and 22 × 5 min. The dynamic PET sinograms were corrected for randoms, dead time, scatter, and attenuation. Subsequently, acquired frames were reconstructed using filtered backprojection with a Shepp–Logan filter and image size of 256 × 256.
Blood Analysis
Arterial blood samples were collected each 45 s until 6 min after injection and then at 8, 10, 15, 20, 25, 30, 45, 60, 90, and 120 min. With the exception of the samples collected for metabolite analysis (3.5 mL each), all blood samples were 1 mL each. Samples for metabolite analysis were collected at 6, 15, 30, 60, and 120 min after radiotracer bolus injection or at 3, 6, 10, 15, 30, 60, and 120 min after radiotracer B+CI. The potent esterase inhibitor dichlorvos was added to all blood sampling tubes (200 μg/mL of blood) to inhibit metabolism of the parent compound in vitro. The need for a protease inhibitor is consistent with previous observations indicating that for this family of compounds, accurate metabolite quantification requires the addition of protease inhibitors to each blood sample (16–18). After blood collection, all samples were kept on ice until analyzed. Details on blood sample processing and analysis are provided in the supplemental materials.
Image Processing
Reconstructed scans were imported into PMOD 3.405 software (PMOD Technologies). An in-house–developed rhesus monkey brain MR imaging template was used for image coregistration and placement of volumes of interest for quantification of radiotracer uptake. Each monkey underwent T1-weighted MR imaging with a Siemens Trio System (Siemens) at 3T (repetition time, 2.0 s; echo time, 2.74 ms; inversion time, 1.11 s; and flip angle, 7°). Acquired images were reduced from an initial matrix of 256 × 256 with 176 axial slices (axial slice thickness, 0.6 mm) to a 128 × 128 matrix with 120 axial slices (axial slice thickness, 1.2 mm). The following brain regions were manually drawn on the MR image: striatum, caudate, putamen, hippocampus, substantia nigra, globus pallidus, thalamus, frontal cortex, occipital cortex, parietal cortex, temporal cortex, and cerebellum. Average images of 18F-MNI698 PET data were generated by averaging the scans with highest brain uptake. Then, the average image was coregistered to the rhesus MR imaging template. The transformation matrix was saved and subsequently applied to the dynamic PET series. Finally, MR imaging–derived volumes of interest were applied to the coregistered PET images for image quantification.
Data Analysis
Time–activity curves were generated and standardized uptake values (SUVs) calculated as concentration in the volume of interest divided by injected dose divided by animal weight. The SUVs in target regions were divided by SUVs determined in the cerebellum, the brain region with the lowest concentration of 5HT4R (4–7), to generate SUV ratios (SUVrs).
Kinetic modeling was performed using compartmental analysis (1-tissue [1T] and 2-tissue [2T] models) and Logan graphical analysis to estimate the volume of distribution (VT) in different brain regions (21,22). The 1T and 2T model-fitting performance was evaluated using the Akaike information criterion (AIC) and the model selection criterion (MSC), where the preferred model had the lowest AIC and highest MSC. The selected identifiability criterion was the percentage SE (%SE) of VT estimates. The binding potential BPND, defined at equilibrium as the ratio of specifically bound to nondisplaceable radiotracer uptake in tissue (21), was calculated indirectly as (VT – VND)/VND, where VND was the VT of the reference region. In addition, BPNDs were also estimated using noninvasive kinetic models—namely, the simplified reference tissue model (SRTM) and the Logan noninvasive graphical analysis (23,24)—as well as from the SUVrs at pseudoequilibrium (60–90 min after radiotracer injection) as BPND = SUVr-1. The cerebellum was used as a reference region for all BPND estimations.
Test–retest variability was calculated as the absolute of the SD of all measurements divided by the average value, expressed as a percentage.
For the mass effect study, all mass doses (D) were normalized to 70 kg of body weight to facilitate comparison between animals and to predict the mass dose limits for an adult human. The methodology used to estimate the radiotracer ID50 and to calculate the upper mass dose limits that will result in 5% or 10% receptor occupancy (D5 or D10, respectively) was based on previously published literature (supplemental materials) (25).
The 5HT4R occupancy induced by administration of SB204070 was calculated using 2 methods: percentage change of BPND between baseline and SB204070 blocking experiments (Eq. 1) and the Lassen plot method (Eq. 2) (26). Eq. 1
Eq. 1 Eq. 2which, when represented graphically for several regions (x = VT baseline, y = VT baseline – VT preblocking), produces a linear relationship, where the x intercept equals VND and the gradient equals global occupancy (O). Individual brain regions occupancy was also determined by deriving VND from the Lassen plot and subsequently applying Eq. 2 for occupancy quantification.
The occupancies measured with different methods were subsequently corrected for potential mass dose effects—that is, self-occupancy (supplemental materials).
RESULTS
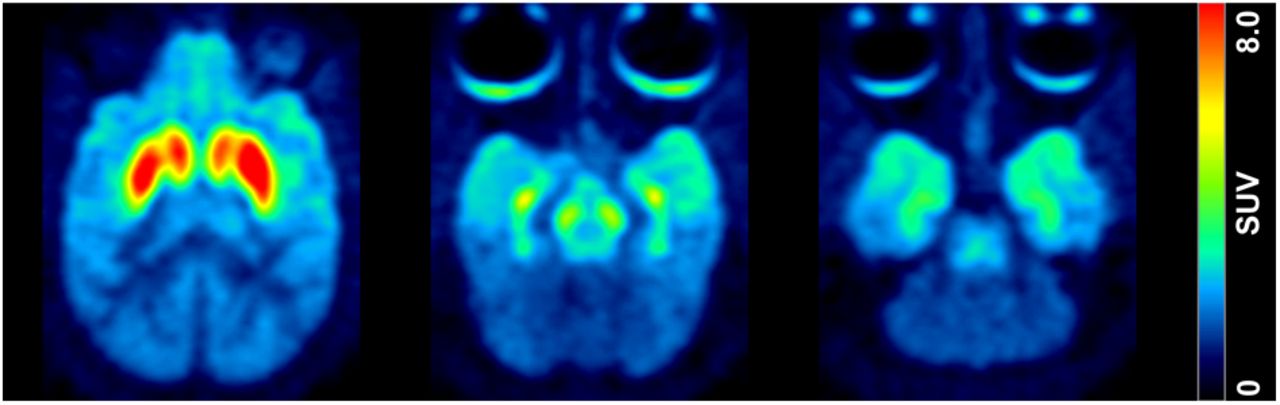
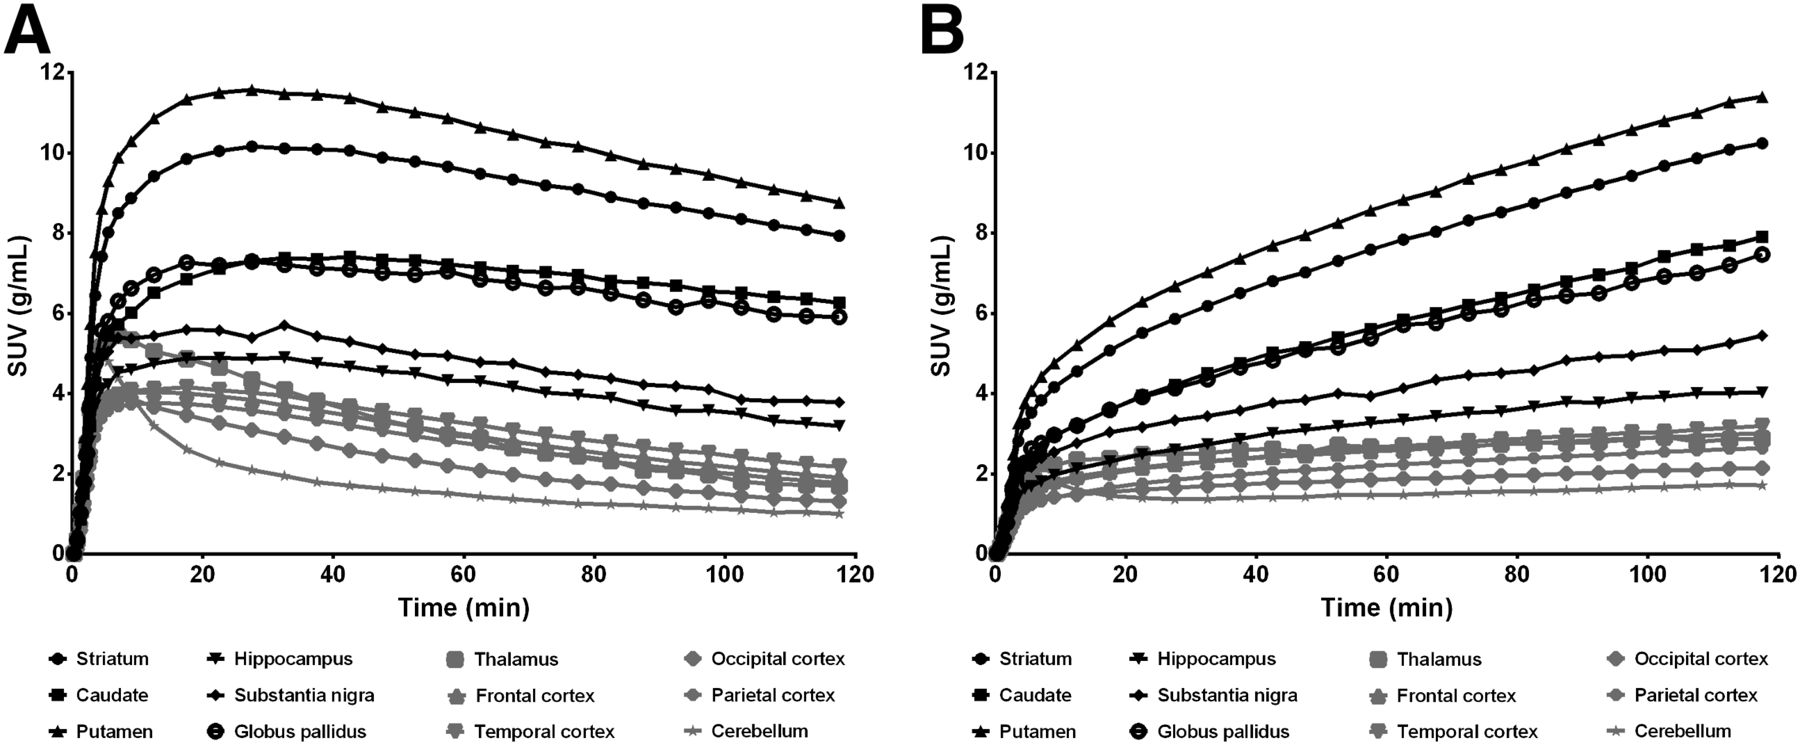
In vivo PET studies in rhesus monkeys showed that, after intravenous bolus injection, 18F-MNI698 rapidly entered the brain, with a peak percentage injected dose (%ID) in the whole brain of 6.6% ± 0.5% (n = 3). 18F-MNI698 distribution was consistent with known 5HT4R densities, being highest in the basal ganglia and limbic structures and lowest in the cerebellum (Figs. 1 and 2A). After intravenous bolus injection, a rapid in vivo metabolism of the radiotracer in blood was observed (Fig. 3) and at 2 h after injection less than 5% of parent was detected in plasma, which was within or below the instrumentation detection limits. When 18F-MNI698 was injected as a B+CI, the parent fraction in plasma at 2 h after injection improved to approximately 10% (Fig. 3). Regional time–activity curves in the brain after intravenous B+CI of 18F-MNI698 are shown in Figure 2B.

Representative PET SUV sum images (0–120 min) of 18F-MNI698 distribution in monkey brain. High uptake is observed in target regions: caudate and putamen (left), substantia nigra (middle), and hippocampal formation (right).

Representative SUV time–activity curves in different brain regions after bolus (A) or B+CI (B) injection of radiotracer.
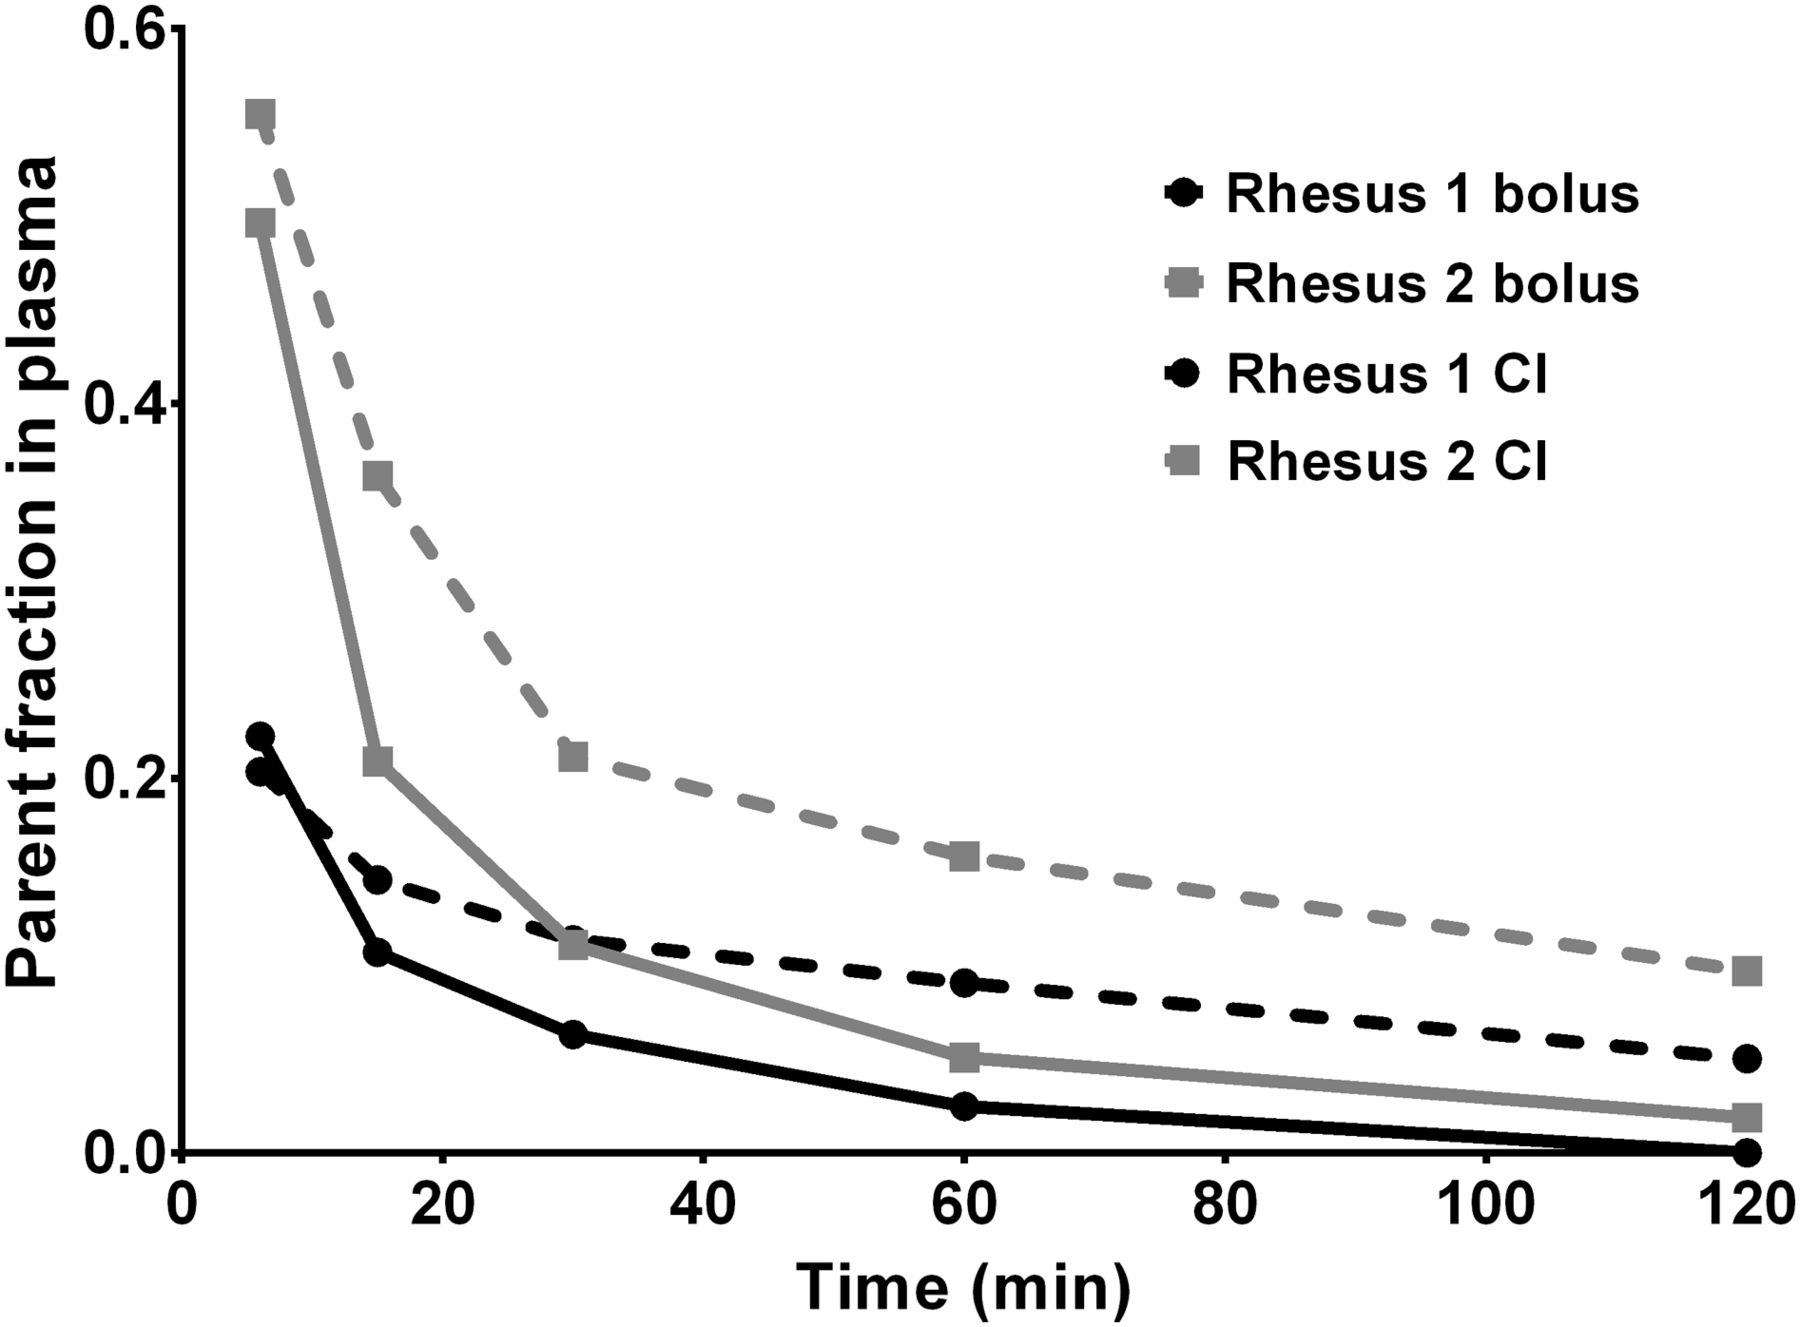
Parent fraction profile in plasma over time after bolus (full lines) or B+CI (dashed lines) injection of 18F-MNI698. CI = constant infusion.
Within the invasive compartmental methods of analysis, the 2T was found to be the preferred model, compared with 1T (lowest AIC and highest MSC values were obtained with the 2T model) (Table 1). The high-uptake-region time–activity curves were adequately fitted by both compartmental methods, but the 1T fitting was biased in the low-uptake regions (Supplemental Fig. 1). The Logan graphical analysis (t* = 25 min) was also able to fit the data adequately (Supplemental Fig. 1), and overall it was able to estimate VTs with the lowest %SE of all investigated invasive models (Table 1). The VTs determined by the 2T model were comparable to those estimated using the 1T model (Fig. 4A) and approximately 9.0% higher than the VTs estimated by the Logan graphical analysis, especially in the high-uptake regions (Fig. 4B; Table 1).
18F-MNI698 Kinetic Modeling Results Obtained Using 2T, 1T, and Logan Graphical Analysis with Arterial Input Function
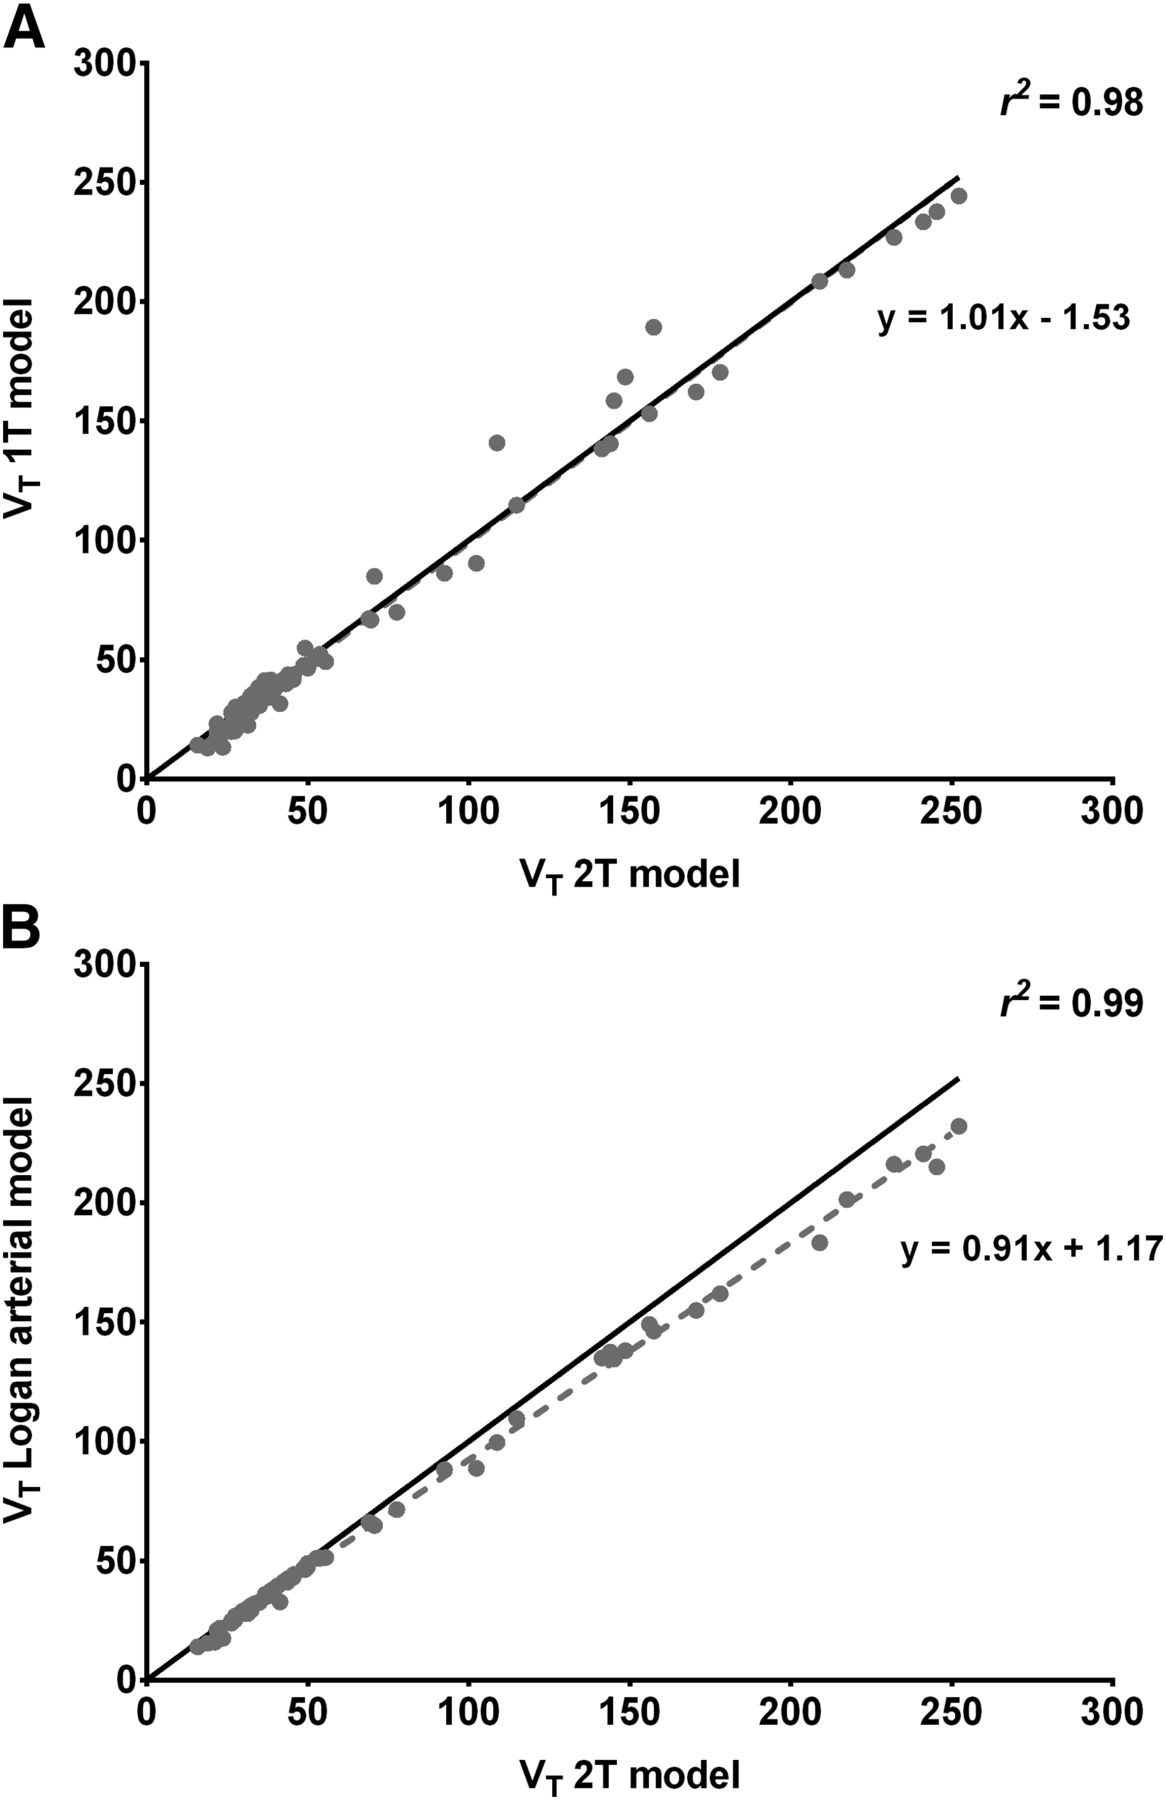
Comparative analysis between VTs obtained using 2T model and 1T model (A) or Logan graphical analysis (B) (r2 > 0.90 for both graphs). Correlations are close to line of identity (shown as dark bold line).
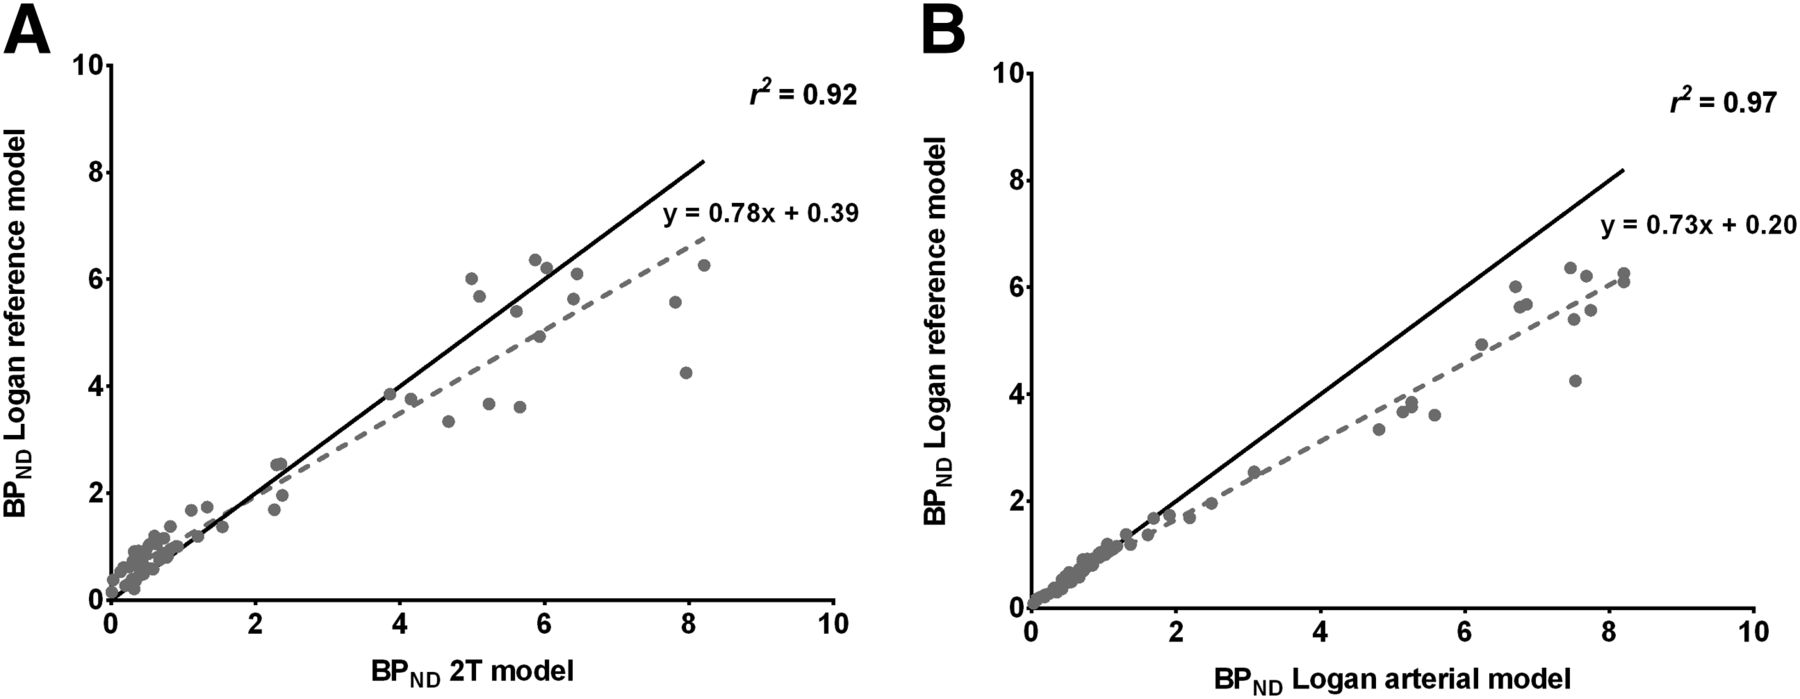
Apart from the BPNDs determined using the 1T model, all BPNDs measured in target regions ranged between 1.5 in the hippocampus and 7.8 in the putamen when invasive methods of quantification were used and between 1.3 in the hippocampus and 6.1 in the putamen when noninvasive methods of analysis were used (Table 2). The use of noninvasive methods of quantification, compared with the invasive methods, resulted in an underestimation of the BPNDs, which was more pronounced in the brain regions with high density of 5HT4R (Table 2; Supplemental Fig. 2). This underestimation was between 22% and 36% depending on the method of analysis used. The Logan noninvasive graphical analysis (t* = 25 min) was the noninvasive method of quantification with the least underestimation of BPNDs in comparison with invasive modeling (Fig. 5).
BPNDs Estimated Using Different Quantification Methods

Comparative analysis between BPNDs obtained using 2T model and Logan noninvasive reference model (A), and between Logan graphical analysis using arterial input function and Logan noninvasive reference model (B) (r2 > 0.90). Line of identity is shown as dark bold line.
Test–retest VTs estimated in target regions showed an agreement between measurements, where the percentage variability was 13% or less. The variability of BPNDs for test–retest measurements was overall lower for noninvasive methods of quantification than for invasive methods and was on average 15% or less (Table 3).
Test–Retest Results in Target Regions for Each Individual Rhesus Monkey
Increasing the mass dose reduced the BPNDs for both studies (α < 1). The radiotracer ID50 was estimated to be 248.3 ± 56.6 μg for a 70-kg body weight (i.e., ∼3.5 μg/kg) (Table 4). The quantification of striatal 5HT4R occupancy by SB204070 using different methods is shown in Figure 6. A dose-dependent receptor occupancy was observed and doses of SB204070 of 50 μg/kg or more induced greater than 90% occupancy. The relationship between receptor occupancy measured with invasive methods versus noninvasive methods was linear, correlated strongly, and was close to the line of identity (Supplemental Figs. 3A and 3B). The VTs measured in the reference region (i.e., the cerebellum) at baseline were not statistically significantly different from those measured at preblocking conditions with high doses of SB204070 (P > 0.05, 2 tailed t test) and were similar to derived VNDs from the Lassen plots (Supplemental Fig. 3C).
Summary of Injected Mass Doses Normalized to 70 Kilograms of Body Weight and Corresponding Estimates of ID50, D10, and D5
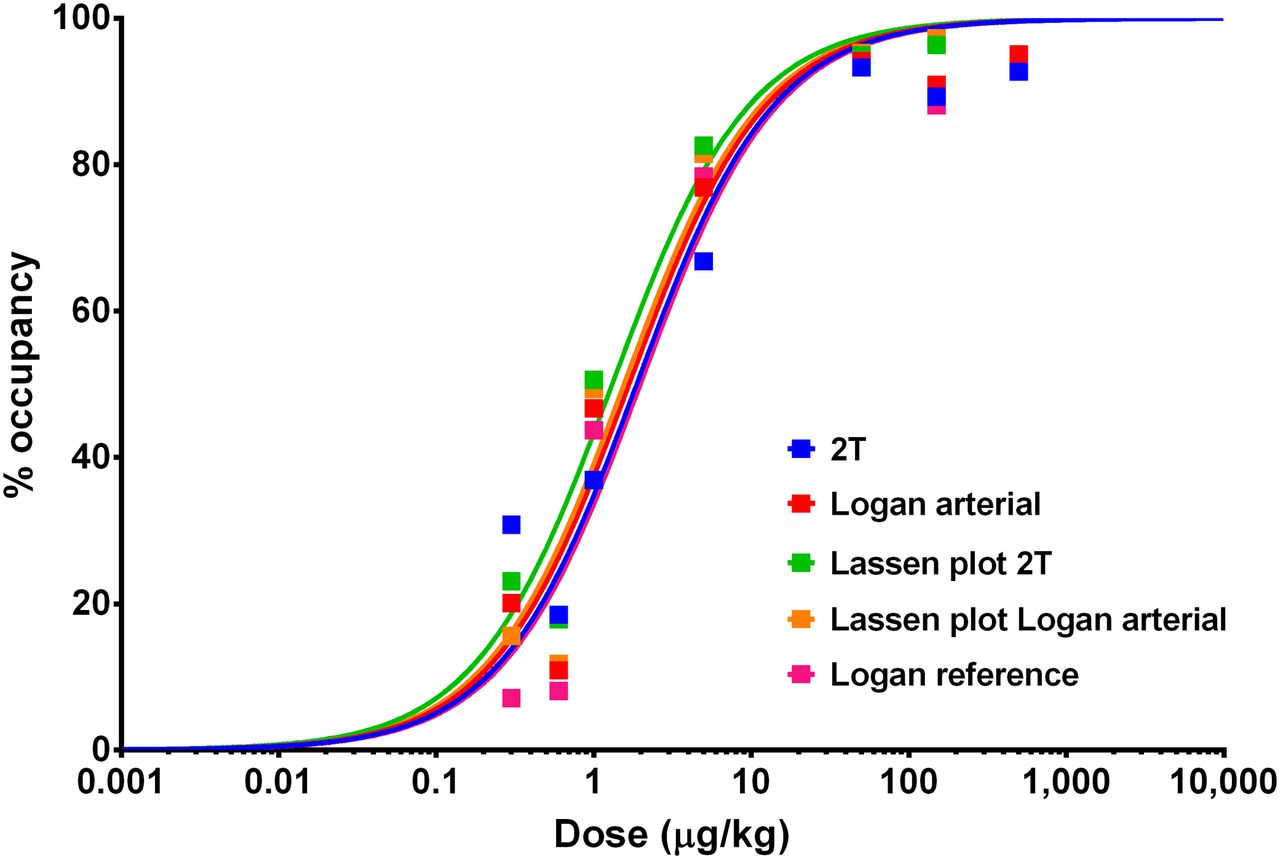
SB204070 dose-dependent occupancy curve measured using PET with 18F-MNI698 in striatum of rhesus monkeys (drug dose resulting in 50% receptor occupancy was 1.87, 1.67, 1.31, 1.55, and 1.97 μg/kg using 2T, Logan plot, 2T with VND derived from Lassen plot, Logan plot with VND derived from Lassen plot, and noninvasive Logan plot, respectively).
DISCUSSION
The present study investigated a new 18F-labeled radiotracer for imaging 5HT4R in the brain in nonhuman primates. To our knowledge, 18F-MNI698 is the first successful 18F-labeled radiotracer for imaging 5HT4R in the nonhuman primate brain developed to date. After intravenous bolus injection, 18F-MNI698 displayed high brain penetration, with a peak %ID in the whole brain of 6.6% and peak SUVs as high as 8.0 in target regions. In addition, the radioactivity distribution in the brain was consistent with known 5HT4R densities and agreed with the reported brain labeling of 11C-SB207145, the only other known PET radiotracer for imaging of 5HT4R in the brain (4–7,16–18). The good brain penetration of 18F-MNI698 compares favorably with other radiotracers previously developed. For example, intravenous injection of 123I-SB207711 into cynomolgus monkeys yielded a peak %ID in the whole brain of approximately 2.28% (19).
After intravenous bolus injection, 18F-MNI698 was rapidly metabolized in vivo in rhesus monkey blood. Previous studies with another 5HT4R radiotracer structurally similar to 18F-MNI698 have found similar results in different species (16,18). To improve the reliability of metabolite quantification, 18F-MNI698 was injected as a B+CI and data subsequently quantified using this imaging paradigm. This procedure improved blood and metabolite quantification, allowing for adequate kinetic modeling analysis using more robust arterial input functions.
The pharmacokinetics of the radiotracer were reversible and well described by both the 2T model and the invasive Logan graphical analysis. High BPNDs of approximately 1.3–7.0 were measured in target regions using either invasive or noninvasive methods of analysis. Previous studies using Göttingen minipigs and 11C-SB207145, a potent radiotracer for imaging 5HT4R in the brain, reported BPNDs in the striatum of around 2.0 (17). In humans, 11C-SB207145 BPNDs in the striatum and hippocampus were determined to be around 2.6–4.2 and 0.8–1.1, respectively (18,27). 123I-SB207711 BPNDs in rodents and cynomolgus monkeys were found to be approximately 2.4 and 3.0, respectively (19). Although it is not possible to directly compare our data in nonhuman primates with rodent, minipig, or human data previously published, due to species and acquisition mode differences, the BPNDs of 18F-MNI698 in target regions compare favorably with other 5HT4R radiotracers previously reported. The high BPNDs measured with 18F-MNI698 would provide the opportunity to assess 5HT4R in areas with moderate to high densities (e.g., substantia nigra and hippocampus), which would be potentially more challenging to interrogate with radiotracers with lower BPNDs.
Noninvasive quantification methods were able to estimate BPNDs, although a negative bias of 22%–36% was obtained with those methods, especially in the slowest kinetic target regions. A similar observation has been reported for 11C-SB207145 in humans (18). The underestimation of BPNDs observed with the SRTM compared with invasive methods is likely due to violations of SRTM assumptions that require 1T in the reference region (23). Interestingly, the BPND underestimation determined when using the noninvasive methods for data quantification was still present even when applying the Logan noncompartmental analysis, although this bias was marginally smaller than the bias measured for the SRTM. It is unlikely this underestimation is due to specific binding in the reference region (i.e., the cerebellum), given that previous studies have shown negligible levels of 5HT4R in the cerebellum (4–7). Furthermore, in this study, the cerebellum had the lowest uptake and VTs of all investigated regions, and preblocking studies with SB204070 showed no significant differences in cerebellar VTs between baseline and blocking studies, with a good agreement between cerebellar VTs and Lassen plot–derived VNDs. Taken together, the data support the use of the cerebellum as a reference region for estimation of BPNDs.
The 18F-MNI698 test–retest variability determined here compares favorably with the previously reported test–retest variability of 11C-SB207145 (18), and it was lowest when noninvasive methods were used for data quantification, which could be attributed to blood measurement errors leading to an increase of test–retest variability when using invasive methods.
The measured upper mass dose limits for 18F-MNI698 were 13.1–27.6 μg per 70 kg of body weight. Knowing a radiotracer upper mass dose limits is of key importance to establish acceptable specific activity levels during radiotracer quality control procedures and to ensure that the PET data acquired is not affected by any mass dose effects. Although it is unlikely that the no-observable-effect level would be breached at injected doses below the mass dose upper limit, evaluating the no-observable-effect level before future human studies might be required.
The radiotracer binding was blocked in a dose-dependent manner by SB204070 (drug dose resulting in 50% receptor occupancy was 1.5 μg/kg), confirming the selectivity of 18F-MNI698-specific signal for the 5HT4R. Data also showed that, despite the negative bias of BPNDs determined with noninvasive methods, compared with invasive methods of analysis, the occupancy measured by noninvasive methods correlated strongly with the occupancy measured with invasive methods and this relationship was close to the line of identity.
Studies presented here were acquired under anesthesia with isoflurane, a commonly used anesthetic for in vivo imaging. Serotonin, like other biologic molecules, is involved in multiple physiologic systems of relevance during anesthesia, and evidence has shown that anesthesia can play a potential role in radiotracer uptake and binding (28,29). Thus, it is possible that the use of anesthesia could have a secondary effect on 18F-MNI698 uptake and binding. Nonetheless, despite its drawbacks (consequence of direct effects on physiologic functions), properly monitored anesthesia can often provide suitable conditions for in vivo imaging of the living brain of laboratory animals.
For the experiments reported here, 18F-MNI698 was obtained with approximately 3% decay-corrected radiochemical yield. Improvement of this yield is desirable, especially for future multicenter human studies. Thus, work to optimize 18F-MNI698 radiochemical yield is under way, now that we have established that 18F-MNI698 is a promising radiotracer for imaging of 5HT4R in brain.
CONCLUSION
18F-MNI698 displayed a good brain penetration in monkeys and its distribution in the brain was consistent with known 5HT4R densities. High BPNDs were measured in target regions and a good test–retest variability was determined. Data indicate that the cerebellum can be used as a reference region for data quantification, although BPNDs measured with noninvasive methods, compared with invasive methods, are biased, especially in regions with high 5HT4R density. The 18F-MNI698 mass dose upper limit (occupancy < 5%) was found to be 13.1 μg per 70 kg of body weight. Finally, 18F-MNI698 binding in target regions was blocked by the selective 5HT4R antagonist SB204070 in a dose-dependent manner, confirming the radiotracer-specific signal for the 5HT4R. Human studies are warranted based on these study results.
DISCLOSURE
The costs of publication of this article were defrayed in part by the payment of page charges. Therefore, and solely to indicate this fact, this article is hereby marked “advertisement” in accordance with 18 USC section 1734. No potential conflict of interest relevant to this article was reported.
Acknowledgments
We thank Yun Zhang for assistance with metabolite analysis and Amy Amenta for technical assistance with studies preparation and logistics.
Footnotes
Published online Mar. 31, 2014.
- © 2014 by the Society of Nuclear Medicine and Molecular Imaging, Inc.
REFERENCES
- Received for publication October 7, 2013.
- Accepted for publication January 27, 2014.


