


Article Figures & Data
Figures
- FIGURE 1.
First prototype PET scanner (positron emission transaxial tomograph, PETT) (1). (A and B) Schematic and picture show that total of 24 crystals were arranged in hexagonal shape providing 1 transaxial image slice. (C) Image of phantom filled with activity and cold spots that could be imaged with this apparatus. (Reprinted from (171).)
- FIGURE 2.
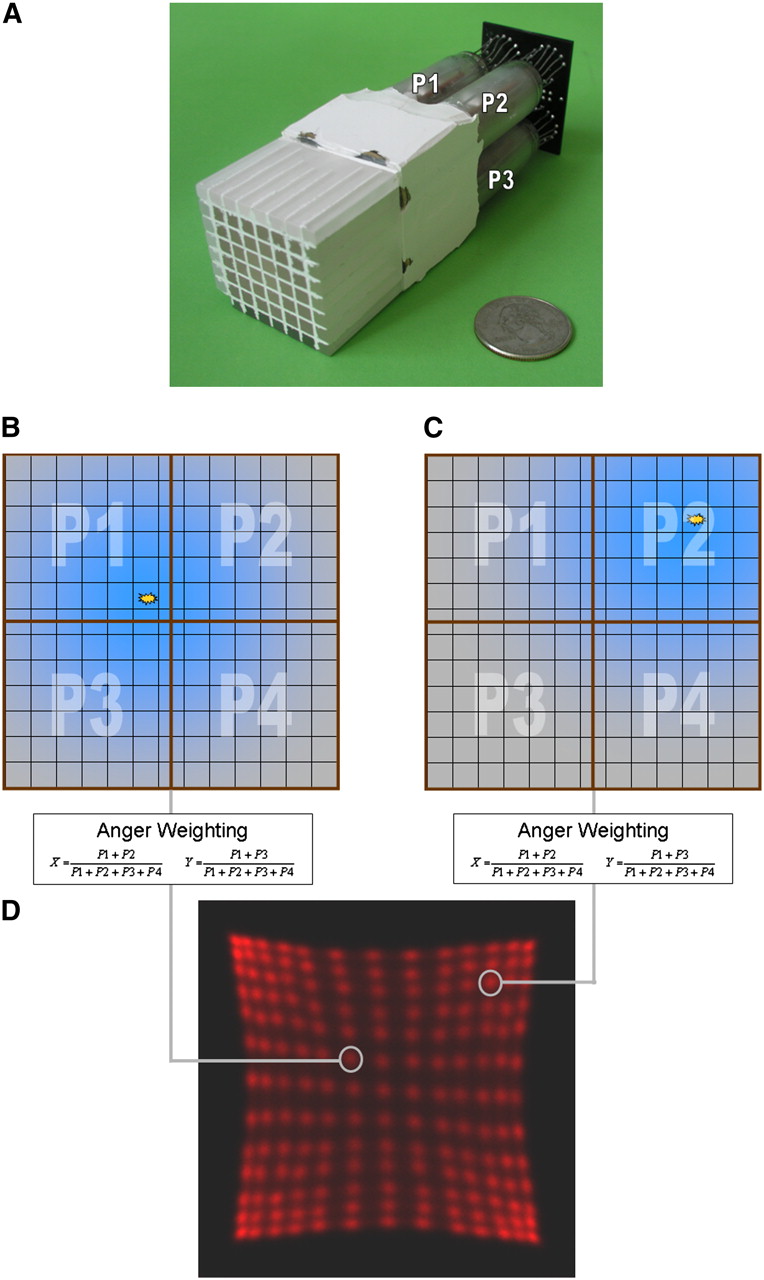
Block detector. (A) Example of PMT-bismuth germanate block detector from clinical PET scanner. Readout is performed using only the 4 PMTs that are connected to pixilated scintillator block. Light sharing is used to distribute light originating from single pixel between the 4 readout PMTs (P1, P2, P3, P4). (B and C) Depending on crystal position, light will be uniquely distributed to readout PMTs. (D) Using Anger weighting algorithm on measured signals, position of incident event can be calculated and assigned to position profile. (Courtesy of University of Tübingen.)
- FIGURE 3.
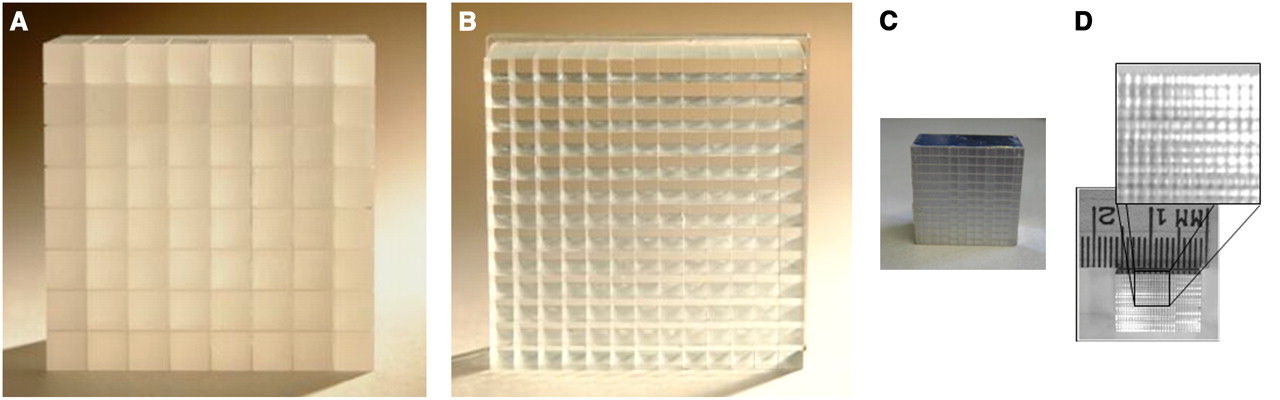
Scintillation crystal blocks for PET detectors. Size of each individual scintillator used for detector block depends on application field and defines intrinsic resolution of PET scanner. (A) Early clinical PET scanners used 6 × 6 mm bismuth germanate crystals arranged in 8 × 8 matrix. (B) Newer generations of PET systems (124) use, for instance, 13 × 13 LSO array with only 4 × 4 mm cross-sectional crystals. (C) Preclinical systems aim for spatial resolution below 1.5 mm and use, for example, 12 × 12 array of LSO scintillators with size of 1.5 × 1.5 × 10 mm. (D) New research has focused on reducing crystal pixel size to improve spatial resolution. Crystal block with crystals of only 0.43 × 0.43 mm in cross section was successfully fabricated and read out by Stickel et al. (34). (Panels A and B courtesy of Siemens Medical Solutions; panel C courtesy of University of Tübingen; panel D reprinted from (8).)
- FIGURE 4.
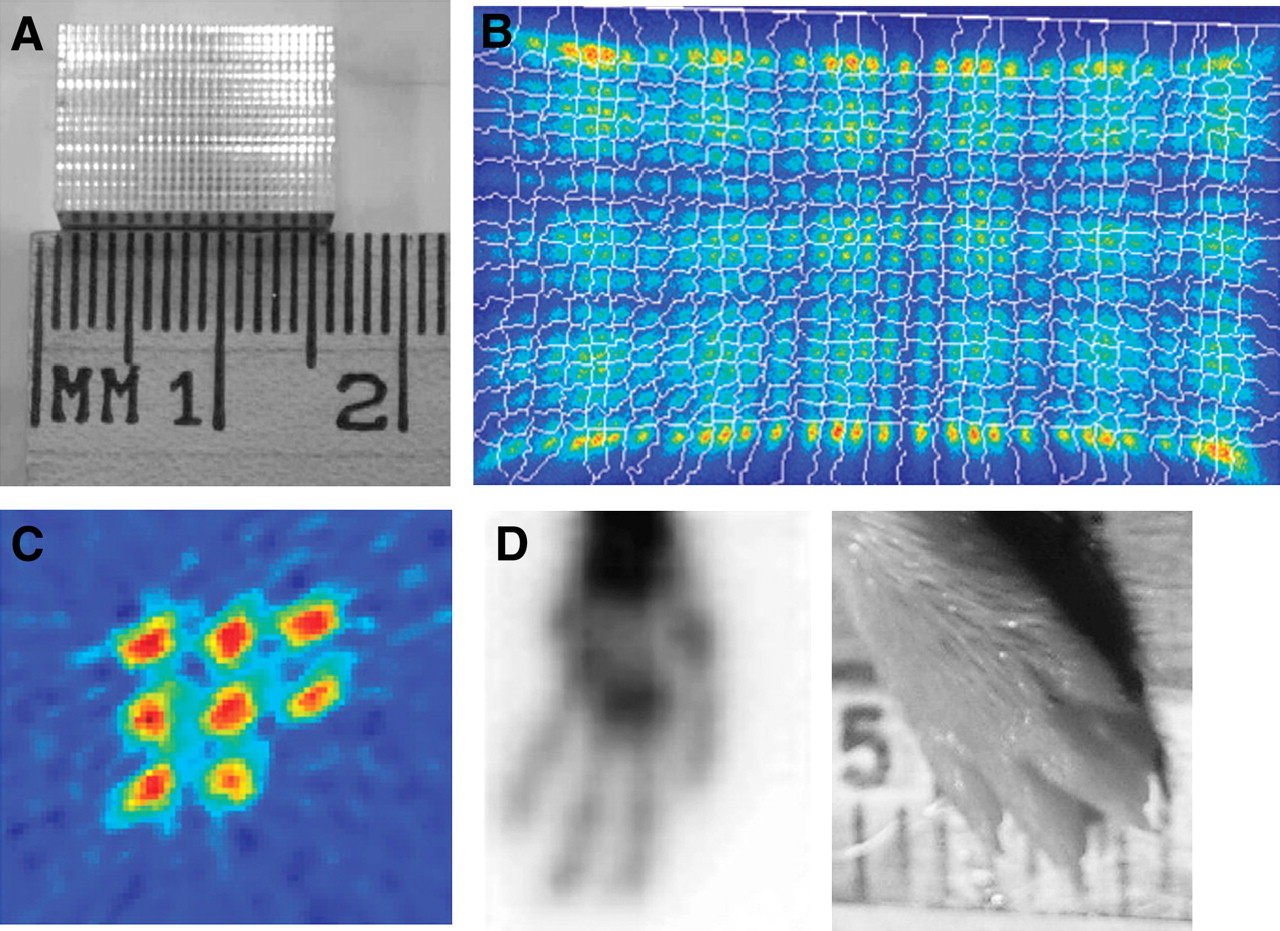
Small pixilated block detectors (8). (A) Ambition to achieve smaller resolution encouraged fabrication of LSO crystal blocks with 20 × 30 elements, each with cross-section of only 0.43 × 0.43 mm. (B) Even though crystal size is small, position profiles of block could be acquired using 64-channel position-sensitive PMT. (C and D) Two of these LSO blocks have been operated in coincidence to acquire phantom images of 0.5-mm rod source phantom (C) and mouse paw (D). (Reprinted from (8).)
- FIGURE 5.
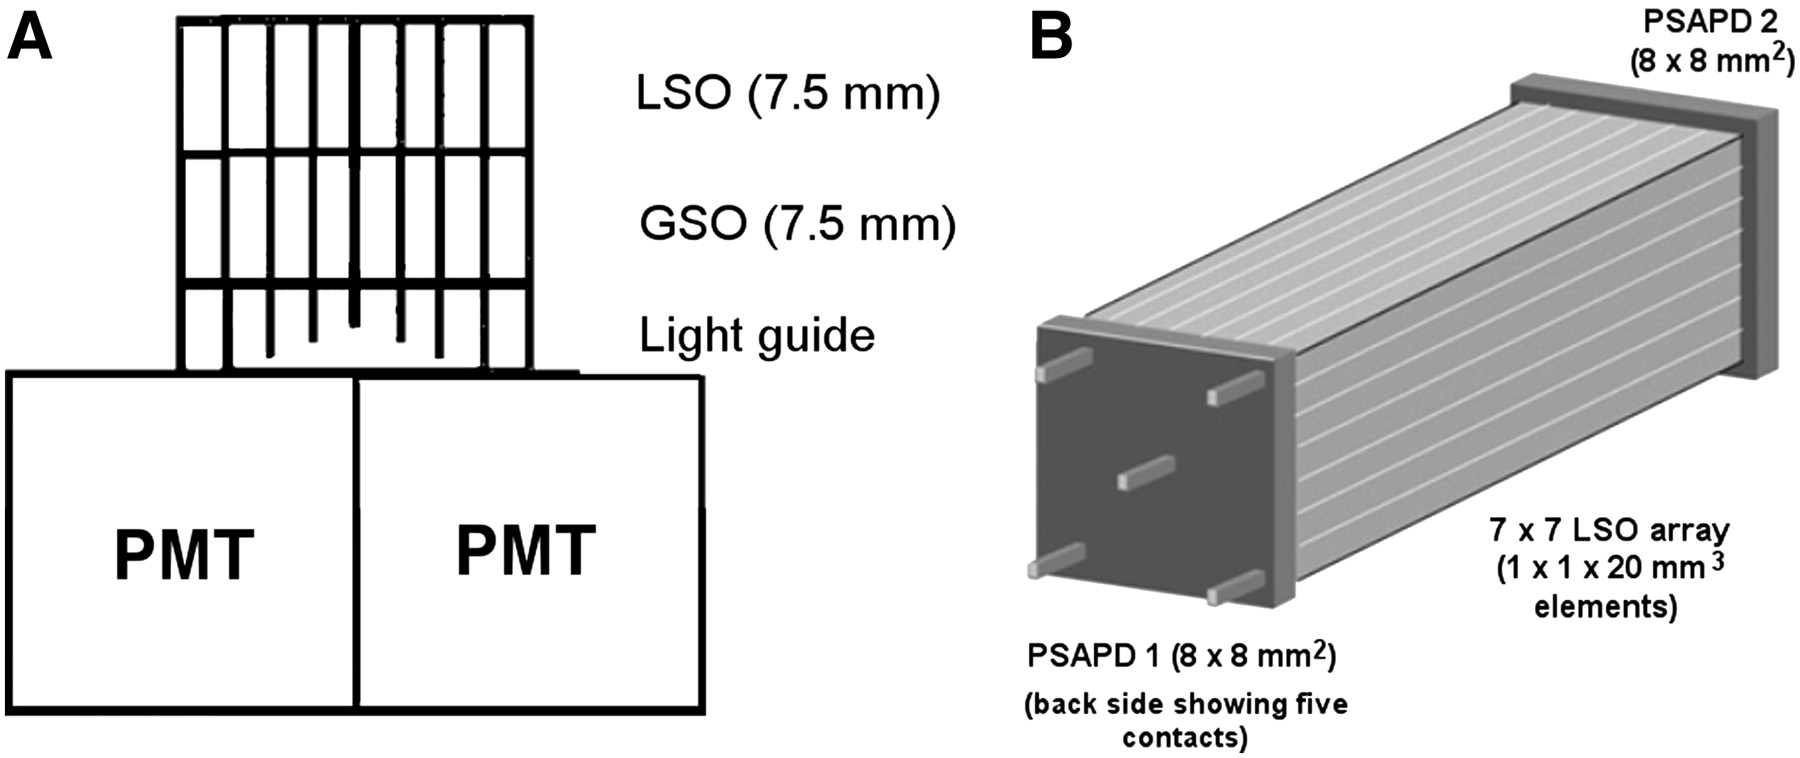
DOI schemes for PET block detectors. Different methods can be used to acquire information on location of γ-interaction in crystal. (A) One approach is a stack of 2 or more crystal layers with different scintillation properties, which allow for upper and lower crystal layer to be distinguished by discriminating different scintillation decay times. (B) Continuous DOI can be gained by reading scintillation light from both sides of scintillation crystal. In this approach, position-sensitive APDs (PSAPDs) are used to read scintillation light on each side. Comparing amount of light collected on each side of scintillator allows for calculation of DOI with resolution of 3–4 mm (26). All these approaches are challenging technologies and currently not implemented in any standard clinical PET system. (Panel A © 1998 IEEE and reprinted with permission of (172); panel B reprinted from (38).)
- FIGURE 6.
Example of APD implemented as single detector with 5 × 5 mm (center) active surface and monolithic array of 9 APDs each having 5 × 5 mm active surface. Thickness of APD is only 1.5 mm, including housing. (Courtesy of University of Tübingen.)
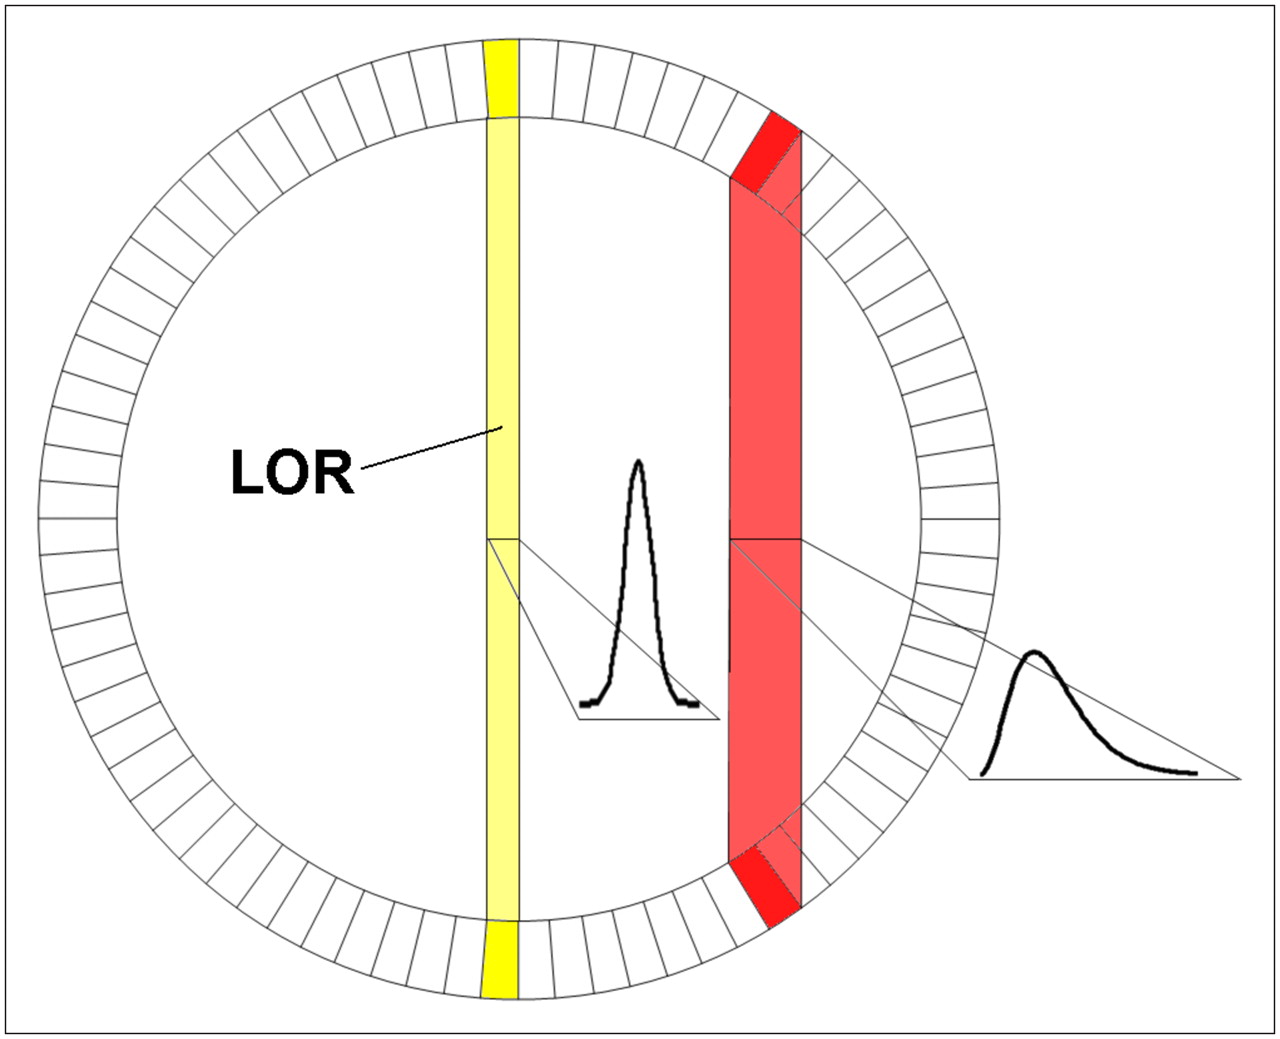
- FIGURE 7.
To achieve high sensitivity in PET system, scintillators cannot be very short because of resulting limited stopping probability for 511-keV γ-quanta. If longer crystal is used and no DOI information is available, image resolution will gradually degrade when going toward edge of field of view because LOR starts to broaden. Therefore, one has to compromise between sensitivity (long crystal) and image quality. (Courtesy of University of Tübingen.)
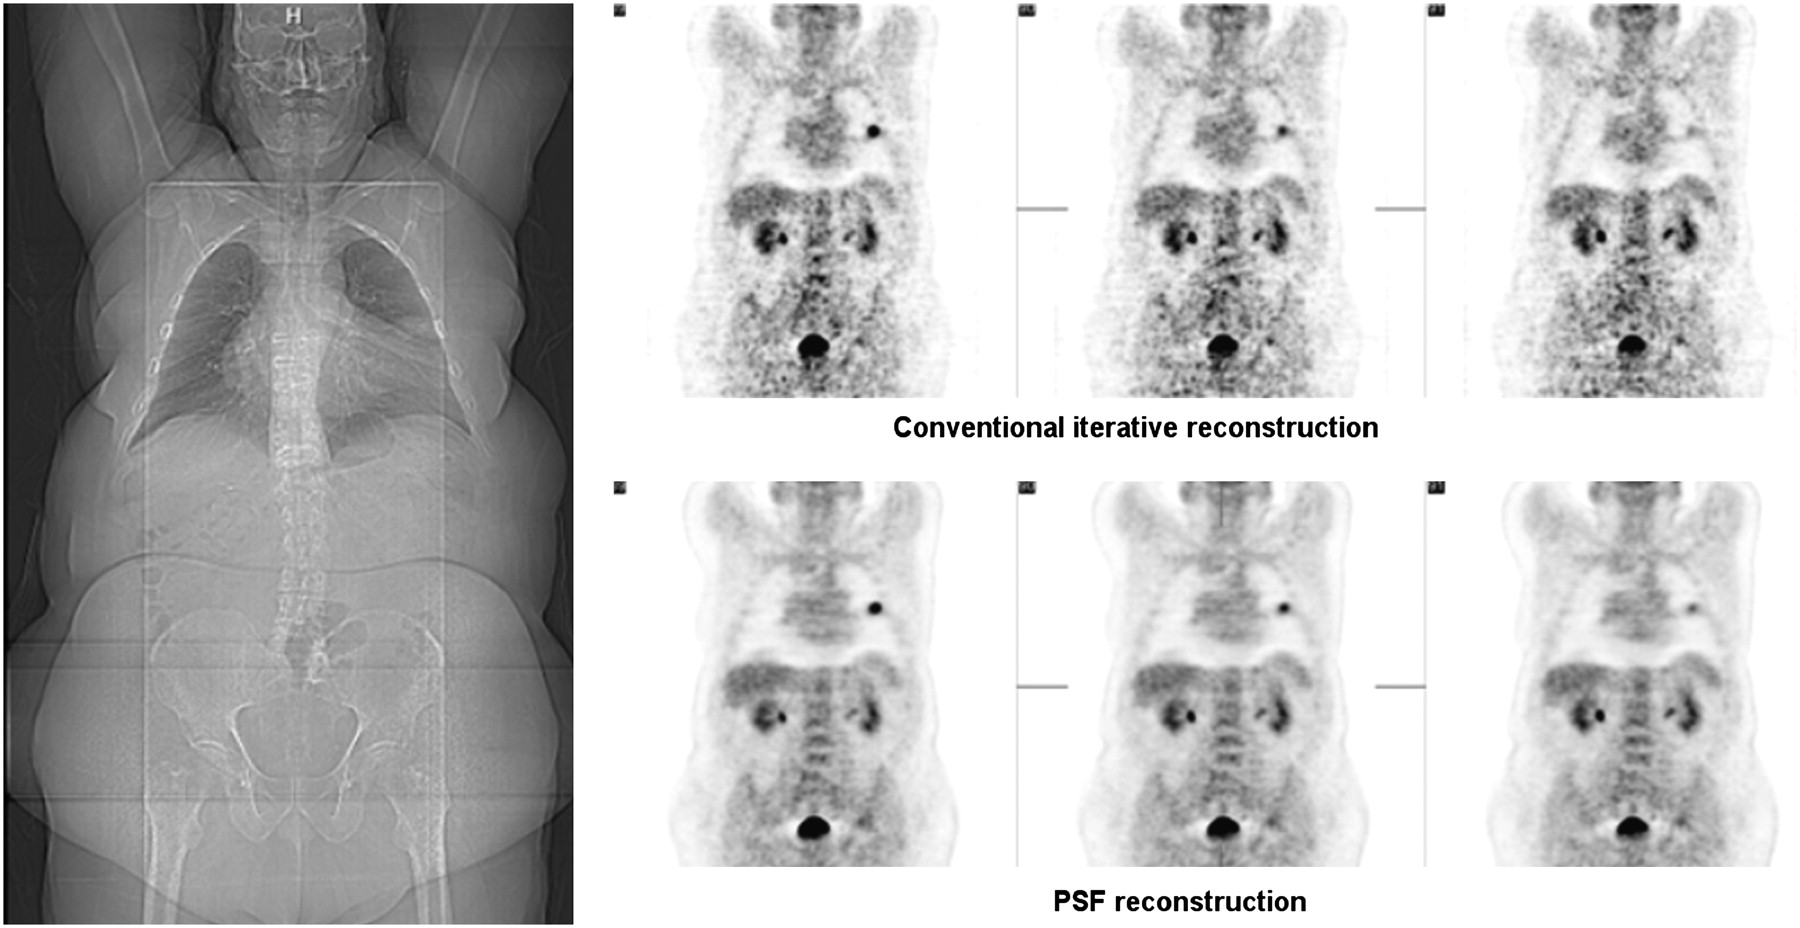
- FIGURE 8.
Advanced reconstruction algorithms attempt to include information about scanner geometry and properties for improving image quality. Point spread function, which is specific for a certain scanner, can be used to significantly improve image quality in terms of noise and contrast. Effect in obese patients is increased because ratio of true and random events is unfavorable. Example of patient with body mass index of 44.2 (144 kg) shows clear benefit of advanced reconstruction algorithm using point spread function. (Courtesy of Siemens Medical Solutions.)
- FIGURE 9.
Ability of PET scanner to accurately measure time between 2 γ-interactions from 1 annihilation is defined as TOF capability. If no TOF information is available (time resolution > 1,500 ps), probability that coincidence occurred along 1 LOR is basically same (A). However, if time resolution can be increased (<600–800 ps), location of annihilation can be narrowed to several centimeters (B and C). In ideal PET system, where time resolution would be good (e.g., 15 ps), position of annihilation could be determined within several millimeters and would no longer require image reconstruction (D). (Courtesy of University of Tübingen.)
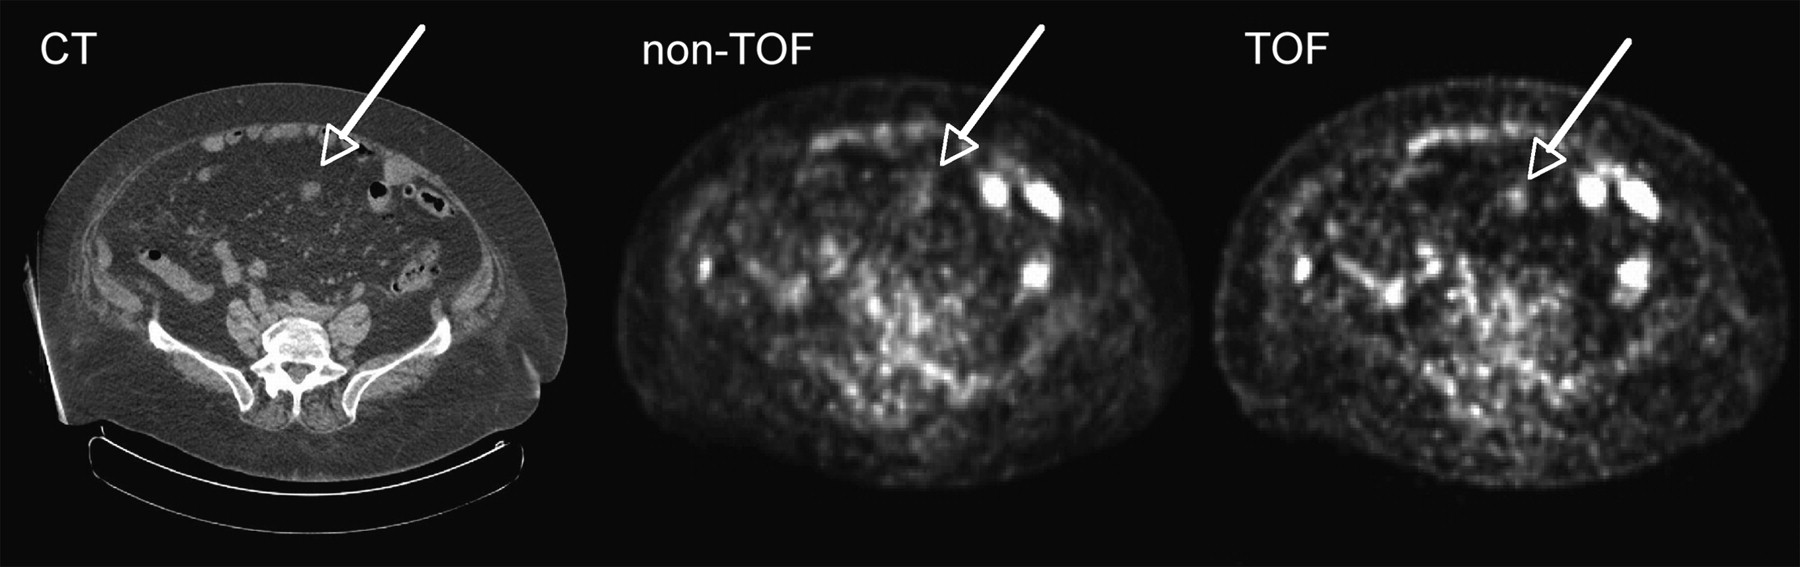
- FIGURE 10.
TOF PET images acquired with Phillips Gemini TF PET scanner. One can see that obese patient (119 kg; BMI, 46.5) particularly benefits from information gained because of time resolution of 600 ps. (Courtesy of Philips Medical Systems.)
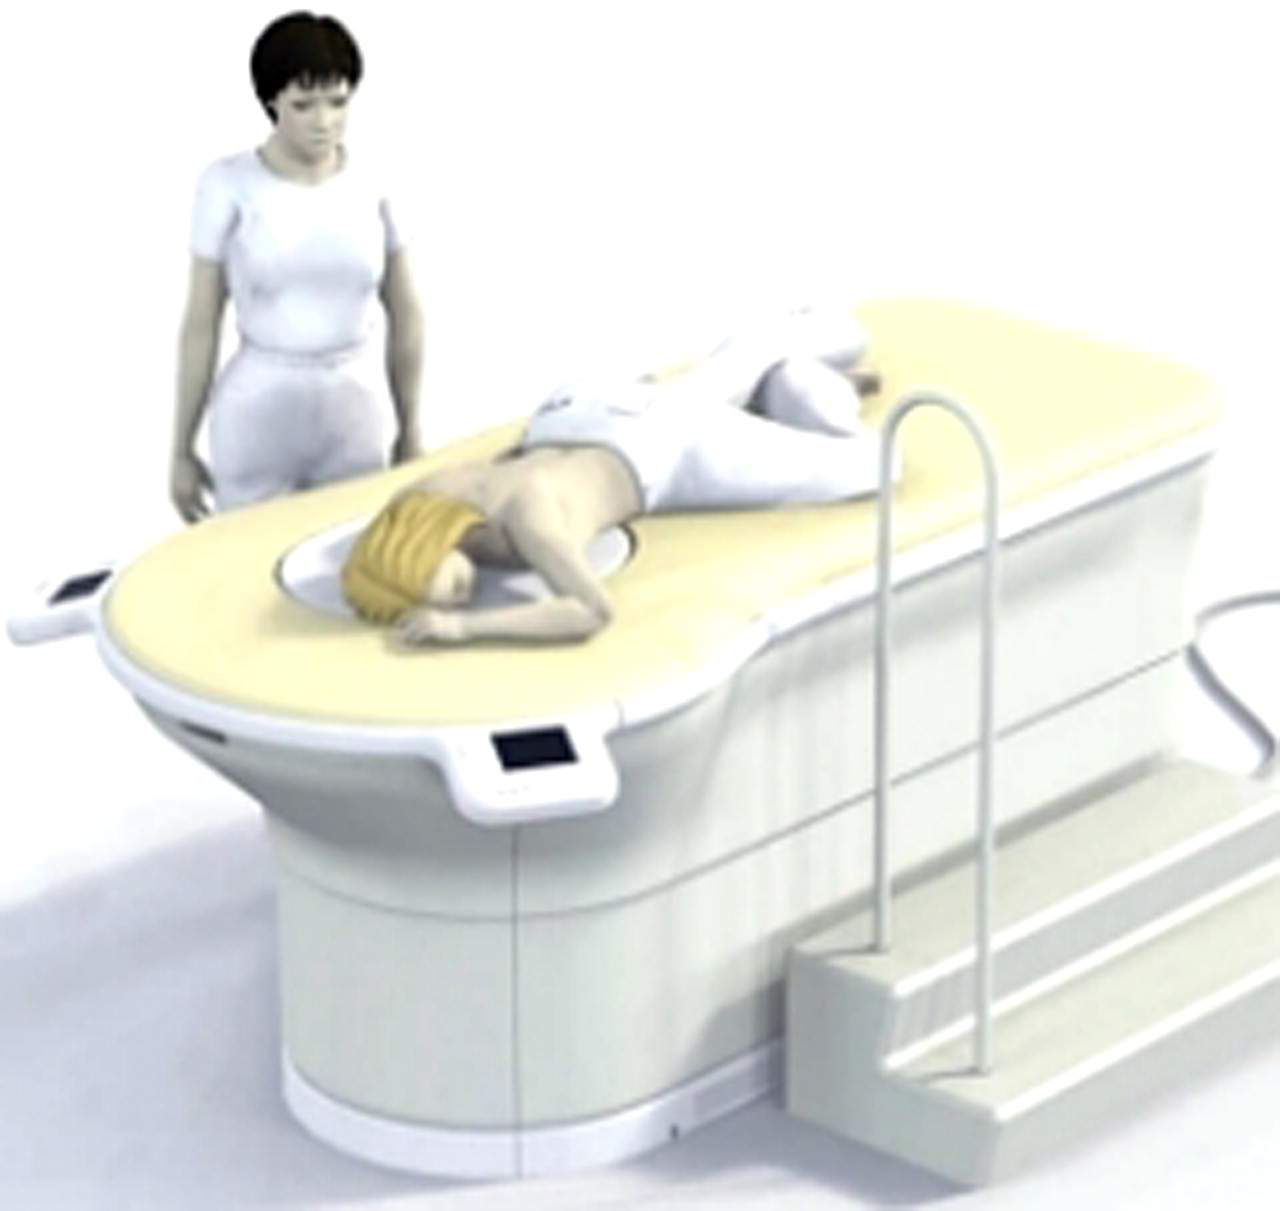
- FIGURE 11.
Optical mammography. Optical imaging, which is widely used in field of preclinical imaging, can successfully be applied for mammography applications in which high resolution is desirable but field of view is smaller. (Courtesy of Philips Medical Systems.)
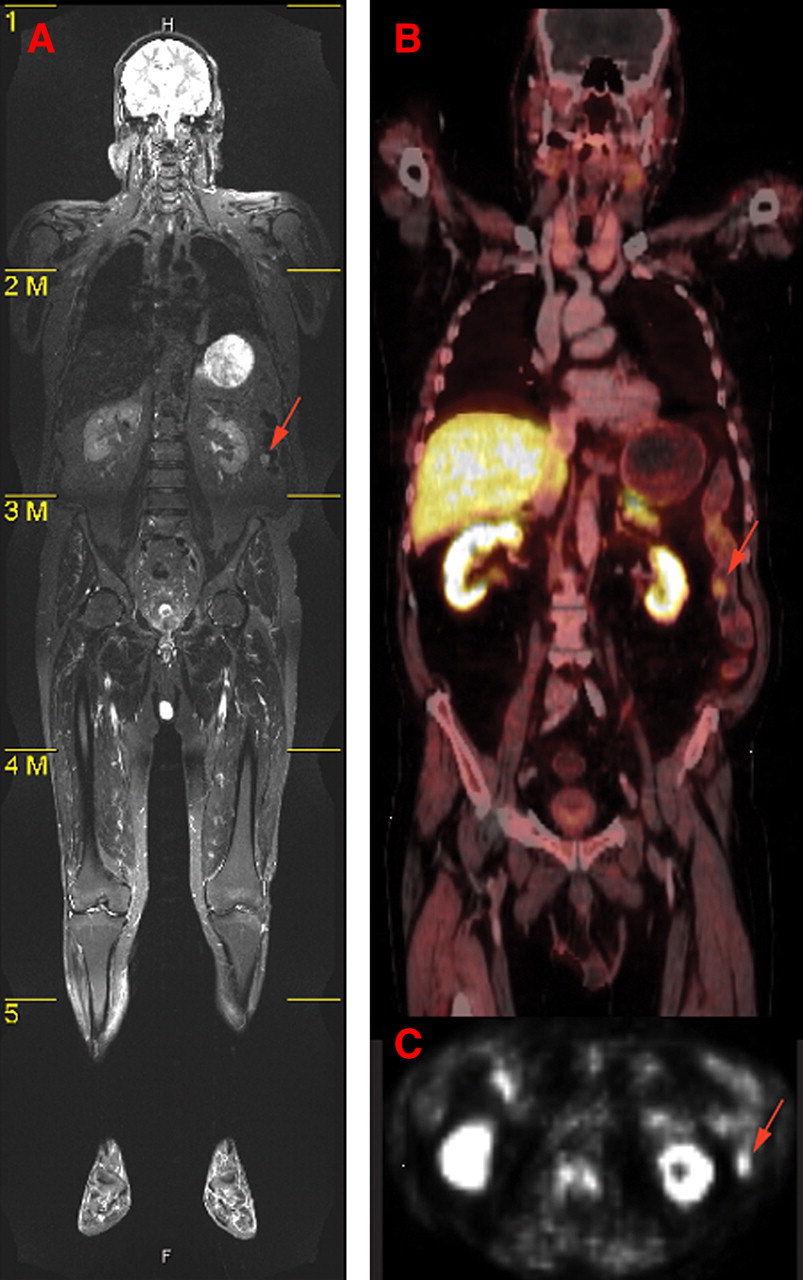
- FIGURE 12.
(A) High soft-tissue contrast of MR image is apparent in whole-body MRI tomogram of human. (B) In contrast, fused PET/CT image shows mainly bone structures. Metabolic PET images (B and C) clearly depict tumor area (arrow) that appears also in MR image. Anatomic information is most prominent in MR image, whereas PET image can help to guide diagnostic focus toward abnormalities in metabolism. These abnormalities can then also be identified as structural malignancies in PET images. (Courtesy of Heinz-Peter Schlemmer, University of Tübingen.)
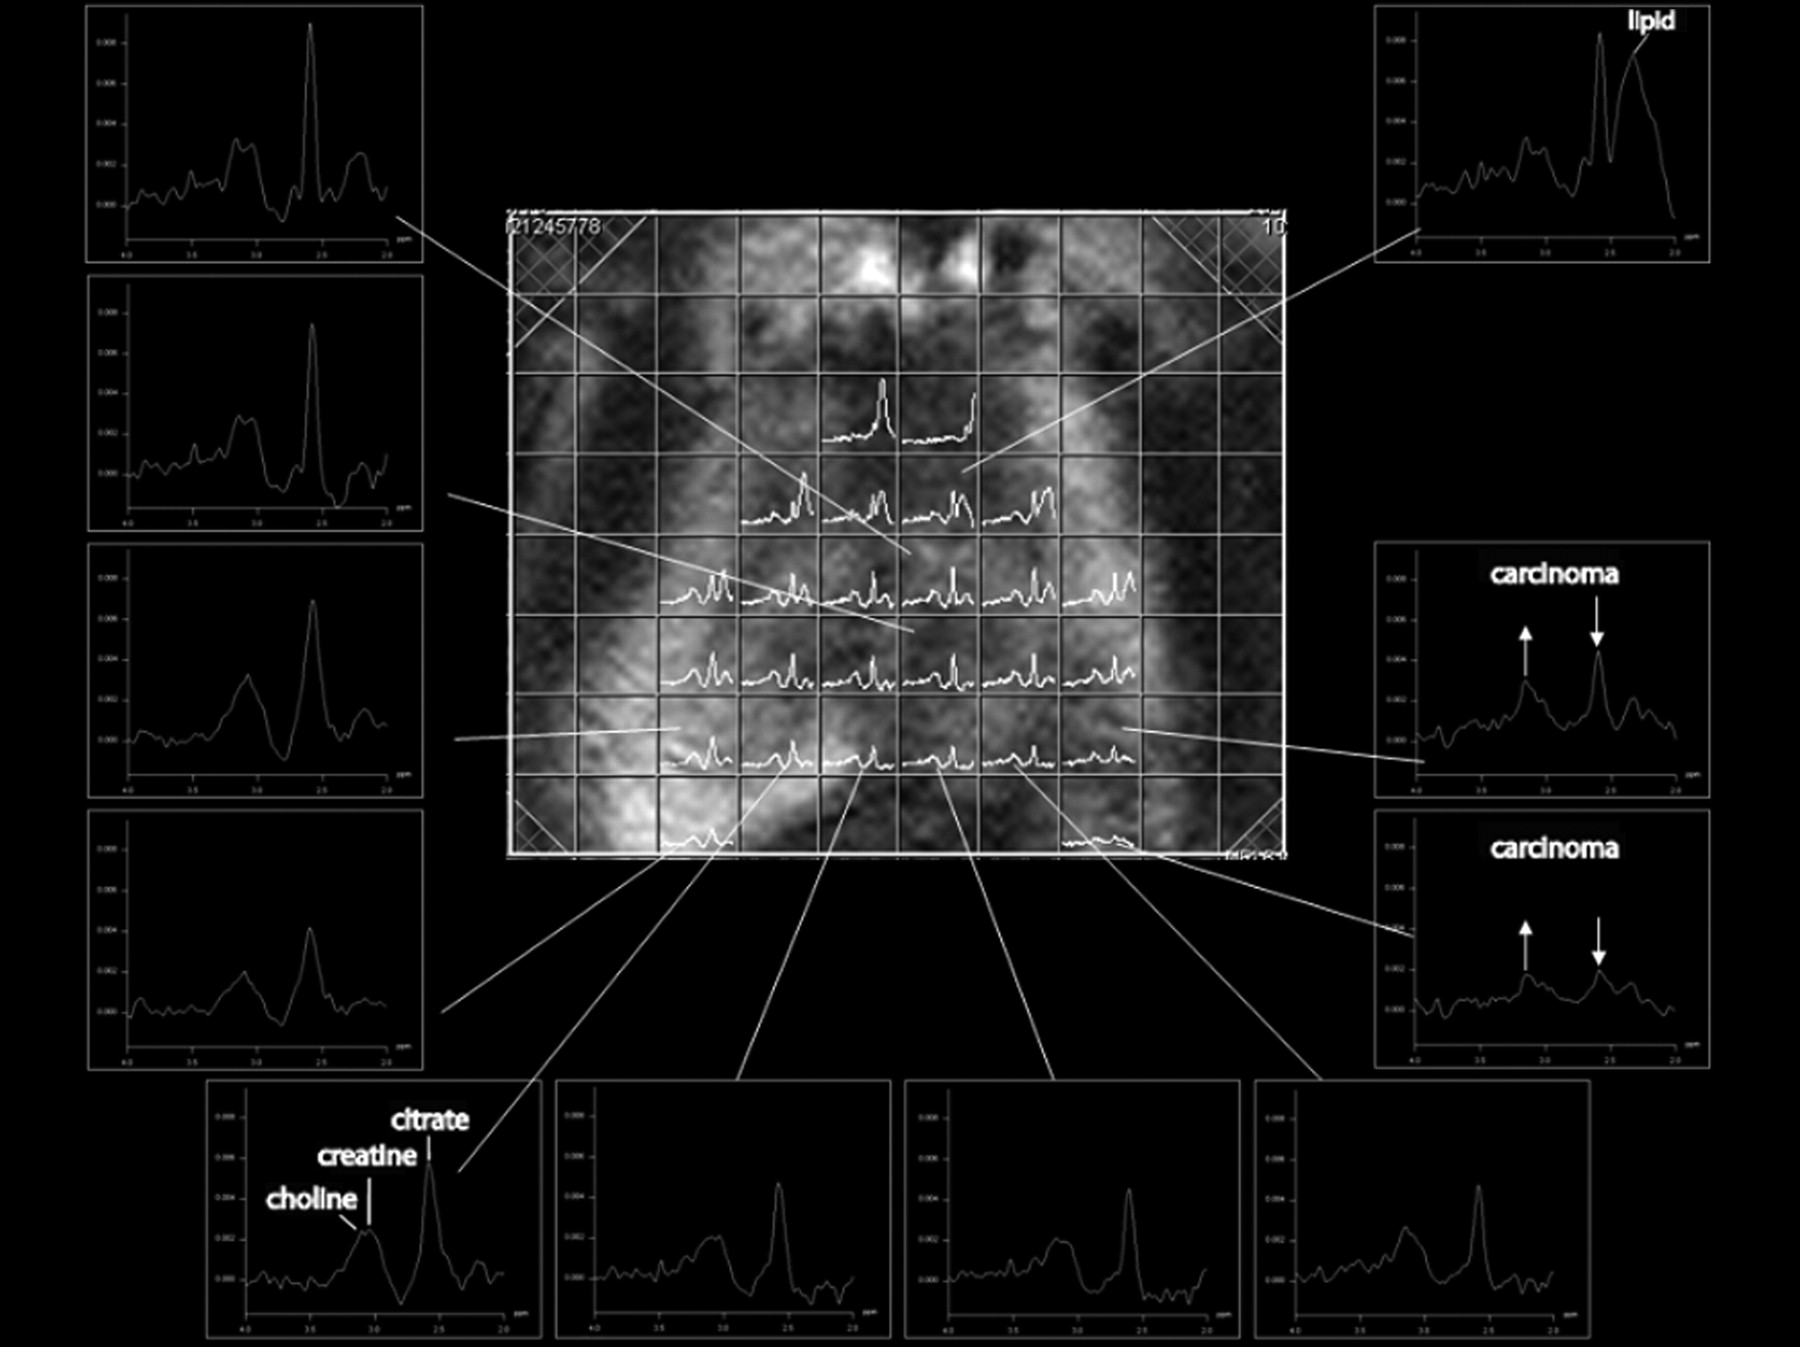
- FIGURE 13.
MR spectroscopy of prostate. Spectra are obtained from different voxels. Carcinogenic tissue can be differentiated by increase of choline signal and decrease of citrate signal. (Courtesy of Heinz-Peter Schlemmer, University of Tübingen.)
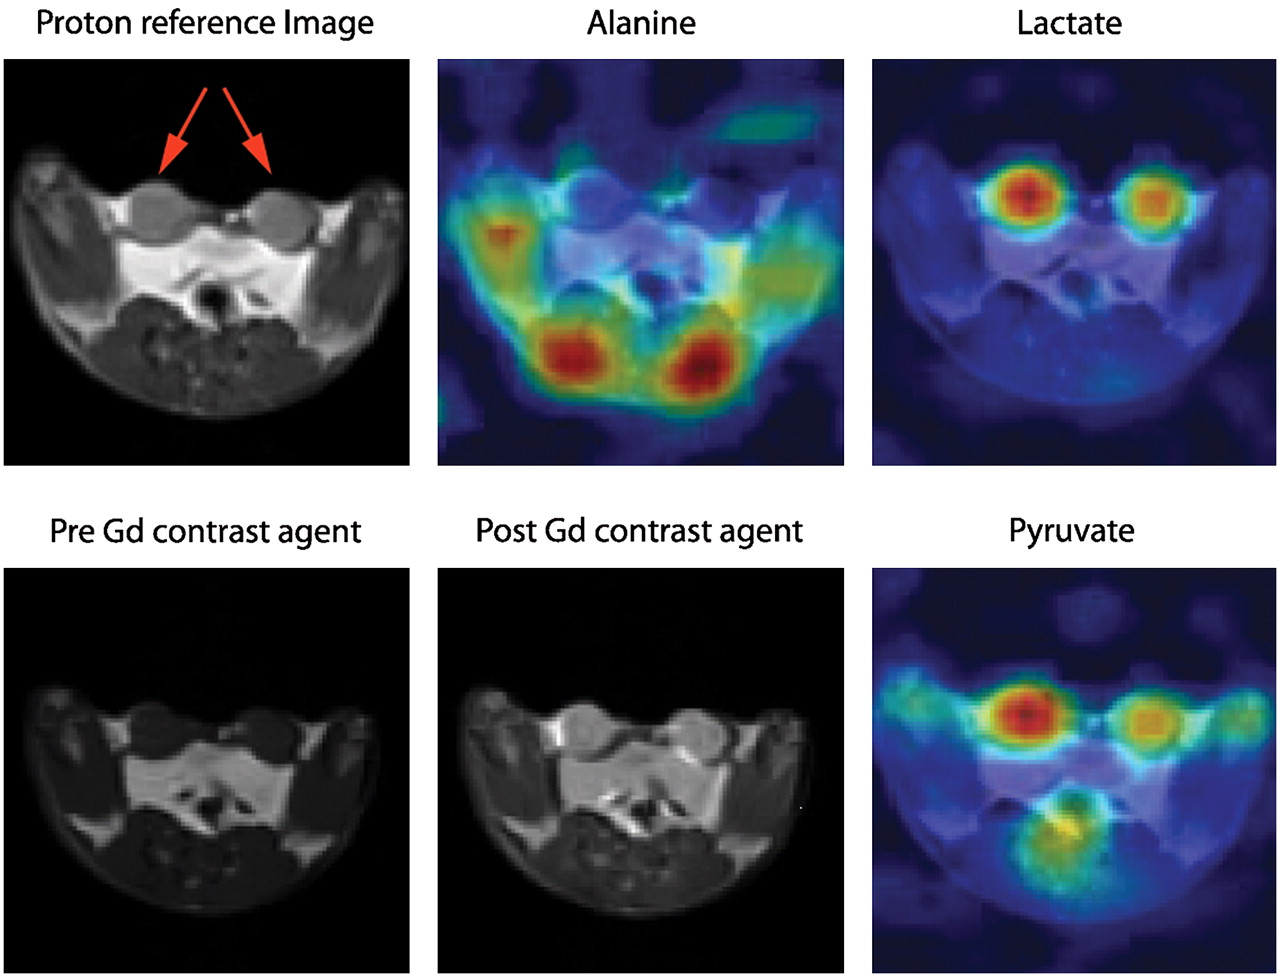
- FIGURE 14.
Example of hyperpolarized 13C imaging. Transverse proton reference image before and after introduction of gadolinium contrast agent in rat bearing 2 R3230 mammary adenocarcinomas (red arrows). NMR signal obtained simultaneously from alanine, lactate, and pyruvate is projected on anatomic 1H images. High alanine concentration is seen in skeletal muscle adjacent to spinal cord, and the 2 tumors are indicated by high lactate and pyruvate signals. In tumor, lactate is twice as intense as pyruvate signal; in muscle, ratio of lactate to pyruvate is 1:1. (Courtesy of Jan Henrik Ardenkjaer-Larsen, GE Healthcare.)
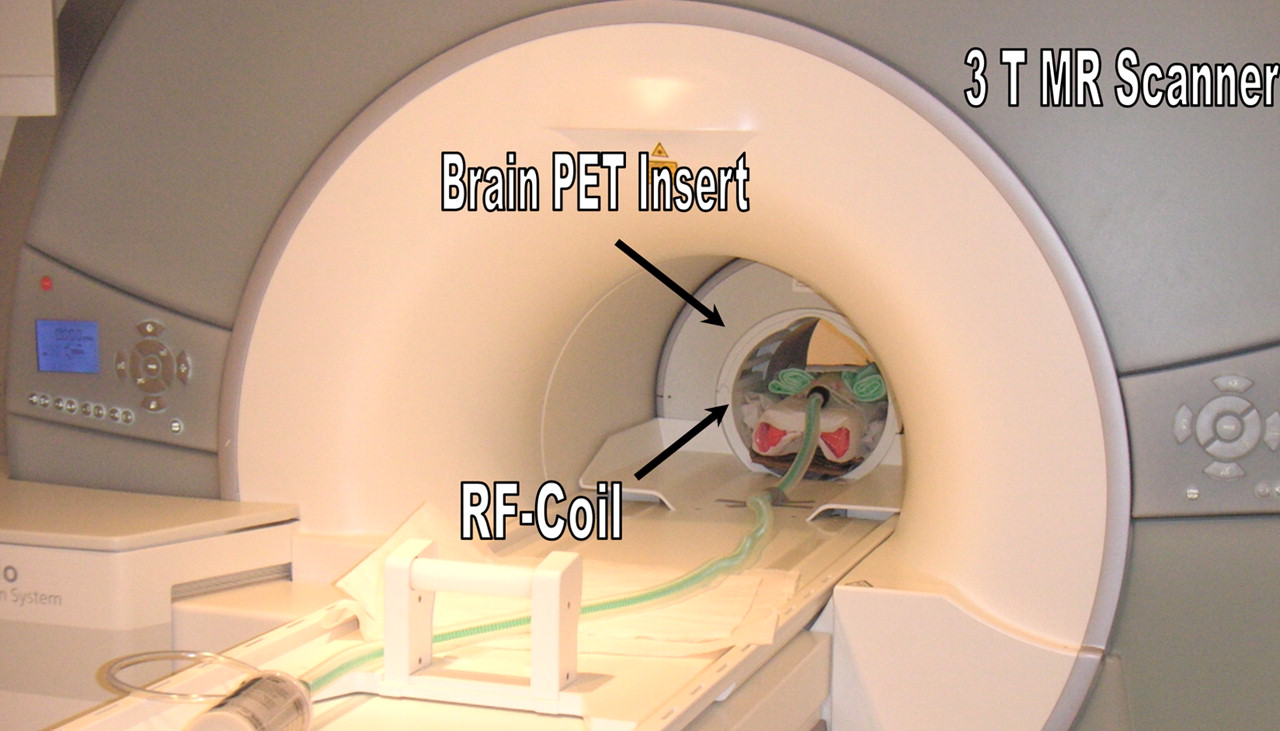
- FIGURE 15.
First installation of clinical PET/MRI system at University of Tübingen. System is dedicated for brain applications and features 3-T MRI system with dedicated head coil and PET head insert with 18-cm axial field of view. (Courtesy of University of Tübingen.)
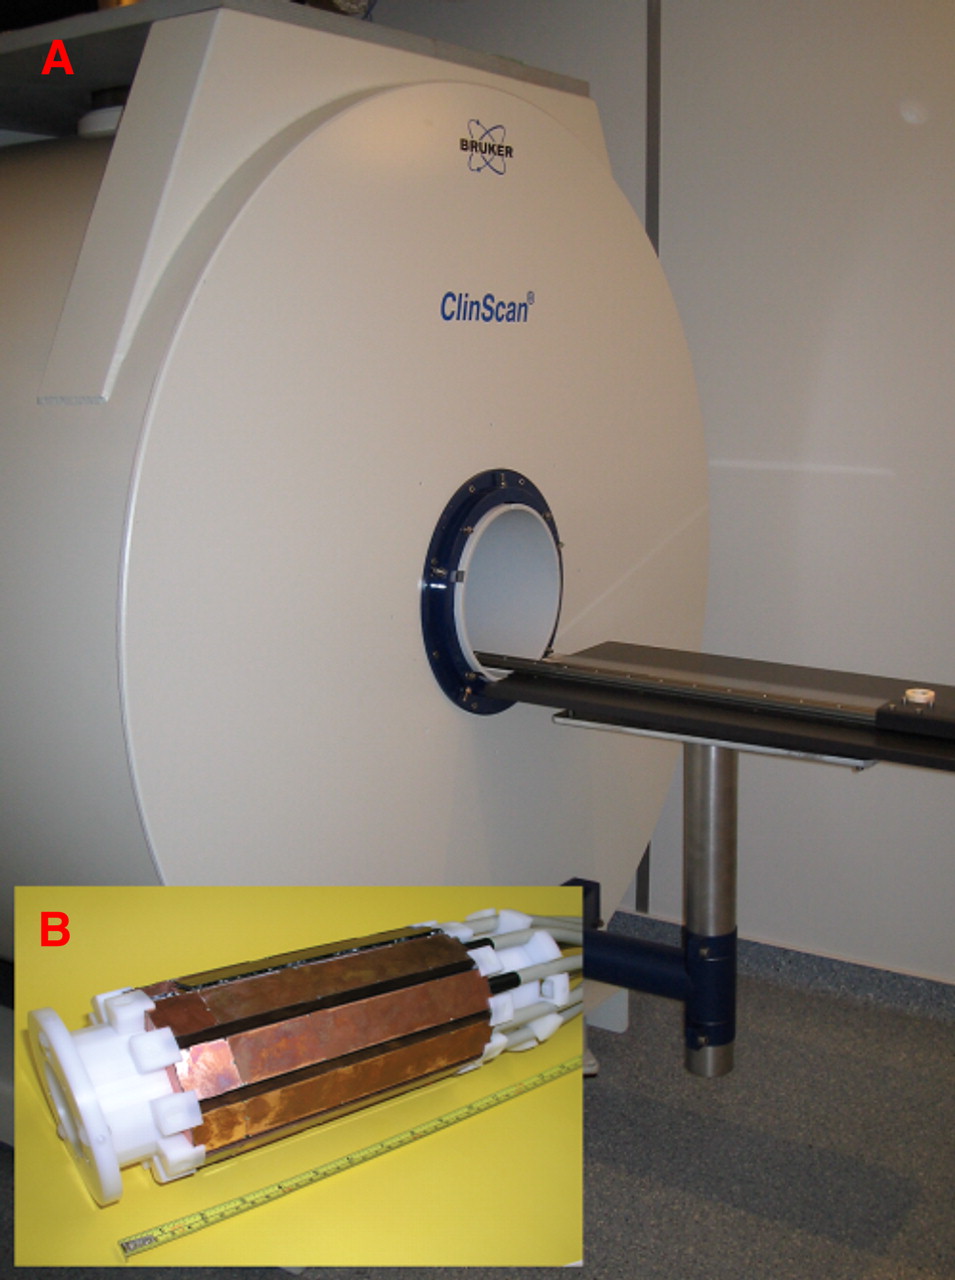
- FIGURE 16.
(A) Combined PET/MRI is performed using 7-T small-animal MRI scanner with gradient strength of 300 mT/m. (B) PET insert consisting of 10 detector modules, developed and constructed by our group, is installed inside bore of magnet. Inside PET insert is placed 35-mm quadrature coil for MRI transmission and reception. Combined PET/MRI field of view is approximately 35 mm in transaxial direction and 19 mm in axial direction. Simultaneous PET/MRI studies, which allow combination of function with anatomy or of PET functional imaging with MRI functional imaging, can be performed using this system. (Courtesy of University of Tübingen.)
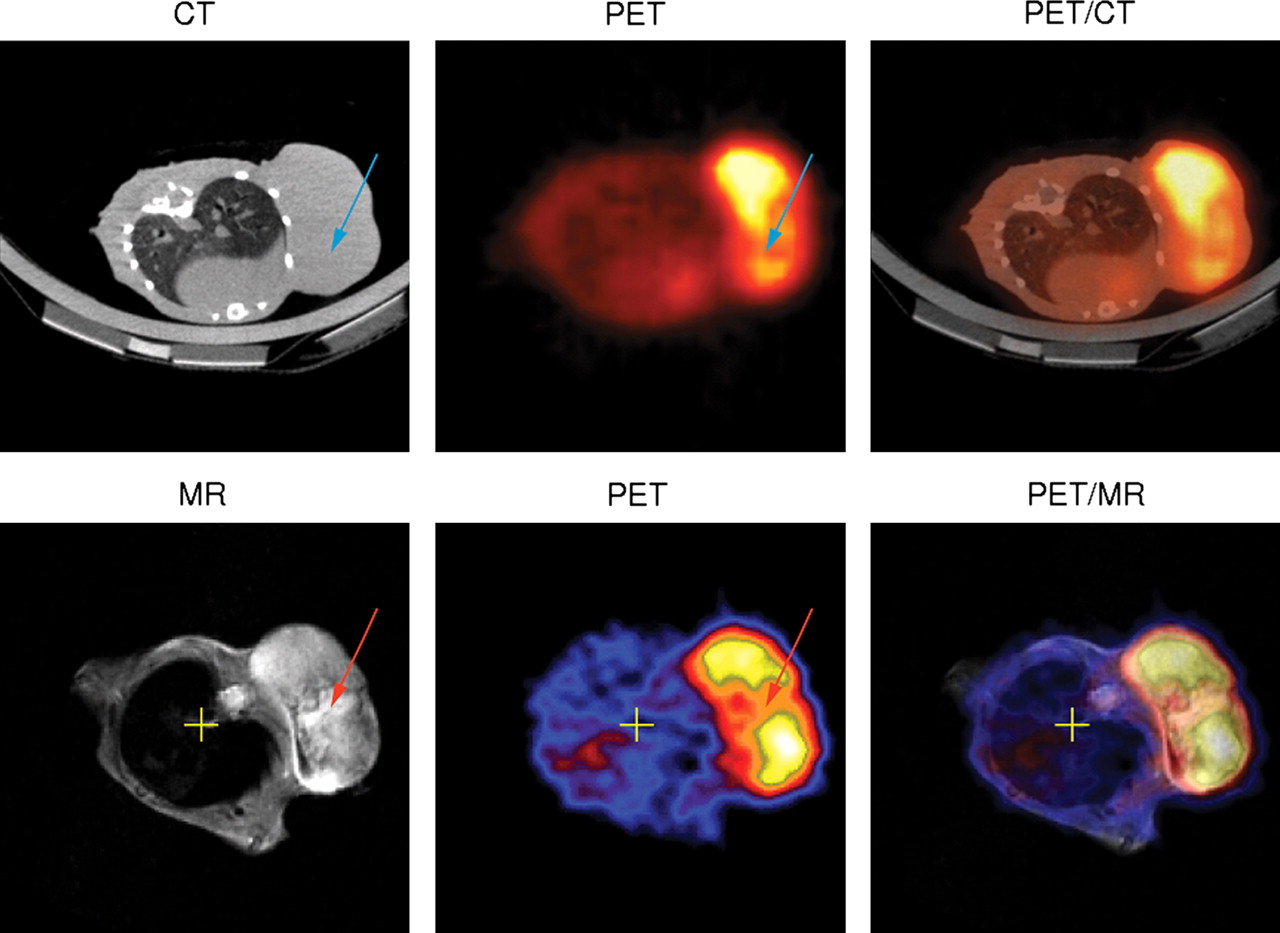
- FIGURE 17.
Images of 2 BALB/c mice bearing CT26 tumor. In combination PET/CT (first row), region of low tracer uptake in tumor (blue arrow) cannot be explained by CT images, because entire tumor appears as homogeneous tissue. In sharp contrast, T2-weighted MR images obtained by simultaneous PET/MRI reveal hyperintense area corresponding to area of low tracer uptake (red arrow). This is indication of tumor necrosis. From these images, one domain in which CT excels is also visible: inside lung, MR image depicts nearly no structures because of lack of signal-generating protons; in contrast, CT images reveal details of lung bronchia. (Courtesy of University of Tübingen.)


Tables
Property NaI(Tl) BGO LSO YSO GSY BaF LaBr3 LYSO Density (g/cm3) 3.67 7.13 7.4 4.53 6.71 4.89 5.3 5.31 Effective Z 50.6 74.2 65.5 34.2 58.6 52.2 — 54 Attenuation length 2.88 1.05 1.16 2.58 1.43 2.2 2.1 2.0 Decay constant (ns) 230 300 40 70 60 0.6 15 53 Relative light output (%) 100 15 75 118 25 5 160 76 Wavelength (λ [nm]) 410 480 420 420 440 220 360 420 Index of refraction 1.85 2.15 1.82 1.8 1.91 1.56 1.9 1.81 Hygroscopic? Yes No No No No No Yes No BGO = bismuth germanate; GSO = gadolinium oxyorthosilicate; LYSO = lutetium yttrium oxyorthosilicate; YSO = yttrium oxyorthosilicate.


