


Article Figures & Data
Figures
- FIGURE 1.
Set of lead-lined plastic sleeves (CalicheckDose Calibrator Linearity Test Kit; Fluke Biomedical) for evaluation of dose-calibrator linearity by shield method. Set is supplied with 0.64-cm-thick lead base, color-coded unlined sleeve (to provide activity measurement equivalent to 0 time point measurement of decay method), and 6 color-coded lead-lined sleeves providing attenuation factors nominally equivalent to decay over 6, 12, 20, 30, 40, and 50 h, respectively, for 99mTc.
- FIGURE 2.
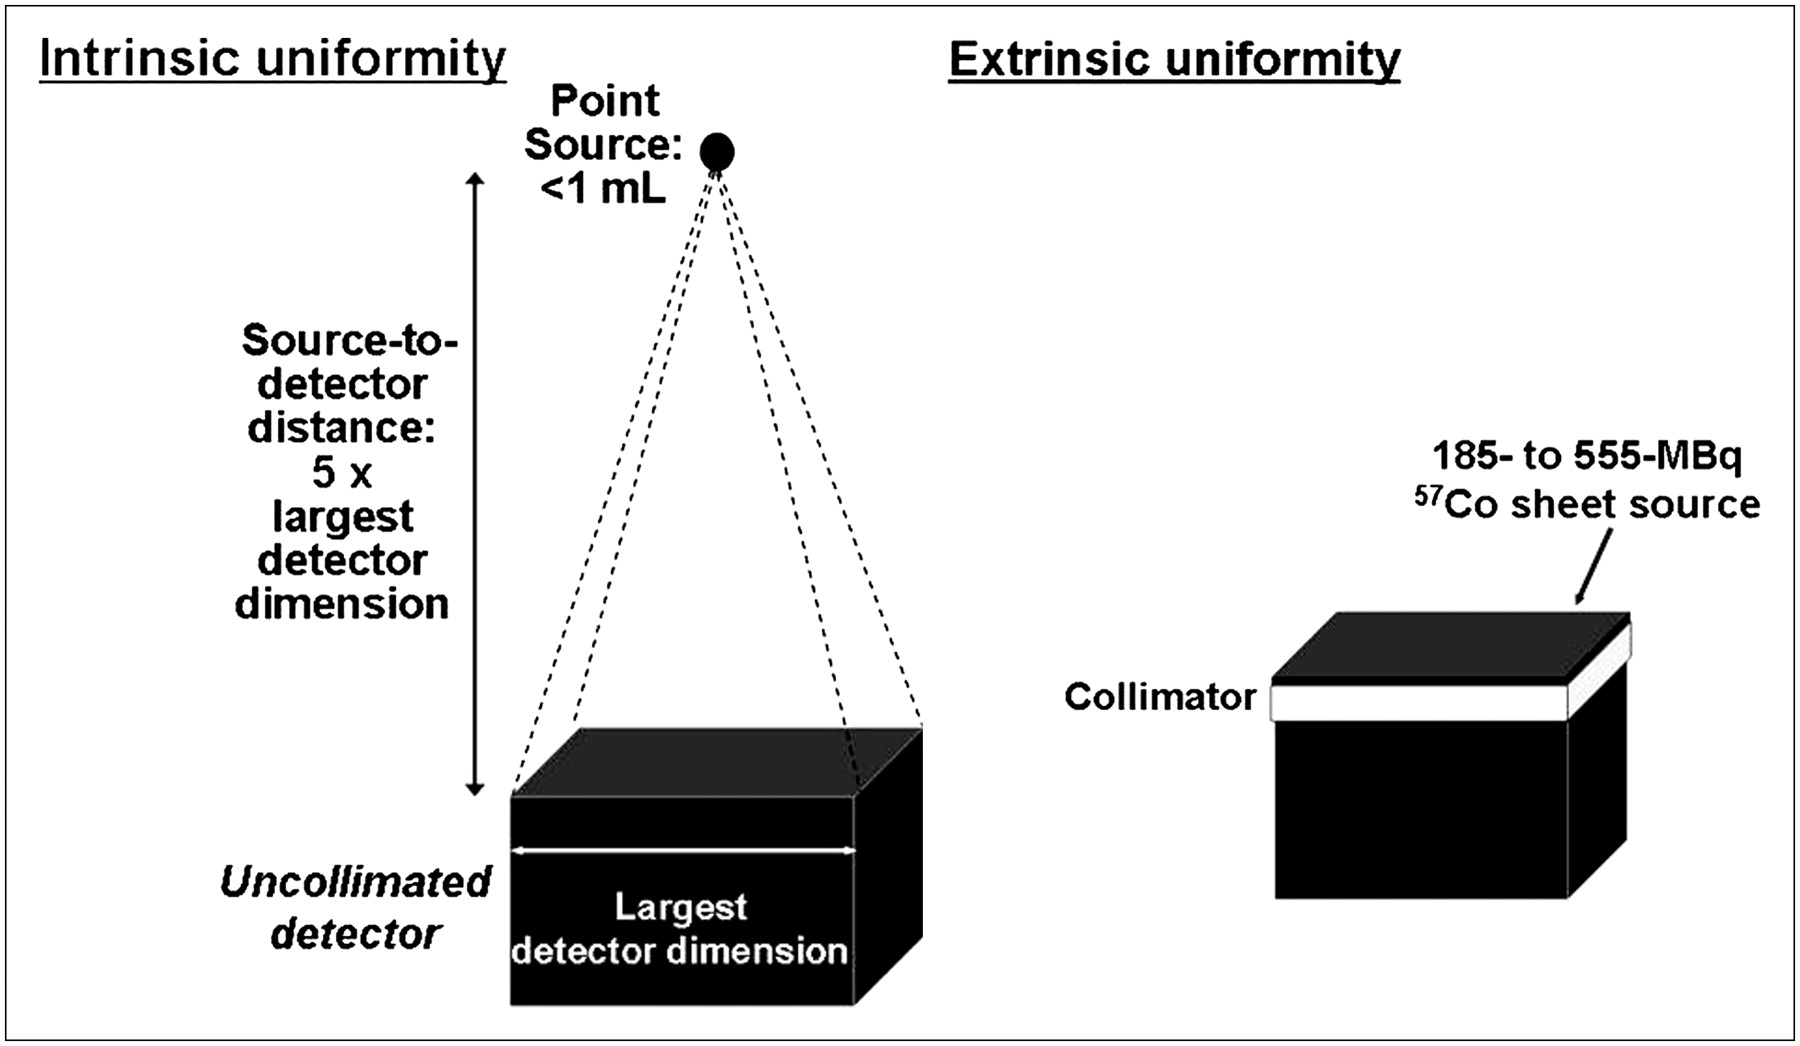
γ-Camera uniformity may be evaluated either intrinsically or extrinsically. Intrinsically, point source is placed at least 3, and preferably 5, crystal dimensions from and centered over uncollimated detector to provide uniform photon flux (left). Extrinsically, uniform flood, or sheet, source of 57Co is placed directly on collimated detector (right).
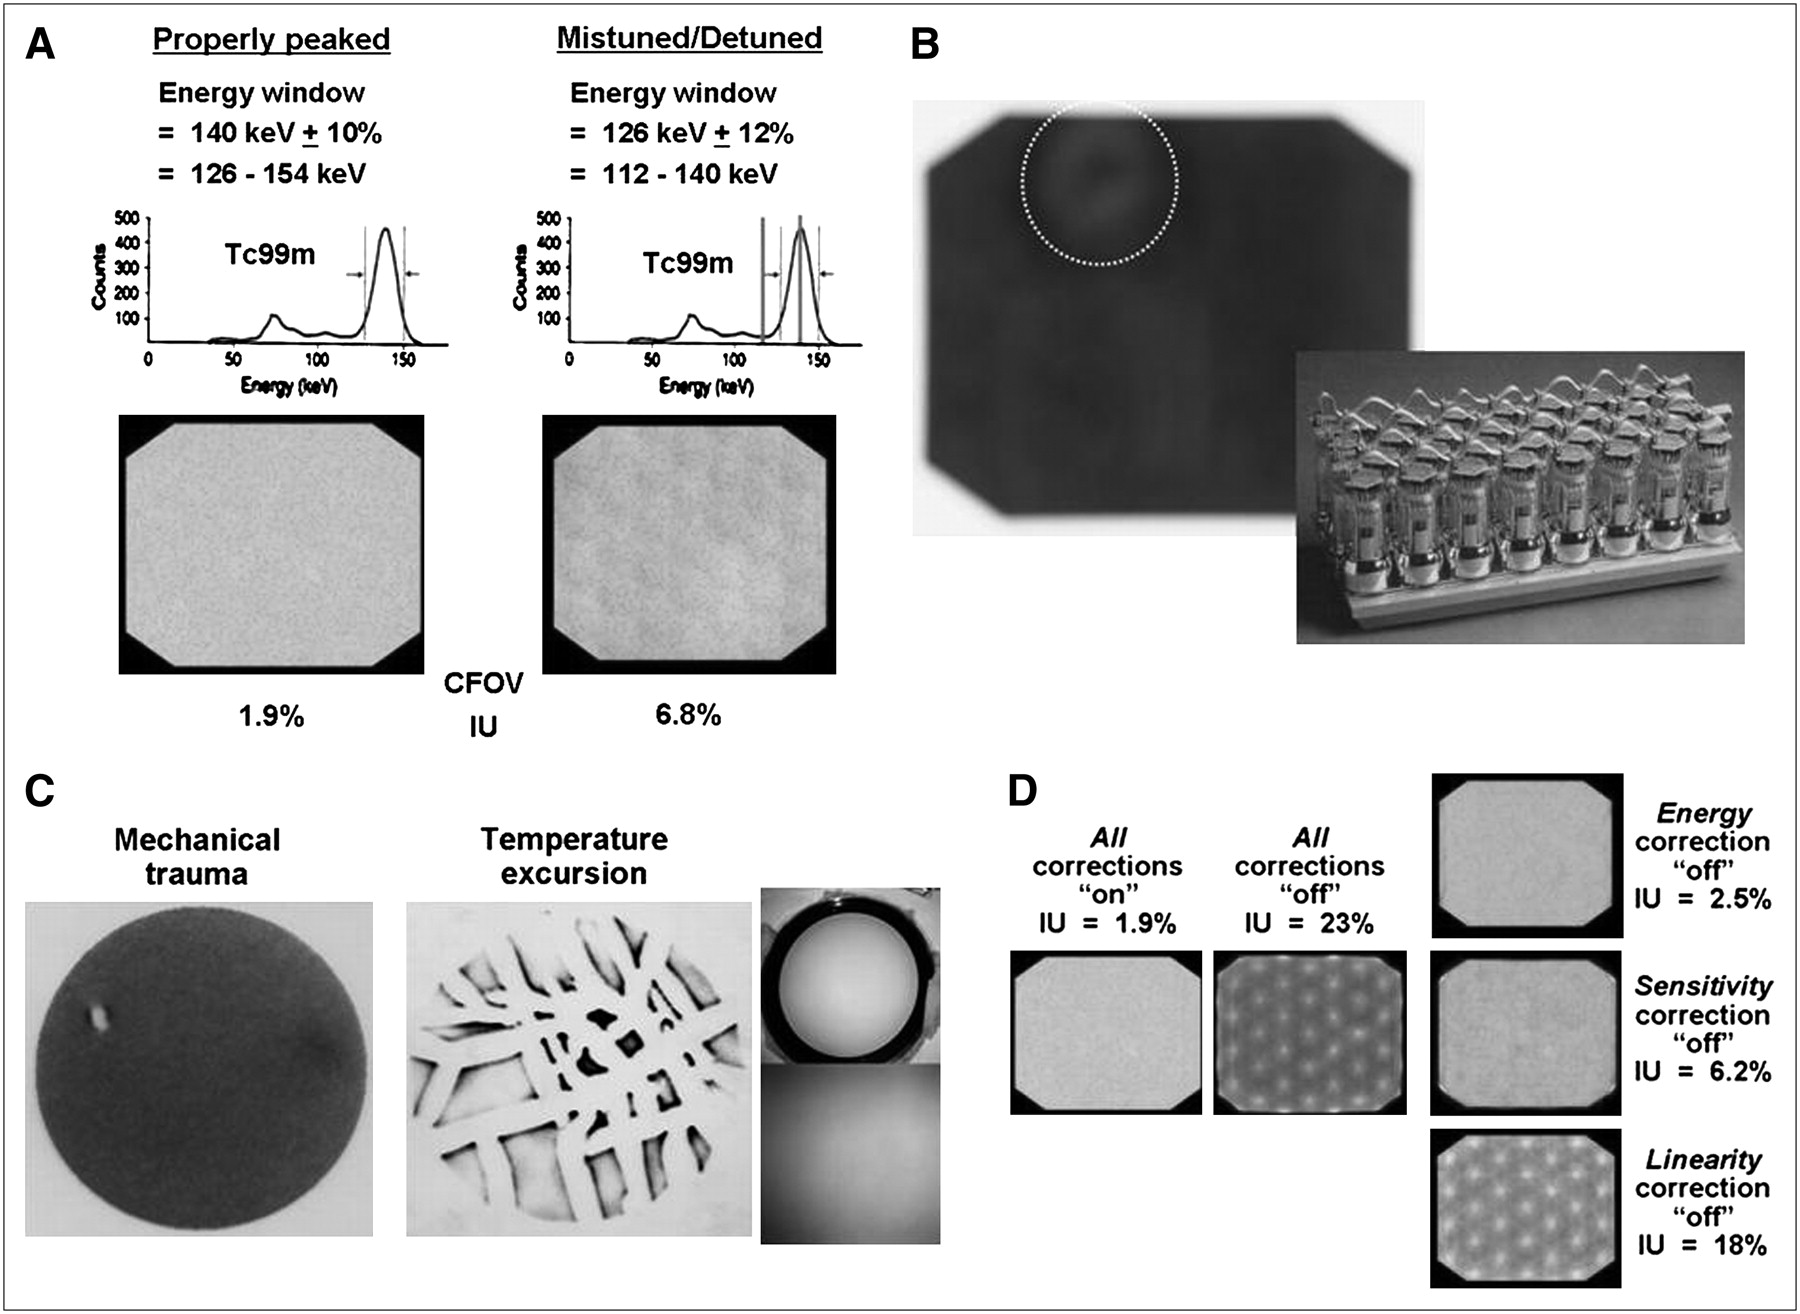
- FIGURE 3.
Sources of γ-camera nonuniformity. (A) Mistuning (or detuning), meaning that photopeak of radionuclide does not coincide with photopeak energy window of camera, perhaps because energy window (as shown) or high voltages of PMTs are not set correctly. (B) Uncoupling of PMT from crystal, resulting in loss of all or part of light signal in resulting air gap between PMT entrance window and crystal. (Courtesy of Dr. Barbara Binkert, New York Presbyterian Hospital, New York, NY.) (C) Cracked crystal, either because of mechanical trauma (impact) or temperature excursion (i.e., temperature increase or decrease at rate faster than ∼5°C per hour, causing crystal to expand or contract, respectively, to point of cracking). Note that it is rate of temperature change that is critical. Photographs on right show cracked crystal that produced corresponding image. Even though cracks are grossly imperceptible, artifacts produced are dramatic. (Courtesy of Dr. Barbara Binkert, New York Presbyterian Hospital, New York, NY.) (D) Corrupted, deleted, or switched-off software correction tables. Even perfectly functioning γ-cameras have some nonuniformity due to point-to-point variations in energy spectra, greater sensitivity at and lower sensitivity between PMTs, and residual nonuniformity due to ill-defined factors such as variations in crystal thickness. Associated nonuniformities are measured and used to create energy, linearity, and uniformity (or sensitivity) correction tables. Note that linearity correction table has biggest effect on uniformity: if corrupted, deleted, or switched off, PMT pattern becomes grossly apparent, and IU approaches 20%. Fortunately, in contrast to uniformity correction table and, to lesser extent, energy correction table, linearity correction table rarely needs to be updated once γ-camera is installed; if updating becomes necessary, it is almost always done by field-service personnel of manufacturer, not by end-user.
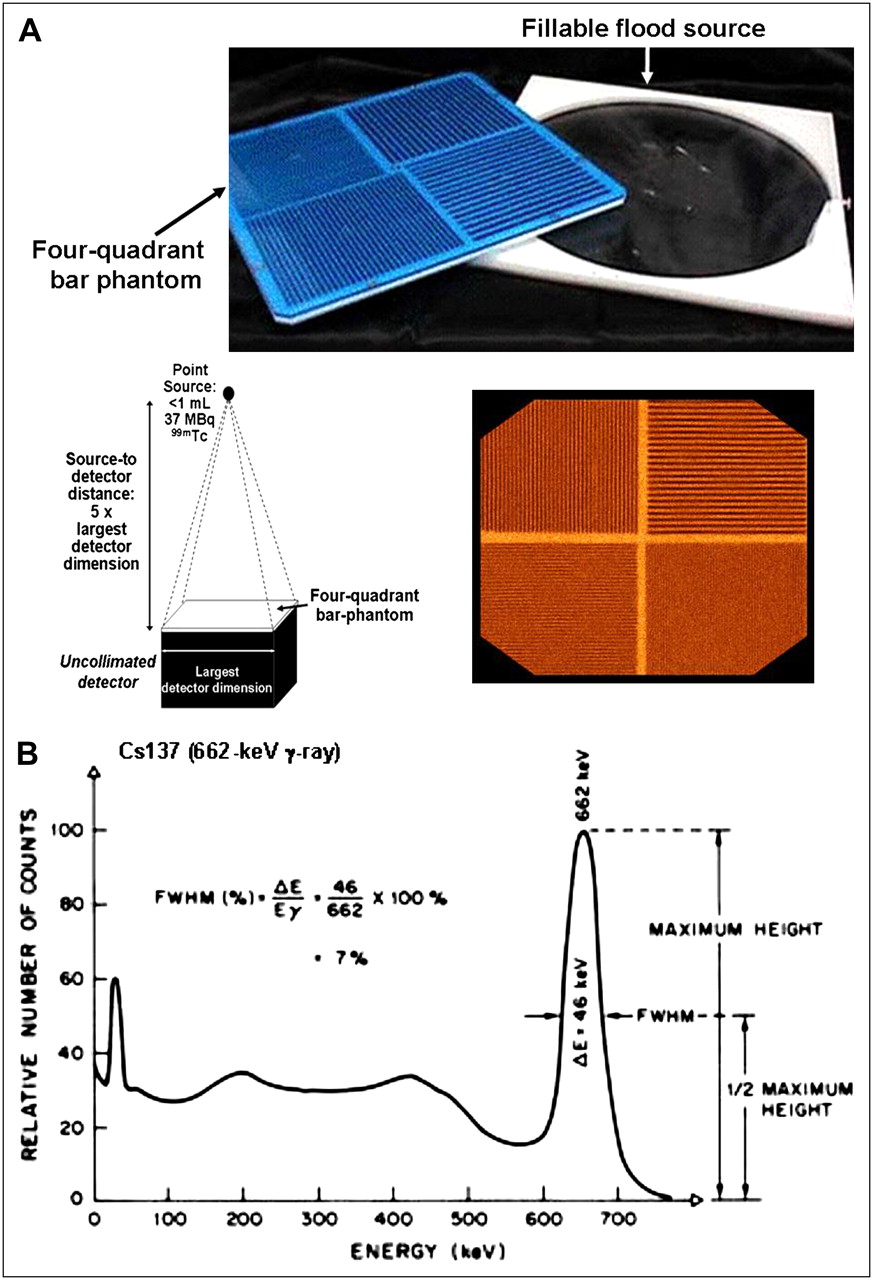
- FIGURE 4.
(A) Photograph and γ-camera image of 4-quadrant bar phantom, with schematic diagram illustrating setup for assessment of spatial resolution using such phantom. (Though seldom used in practice, sheet source that may be filled with different radionuclides and used to evaluate extrinsic uniformity is also shown in photograph.) (B) Energy spectrum for 662-keV γ-ray emitted by 137Cs, illustrating definition of energy resolution as percentage FWHM of photopeak energy, Eγ.
- FIGURE 5.
(A) COR misalignment and resulting image-blurring artifacts in rotating-γ-camera SPECT. Degree of blurring is related to magnitude of spatial misalignment of mechanical and electronic CORs. Misalignment as small as 3.2 mm (or 0.5 pixel for 64 × 64 image matrix) can produce perceptible blurring in SPECT images, with blurring substantially worse for misalignment of 6.4 mm (1 pixel). (Adapted from reference (29) with permission.) Note that for cross-sectional image of line source, COR misalignment blurs expected point into full or partial circle depending on position of source in FOV: if it is at or near center of FOV, line source appears as full circle in cross-section; if it is near periphery of FOV, it appears as partial circle. (B) COR misalignment can be measured and corrected on basis of acquiring 360° circular SPECT study of 99mTc point source and constructing graphs of x- and y-positions (perpendicular and parallel to axis of rotation, respectively) of position of maximum-count pixel in each projection image vs. angular position. x- and y-position vs. angle graphs should be sinusoidal curve and straight line, respectively. Angle-by-angle deviation between x-position on best-fit sine curve and x-position of actual maximum-count pixel thus yields correction table, indicating offset by which each projection image must be shifted at each angular position to align CORs. Alternatively, average of offsets may used at each angular position. (Adapted from reference (15) with permission.)
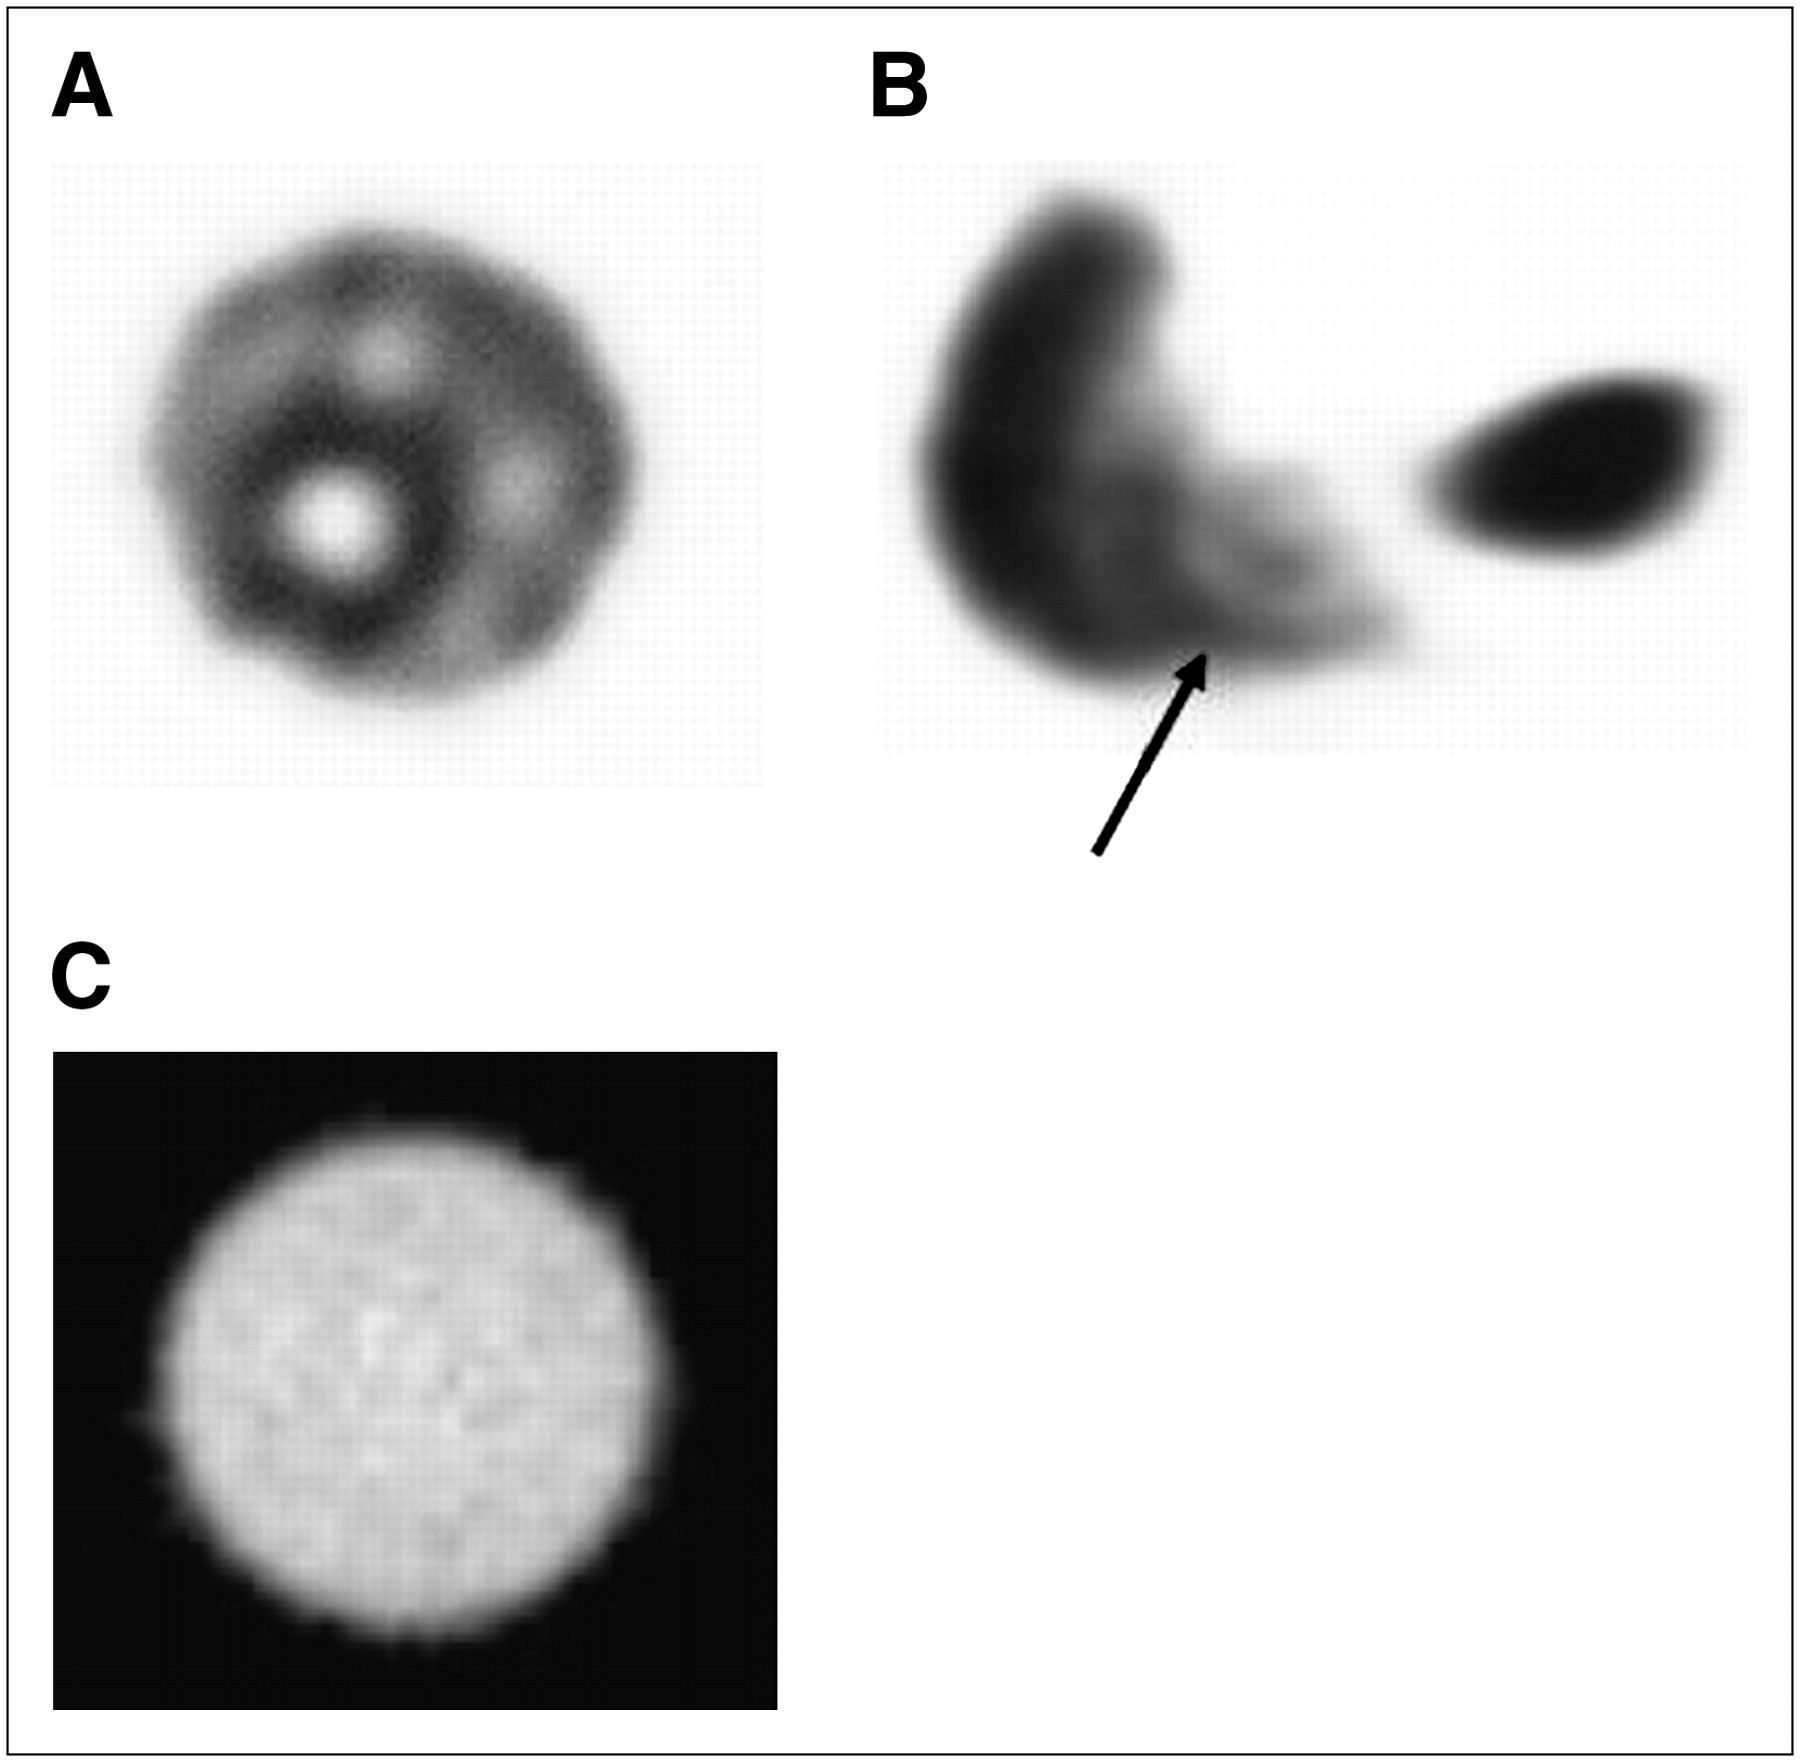
- FIGURE 6.
(A) Severe ring, or bull's-eye, artifact in transverse SPECT image through 20-cm diameter 99mTc-filled cylinder phantom resulting from gross γ-camera nonuniformity (i.e., IU ≈ 10%). (B) Appearance of such artifact (arrow) in clinical SPECT image, transverse image from 99mTc-sulfur colloid liver–spleen study. (C) In contrast to A, this is acceptable transverse SPECT image through 99mTc-filled cylinder phantom. No perceptible ring, or bull's-eye, artifact is demonstrated; IU at time of this acquisition, ∼2%, was well within tolerance. In cylinder phantom images, A and B, analytic postprocessing attenuation correction was applied.
- FIGURE 7.
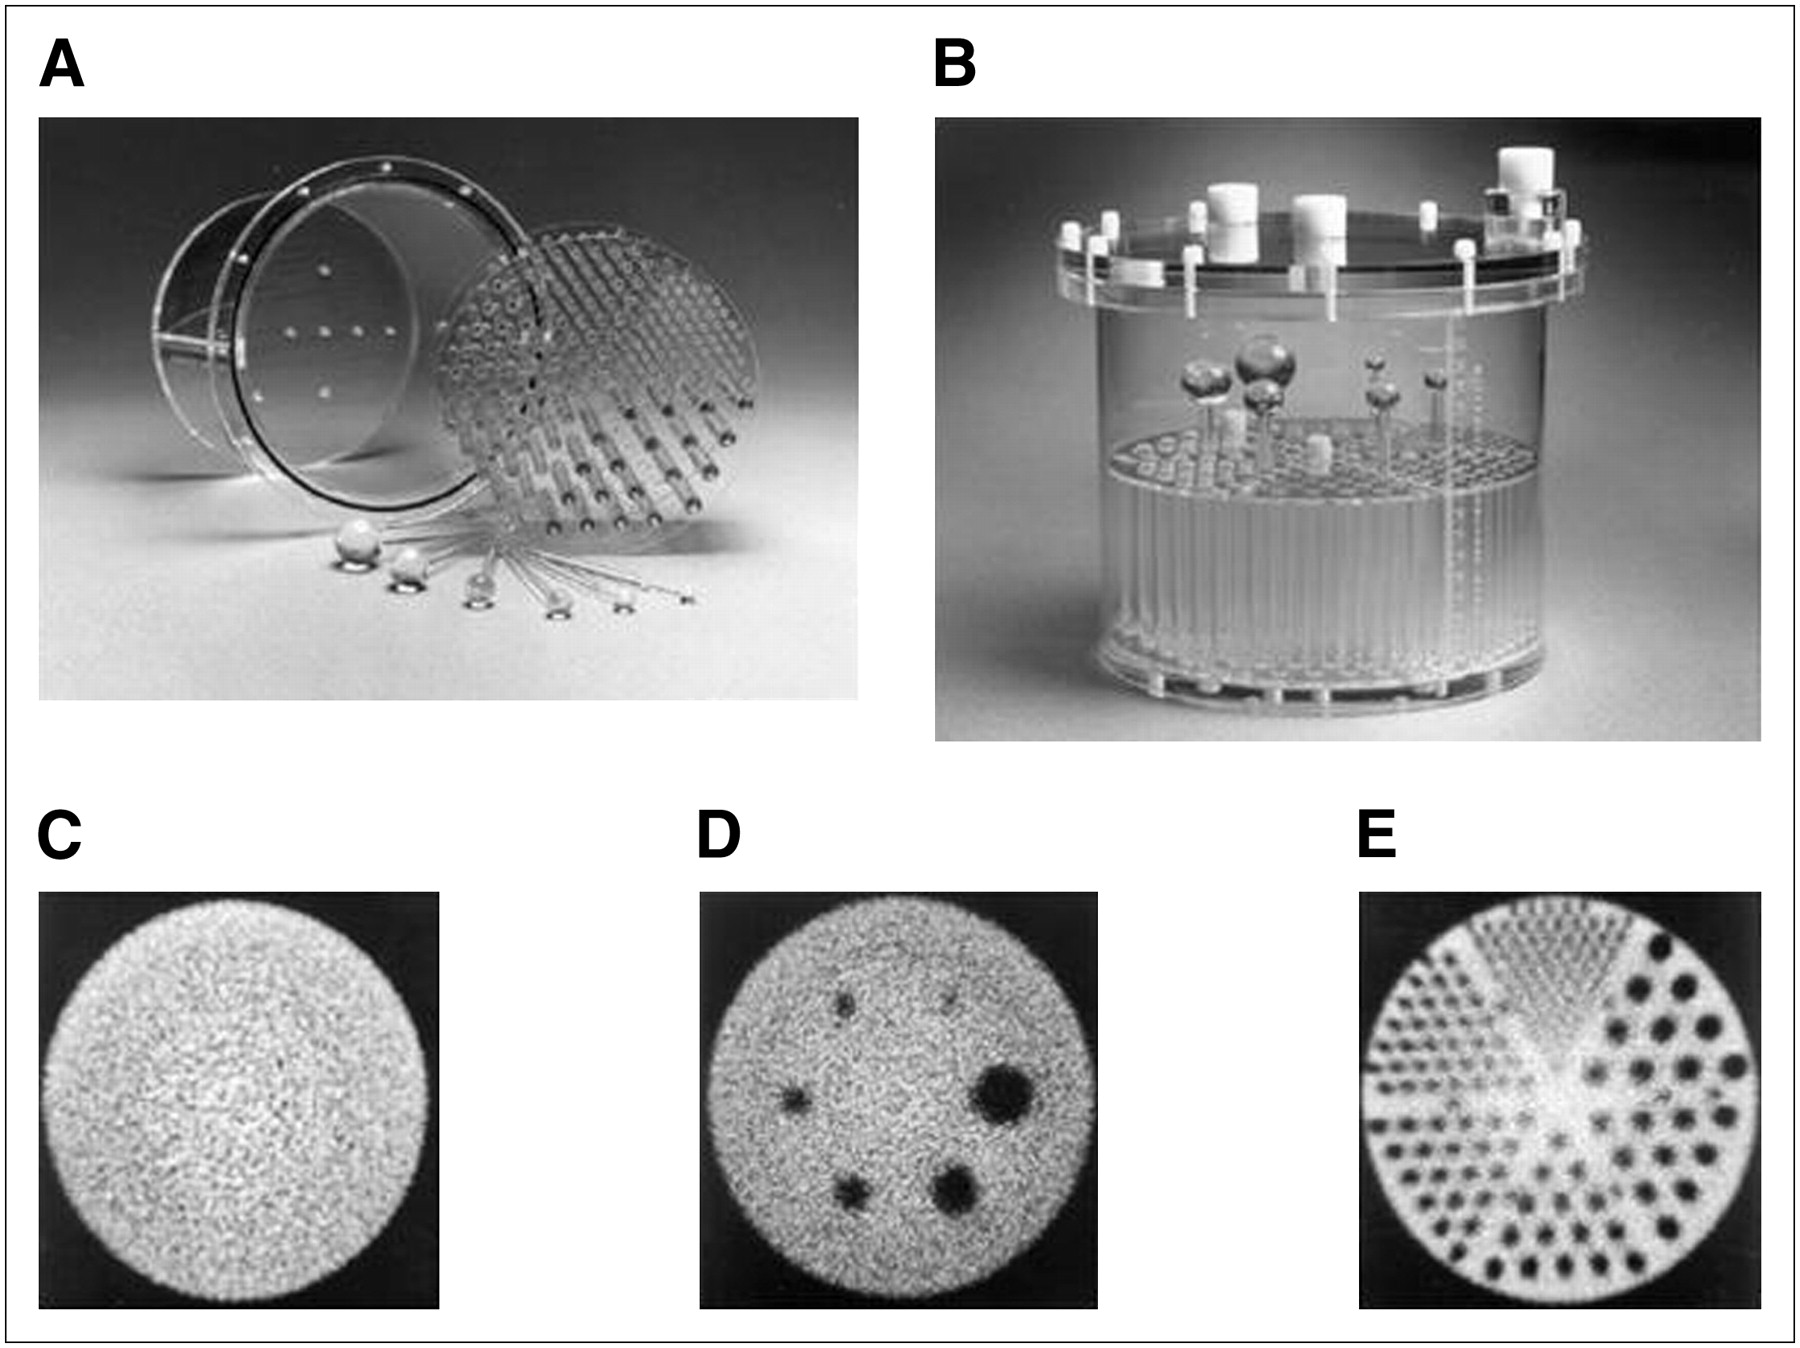
Photographs of disassembled (end view) (A) and assembled (side view) (B) phantom (Deluxe Jaszczak Phantom; Data Spectrum Corp.), used for evaluation of overall performance of tomographic imaging systems. This fillable acrylic phantom is 22 cm in diameter by 19 cm in length and includes plain section for evaluation of tomographic uniformity (C), section containing empty (cold) spheres ranging from 9.5 to 31.8 mm in diameter for evaluation of cold-sphere contrast (D), and section containing solid (cold) rods ranging from 3.2 to 11.1 mm in diameter for evaluation of reconstructed spatial resolution (E). Images in C–E have been analytically corrected for attenuation. (Courtesy of Data Spectrum Corp.)
- FIGURE 8.
(A) Sinogram (i.e., histogram) presentation of emission tomography (i.e., SPECT or PET) data. (B–D) PET sinograms of uniform-cylinder source without any visually perceptible discontinuities or other artifacts (B), with blank diagonal line indicative of faulty detector (crystal) element (C), and blank diagonal band indicative of faulty detector block (D).
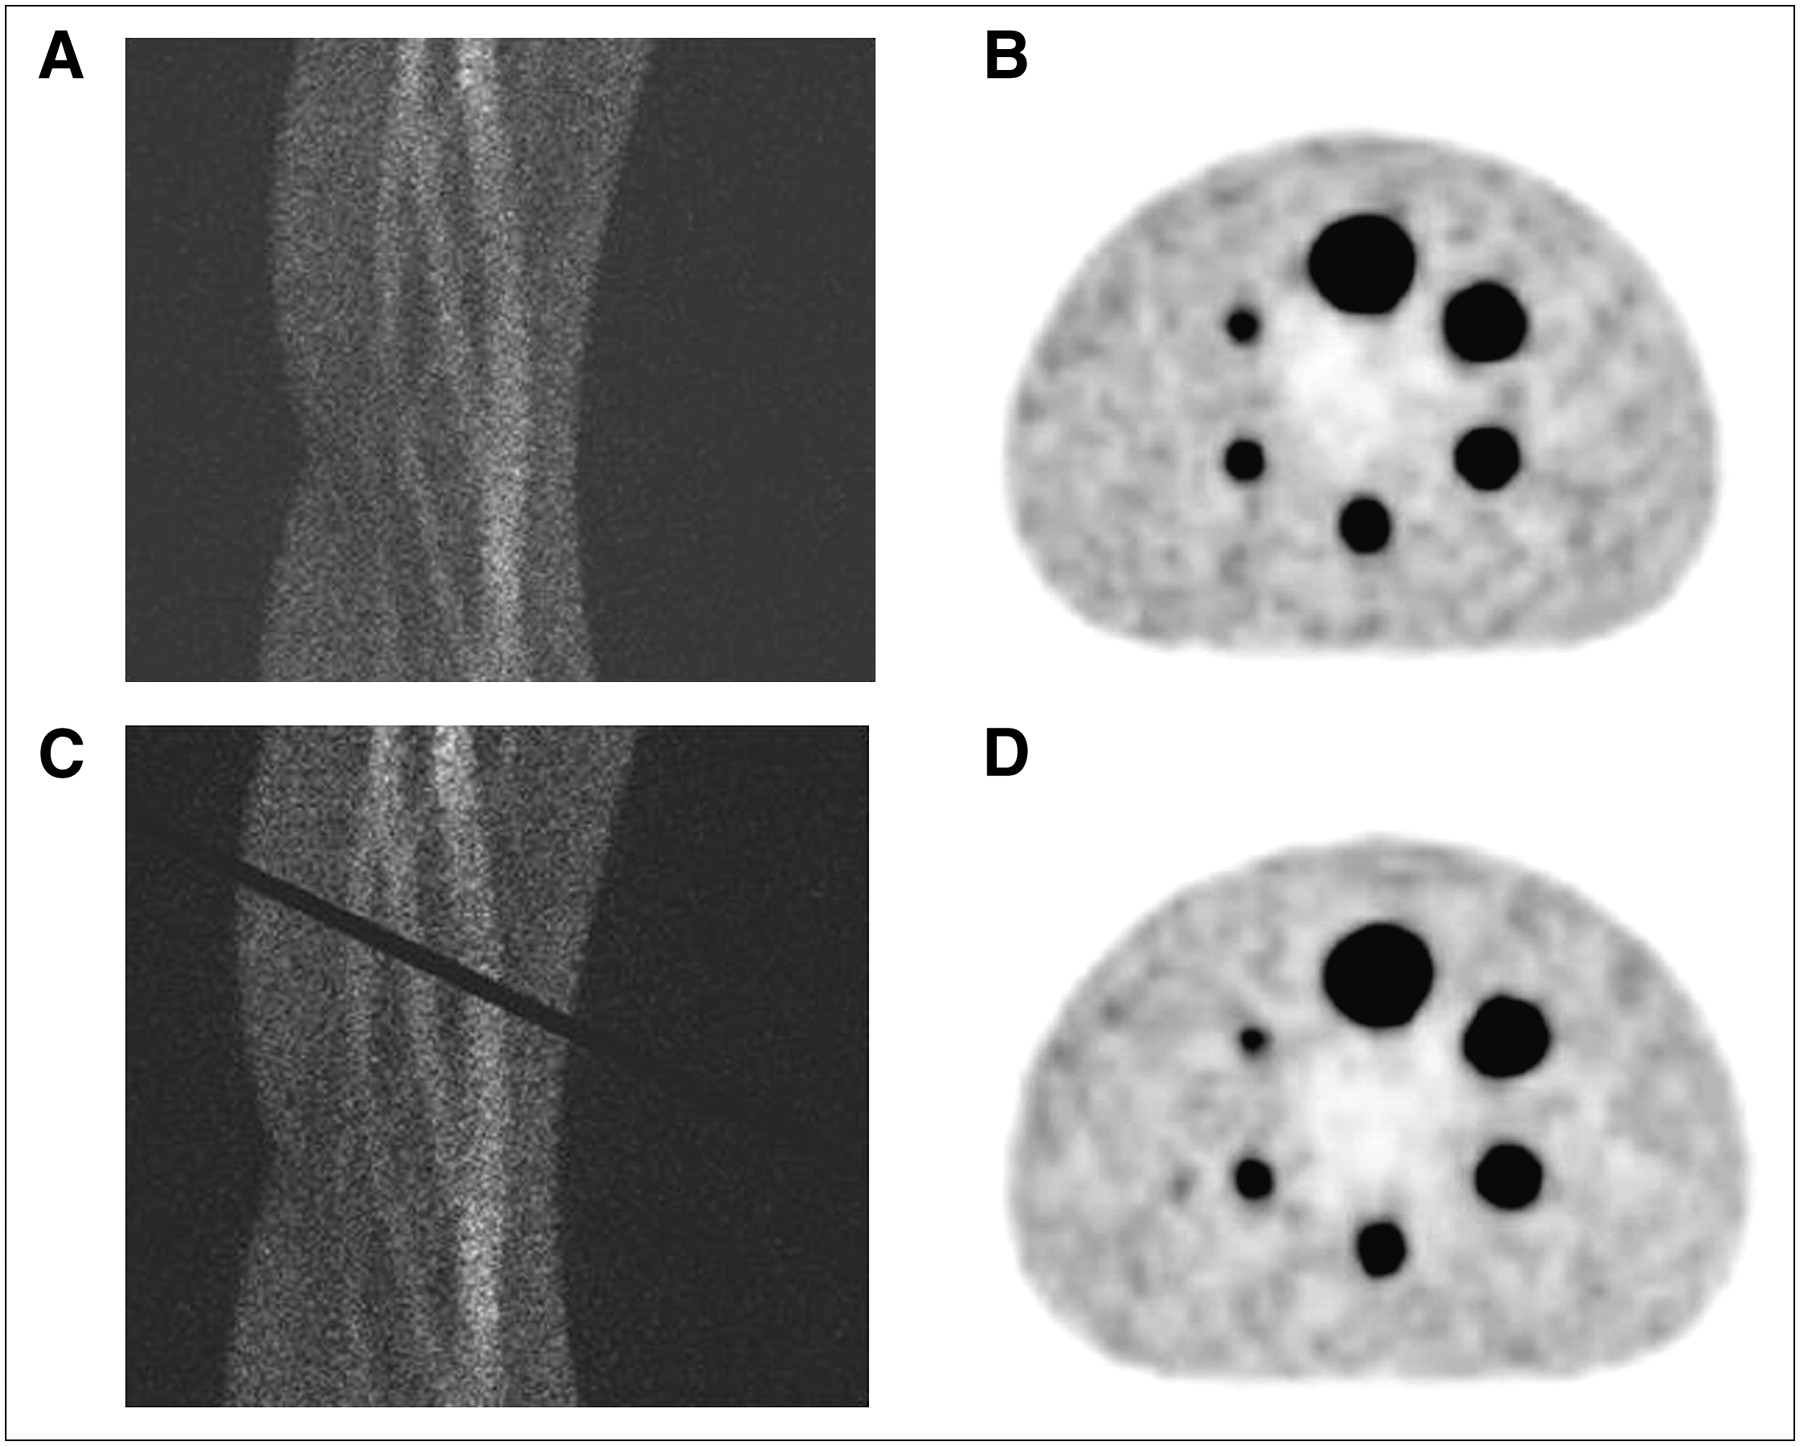
- FIGURE 9.
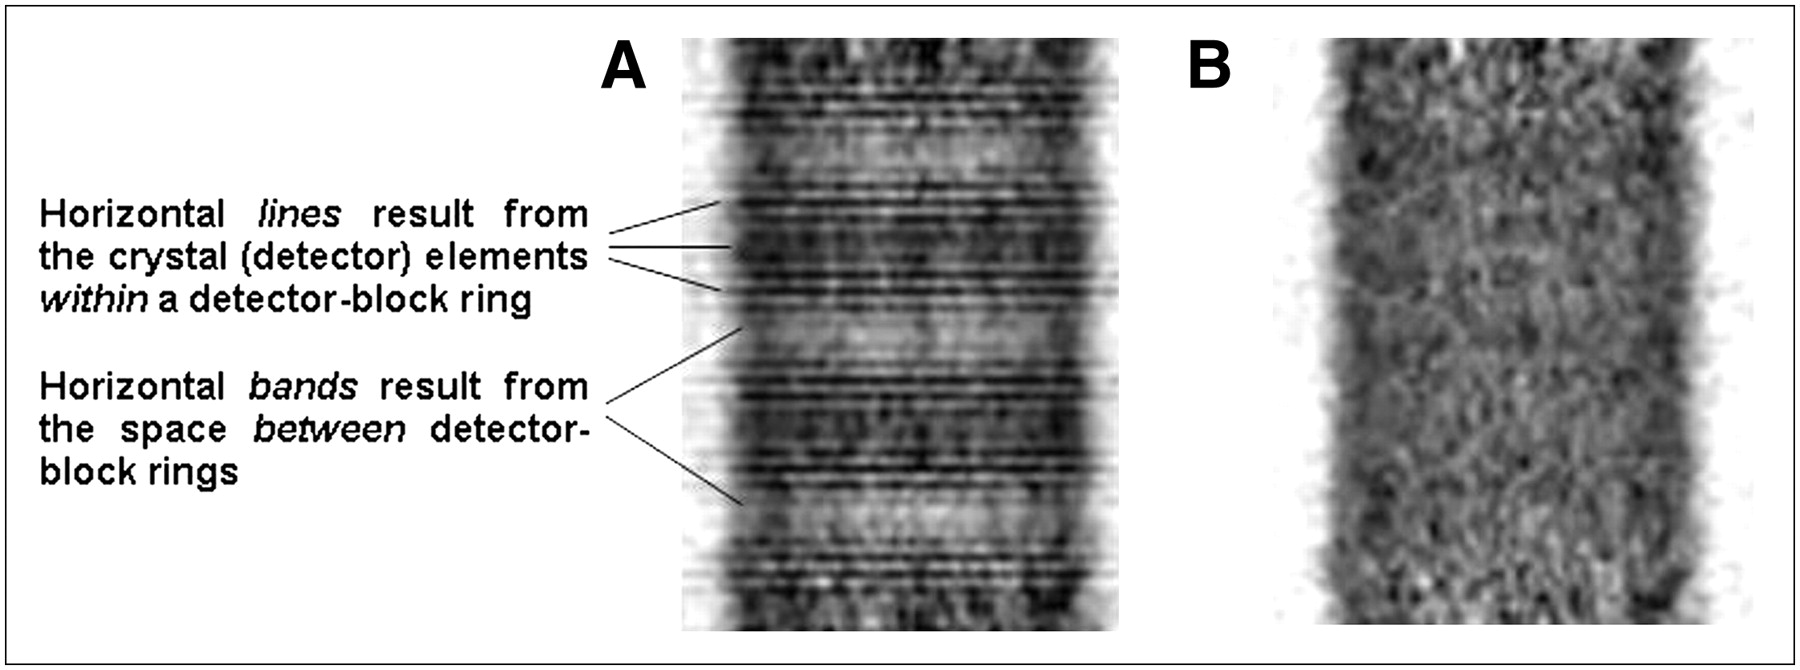
Two-dimensional PET sinograms and reconstructed transverse images through hot-sphere 18F-filled phantom: sinogram without any perceptible artifacts (A) and corresponding transverse image (B); sinogram with blank diagonal band, suggestive of faulty detector block (C) and corresponding transverse image (D). Despite obvious defect in sinogram C, reconstructed images B and D are virtually indistinguishable. (Courtesy of Dr. Osama Mawlawi, M.D. Anderson Cancer Center, Houston, TX.)
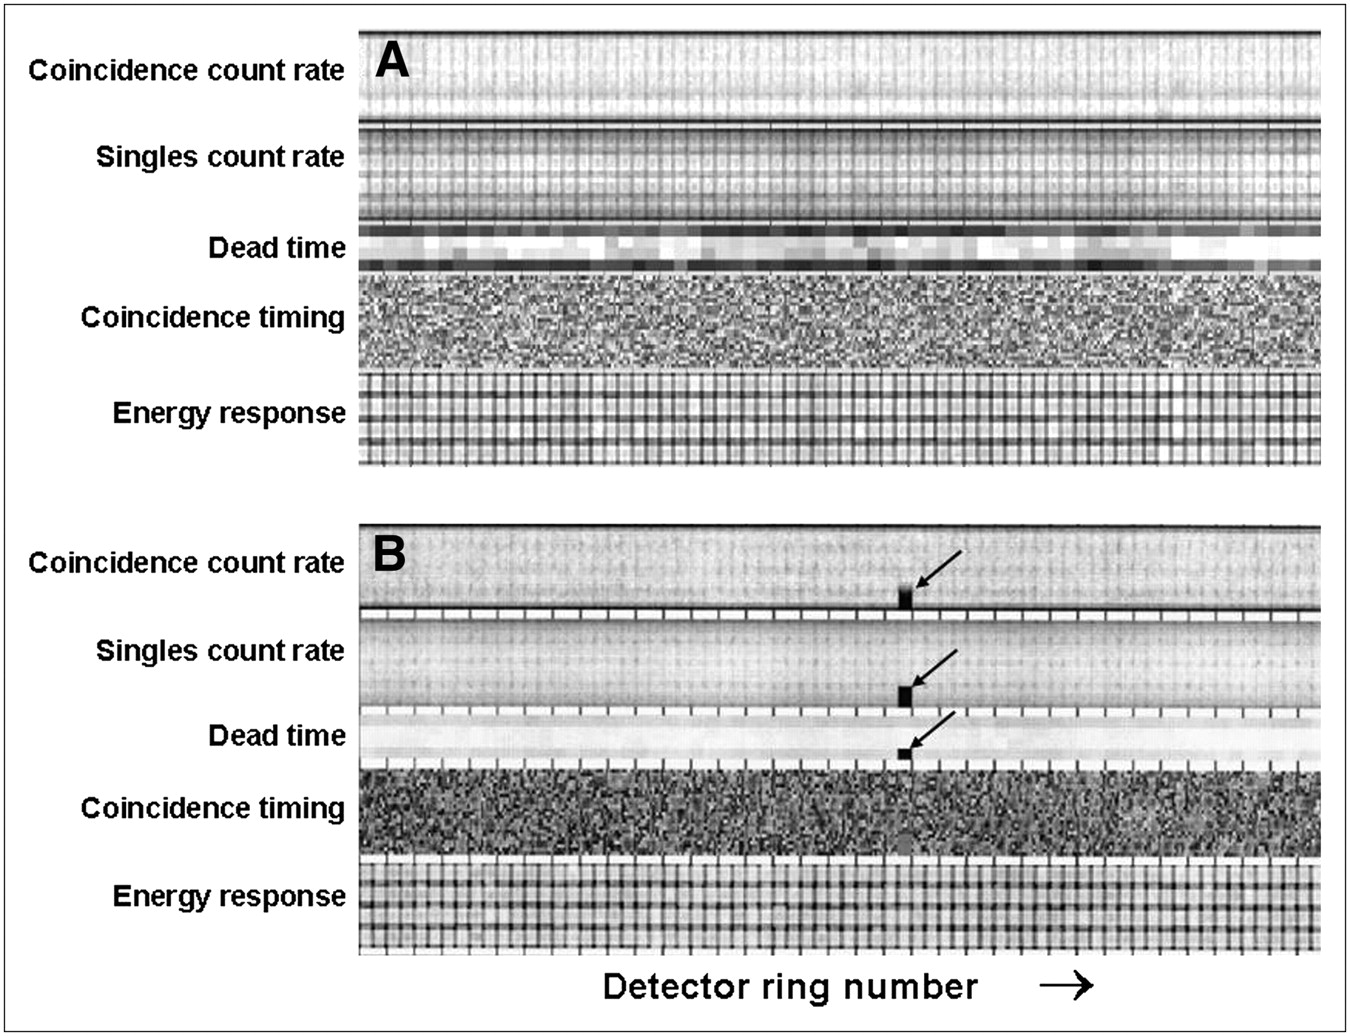
- FIGURE 10.
Proprietary graphical display (GE Healthcare), detector block–by–detector block, of relative values of PET scanner operational parameters derived from blank scan, including coincidence counting rate, singles counting rate, detector dead time, coincidence timing window, and energy setting. Such display allows operator to quickly and easily discern out-of-tolerance results, displayed with grossly different (i.e., lower) intensity than within-tolerance results. (A) Display for acceptable blank scan; that is, blank scan for which all detector parameters are within tolerance. (B) Display for blank scan in which coincidence counting rate, singles counting rate, and dead-time results for 1 block detector are out of tolerance, indicated by black areas (arrows) in respective displays. (Courtesy of Dr. Osama Mawlawi, M.D. Anderson Cancer Center, Houston, TX.)
- FIGURE 11.
Reconstructed coronal images of 68Ge uniform-cylinder phantom without (A) and with (B) normalization applied. (A) Unnormalized (i.e., uncorrected) image has obvious artifacts attributable to differences in sensitivities between direct and cross planes and presence of separate rings of block detectors. (B) Appropriate normalization virtually eliminates these and other artifacts related to nonuniformity of scanner response.
- FIGURE 12.
Cross-sectional diagrams of GE quality assurance phantom (24) illustrating respective sections (inserts) for evaluation of laser-light alignment, image slice thickness, spatial resolution, linearity, and high-contrast contrast resolution (A); low-contrast uniformity (B); and image uniformity and noise (C). Various short black lines in acrylic insert in section shown in A are cavities that fill with water when phantom is filled, providing high contrast between cavities and acrylic; portion of this section outside this insert, although not shown in black, is also water-filled. Diagonally arranged sets of line cavities ranges are 1.6 (lower left), 1.3, 1.0, 0.8, 0.6, and 0.5 (upper right) mm in line width and are used to evaluate spatial resolution. Section shown in B includes polystyrene membrane with series of holes (10, 7.5, 5, 3, and 1 mm in diameter) that also fill with water when phantom is filled, providing low contrast between holes and polystyrene. (D) Side-view diagram (not to scale) of section of phantom in A, showing only 1 of slice-thickness measurement components of insert; these line cavities are air-, not water-, filled. They are staggered (offset) 1 mm apart in longitudinal direction. Also shown in D, as well as in A, is laser-alignment groove around circumference of phantom and 2 corresponding laser-alignment cavities. Boxes indicate pertinent ROIs for different analyses. (See text for details.)
- FIGURE 13.
Setup for measurement of CT radiation exposures using ionization chamber and 32-cm-diameter acrylic torso (body) phantom. (Courtesy of Dr. Sadek Nehmeh, Memorial Sloan-Kettering Cancer Center, New York, NY.)
- FIGURE 14.
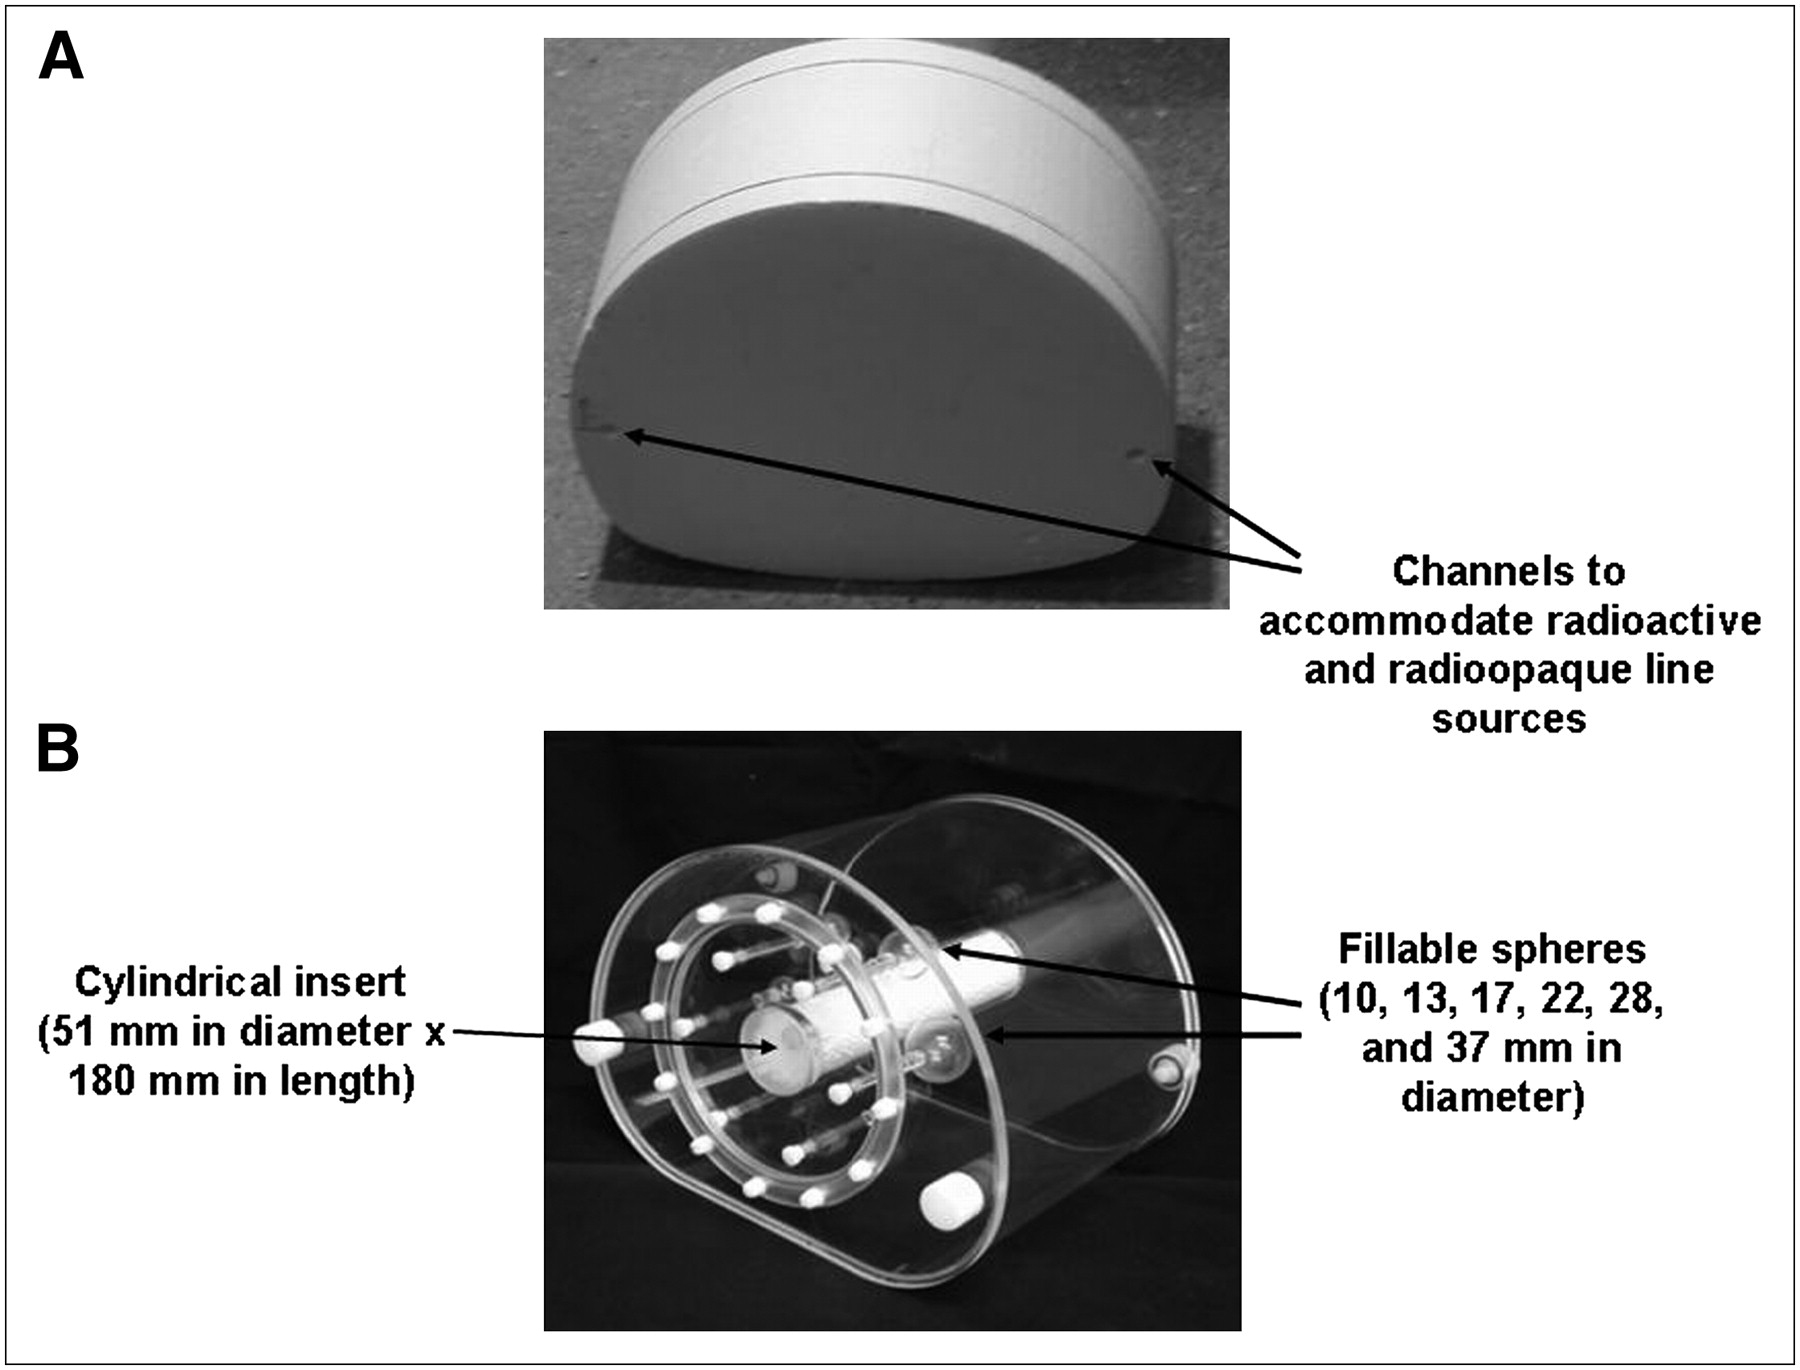
Phantoms adaptable to evaluation of accuracy of multimodality image registration. (A) Uniform phantom with 2 channels for line sources. (Courtesy of Dr. Sadek Nehmeh, Memorial Sloan-Kettering Cancer Center, New York, NY.) (B) Phantom (NEMA IEC Body Phantom; Data Spectrum Corp.) with multiple fillable spheres and cylindric insert that can be filled with polystyrene to provide minimally attenuating material, simulating lung in otherwise uniform water-filled volume.


Tables
Radionuclide Half-life Decay constant (λ) Energy, Eγ (frequency), of principal x- or γ-ray (keV) Specific γ-ray constant, Γ (mR/h/cm2/MBq) Geometry and activity QC application 57Co* 272 d 0.00254/d 122 (86%) 25.1 Test tube–sized rod, ∼37 kBq Well-counter constancy and accuracy Vial/small bottle, 185–370 MBq Dose-calibrator accuracy and constancy Sheet (up to 50 × 60 cm), 370–740 MBq γ-camera uniformity 68Ge*† 287 d 0.00241/d 511 (178%) 14.5 Test tube–sized rod, ∼37 kBq Well-counter constancy and accuracy Vial/small bottle, 185–370 MBq Dose-calibrator accuracy and constancy Cylinder (up to 5 L), up to 370 MBq PET scanner response 133Ba* 10.7 y 0.0648/y 356 (62%) 64.9 Test tube–sized rod, ∼37 kBq Well-counter constancy and accuracy Vial/small bottle, 185–370 MBq Dose-calibrator accuracy and constancy 137Cs 30 y 0.0231/y 662 (86%) 89.7 Test tube–sized rod, ∼37 kBq Well-counter constancy and accuracy Vial/small bottle, 185–370 MBq Dose-calibrator accuracy and constancy ↵* 57Co, 68Ge, and 133Ba are sometimes known as “mock” 99mTc (Eγ = 140 keV), 18F (Eγ = 511 keV), and 131I (Eγ = 364 keV), respectively.
↵† 68Ge in sealed source is in secular equilibrium with its short-lived, positron-emitting daughter, 68Ga (half-life, 68 min).
Information in Table 1 is based on data from Johns and Cunningham (30).
- TABLE 2
Summary of Recommendations for Routine QC of Clinical Nuclear Medicine Instrumentation
Instrument At installation or after repair Annual Quarterly or monthly Weekly Daily Survey meter Accuracy Accuracy —* —* Battery check Background Constancy Dose calibrator Geometry (volume)- dependent response N/A Linearity —* Constancy Accuracy Well counter Efficiency (sensitivity) Efficiency (sensitivity) —* —* Energy peaking Background Constancy Intraoperative probe —* —* —* —* Battery check Bias check Energy peaking (if applicable) Background Constancy Organ uptake probe —* —* —* —* Energy peaking Background Constancy Efficiency (sensitivity) γ-camera References 3, 5, and 8 —* Uniformity (for radionuclides used clinically other than 99mTc or 57Co) Spatial resolution Energy peaking Uniformity (for 99mTc or 57Co) SPECT scanner or SPECT subsystem of SPECT/CT scanner Reference 6 —* Tomographic uniformity COR alignment Energy peaking Overall system performance Uniformity (for 99mTc or 57Co) PET scanner or PET subsystem of PET/CT scanner Reference 4 Normalization —* Tomographic uniformity Blank scan Normalization Well-counter calibration Well-counter calibration CT subsystem of PET/CT or SPECT/CT scanner References 1, 2, and 22 Dosimetry Laser alignment —* Warm-up Image slice thickness Tomographic uniformity Spatial resolutionLinearity Accuracy of CT number of water High-contrast resolution Low-contrast resolution Noise PET/CT or SPECT/CT image registration —* —* Accuracy —* —* CT-based attenuation corrections ↵* Other than QC or performance assessment procedures that may be recommended by manufacturer, no such procedure specifically recommended for this time interval exists.


Jump to section
Related Articles
Cited By...
- SNMMI Clinical Trials Network Research Series for Technologists: An Introduction to Conducting Theranostic Clinical Trials
- Brain Imaging Techniques: Improving the Quality
- Light-Induced Radiosynthesis of 89Zr-DFO-Azepin-Onartuzumab for Imaging the Hepatocyte Growth Factor Receptor
- Human Biodistribution and Radiation Dosimetry of 18F-Clofarabine, a PET Probe Targeting the Deoxyribonucleoside Salvage Pathway
- Improved Nuclear Medicine Uniformity Assessment with Noise Texture Analysis
- Accuracy of Clinical Protocols in SPECT
- An Investigation of a Sinogram Discontinuity Artifact on Myocardial Perfusion Imaging
- Extrinsic Versus Intrinsic Uniformity Correction for {gamma}-Cameras
- Review of the Linogram and Sinogram: An Easy Way to Detect Off-Peak Artifacts in Myocardial Perfusion SPECT