


Abstract
Because γ cameras are generally susceptible to environmental conditions and system vulnerabilities, they require routine evaluation of uniformity performance. The metrics for such evaluations are commonly pixel value–based. Although these metrics are typically successful at identifying regional nonuniformities, they often do not adequately reflect subtle periodic structures; therefore, additional visual inspections are required. The goal of this project was to develop, test, and validate a new uniformity analysis metric capable of accurately identifying structures and patterns present in nuclear medicine flood-field uniformity images. Methods: A new uniformity assessment metric, termed the structured noise index (SNI), was based on the 2-dimensional noise power spectrum (NPS). The contribution of quantum noise was subtracted from the NPS of a flood-field uniformity image, resulting in an NPS representing image artifacts. A visual response filter function was then applied to both the original NPS and the artifact NPS. A single quantitative score was calculated on the basis of the magnitude of the artifact. To verify the validity of the SNI, an observer study was performed with 5 expert nuclear medicine physicists. The correlation between the SNI and the visual score was assessed with Spearman rank correlation analysis. The SNI was also compared with pixel value–based assessment metrics modeled on the National Electrical Manufacturers Association standard for integral uniformity in both the useful field of view (UFOV) and the central field of view (CFOV). Results: The SNI outperformed the pixel value–based metrics in terms of its correlation with the visual score (ρ values for the SNI, integral UFOV, and integral CFOV were 0.86, 0.59, and 0.58, respectively). The SNI had 100% sensitivity for identifying both structured and nonstructured nonuniformities; for the integral UFOV and CFOV metrics, the sensitivities were only 62% and 54%, respectively. The overall positive predictive value of the SNI was 87%; for the integral UFOV and CFOV metrics, the positive predictive values were only 67% and 50%, respectively. Conclusion: The SNI accurately identified both structured and nonstructured flood-field nonuniformities and correlated closely with expert visual assessment. Compared with traditional pixel value–based analysis, the SNI showed superior performance in terms of its correlation with visual perception. The SNI method is effective for detecting and quantifying visually apparent nonuniformities and may reduce the need for more subjective visual analyses.
Given the transience of performance, flood-field uniformity testing is an essential part of the assessment of nuclear medicine γ cameras (1). Such testing is typically the first type of testing performed at acceptance and is considered the central element of quality control programs—acquired and assessed on a daily basis to determine the clinical readiness of a system. Uniformity testing aids in identifying several common performance issues, including spatial nonlinearities in camera response (2), drifting gains in photomultiplier tubes, corrupt correction files, and incorrectly positioned photopeaks (3). Although flood-field uniformity plays a vital role in determining the quality or clinical readiness of a system, how to effectively quantify this characteristic remains a major challenge.
Although several methods for quantifying flood-field uniformity have been developed (4–10), the most accepted and widely used method of uniformity analysis is based on the principles of the National Electrical Manufacturers Association standard (8,11). This is a pixel value–based method in which the quality of a uniformity image is determined on the basis of the range of pixel densities across the field of view after compression to a 64 × 64 matrix and application of a smoothing filter function. This method was initially devised as a standardized method with which manufacturers could state their system specifications. Because of its ease of calculation and reproducibility across multiple manufacturer platforms, this basic method has become widely used in daily quality control uniformity analysis (12).
Despite their widespread use, pixel value–based methods are somewhat limited because they use only the range or distribution of pixel values across an image; they are not well suited for describing periodic nonuniformities. Although these methods frequently accomplish the goal of flagging gross nonuniformities, they often fail to capture subtle structures and patterns that are caused by changes in γ-camera performance and that may be visually obvious and clinically unacceptable. This problem is especially important in tomographic imaging, in which subtle nonuniformities have the potential for greater impact (13). Because of their limitations, pixel value–based analyses must be accompanied by a visual inspection for confident evaluation of an image (14). This visual inspection introduces a subjective component to image analysis; it lacks reproducibility and relies on the expertise of the observer.
A promising alternative for quantifying flood-field uniformity involves the use of the noise power spectrum (NPS). The NPS was previously used to describe the spatial correlations of the noise in radiography, mammography, and CT (15–17). Other authors have reported the use of the NPS to characterize the components of noise in nuclear medicine imaging (18,19). Here we describe an expansion of the use of the NPS to evaluate the quality of flood-field uniformity images with regard to the presence of nonuniformities. Our goals were to develop a uniformity analysis metric derived from a 2-dimensional (2D) NPS capable of accurately identifying structures and patterns present in nuclear medicine flood-field uniformity images, with the added validation of being closely correlated with visual perception, and to compare this new metric with traditional analytic methods in clinical use.
MATERIALS AND METHODS
Structured Noise Index (SNI)
The NPS is a spectral decomposition of the variance of an image. As such, it describes the various frequency components that comprise the noise in the image. Commonly, the NPS is computed from the squared Fourier transform of a 2D image (20) with the equation where
where  is the image intensity at pixel location
  ;
;  is the global mean intensity;
  and
and  are the spatial frequencies conjugate to
  and
and , respectively;
  and
and  are the numbers of pixels in the
  and
and directions, respectively;
  and
and  represent the pixel spacing in the
  and
and directions, respectively; and
  is the number of regions used for analysis in the ensemble average, which can be adequately reported with a sufficiently large number of regions.
For a completely uniform nuclear medicine flood image, consisting of purely white noise, all frequencies are equally represented in the NPS, resulting in a relatively constant value across all frequencies. However, flood images are never completely uniform; they include both a quantum noise component and a nonquantum structured component (image artifacts) that are represented by increased amplitude, or spikes, in the NPS. Statistically speaking, such structured patterns are not always “noise” because they may not signify a stochastic process. However, they are often referred to as “structured noise” because they are frequently quantified with noise metrology, and they can further influence visual perception in a way similar to stochastic noise.
In this work, we developed a program to estimate structured noise information from nuclear medicine uniformity images using the NPS methodology. The program consists of the following steps.
A 2D NPS of the input flood image is generated. The quantum component of the flood image—estimated in terms of the variance associated with the number of counts in the image—is then subtracted, resulting in a 2D NPS of only the structured noise within the image, represented as peaks above the white quantum noise. To account for how noise texture is perceived by human observers, the 2D NPS is further filtered with a 2D human visual response function (21) with the equation where r is the radial spatial frequency and c is a scale factor selected to yield the maximum for the function at 4 cycles per degree at a typical viewing distance of 150 cm and a typical image display size of 6.5 cm. The original 2D NPS of the input flood image is also filtered with the same human visual response function. Finally, the SNI is computed as the ratio of noise corresponding to the structure—that is, the integral of the filtered 2D NPS—to the total noise in the flood image with the equation
The resulting SNI spans from 0 to 1, with values close to 0 indicating images with nearly perfect uniformity (no structure) and values close to 1 indicating the presence of strong nonuniformities (structure magnitude significantly larger than that of quantum noise).
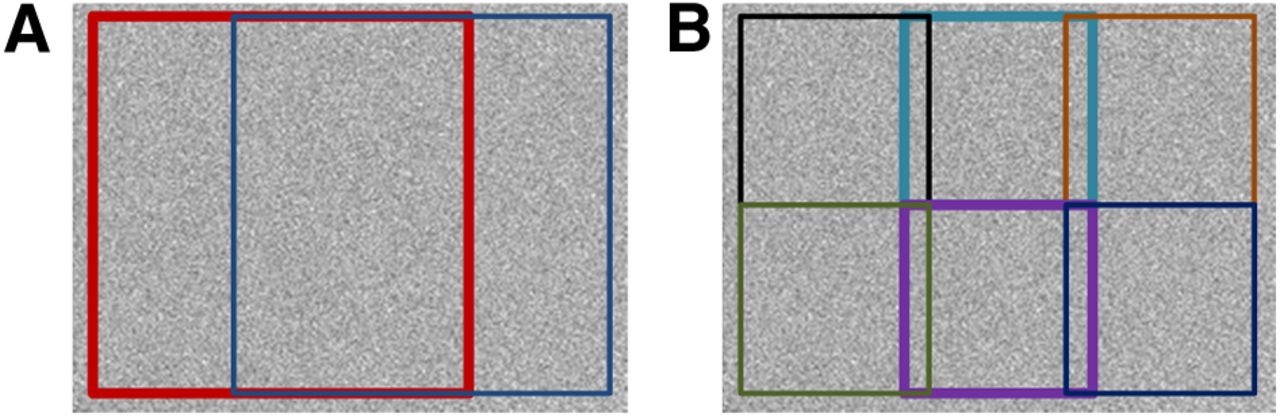
To capture different scales of nonuniformities that may be present in a flood image, a total of 8 regions of interest (ROIs) are used in the SNI analysis. Operating on the central 90% of the full image, identified with a line profile analysis, the image is divided into 2 equally sized overlapping square ROIs (Fig. 1A). Six additional smaller ROIs, with a linear dimension equal to half that of the larger ROIs, are defined to sample more localized regions within the image (Fig. 1B). Together, these 8 ROIs provide a reasonable sampling of both the large-scale artifacts spanning the entire field of view and the small-scale artifacts that may affect only a small portion of the full image area. After the SNI analysis is performed on all 8 ROIs within the image, the highest ROI score is reported as the SNI for the image.

The 8 ROIs used in the SNI analysis. (A) Two large ROIs. (B) Six small ROIs.
Validation
To validate the SNI metric, we performed an observer study with 5 expert nuclear medicine physicists. Fifty-five daily flood-field uniformity images—all acquired with similar acquisition parameters (57Co planar flood source, 256 × 256 acquisition matrix, 4 × 10⁶ total counts), from multiple γ-camera models (Millennium series [×5], Infinia series [×3], and Discovery series [×1], all from GE Healthcare), and with various degrees of structured and nonstructured nonuniformities—were collected, randomized, and sent to the observers on 2 separate occasions. The expert observers were instructed to critically review each image using an image display size of about 6.5 cm and to assign a score of 1–5 (Fig. 2) on the basis of only the visual appearance of the flood image and their knowledge of the relationship between γ-camera uniformity and clinical performance.

Image descriptions used by expert observers.
A Pearson product moment correlation analysis was performed on each set of expert observer results to assess both intraobserver consistency and interobserver consistency. Intraobserver consistency assessed the agreement of each observer’s original and repeated responses. Interobserver consistency assessed the agreement of each observer’s average image score with the average score from all responses. On the basis of the results of the analysis, we used the average of the scores from all 10 responses in our comparison and referred to this value as the average expert observer score.
The threshold value for defining unacceptable images according to the average expert observer score was determined on the basis of the scoring criteria provided to the observers (Fig. 2); we established the threshold at 3.25, which we judged to ensure the inclusion of all visually apparent nonuniformities of clinical significance.
To compare the performance of the SNI metric with that of quantitative uniformity metrics in clinical use, we used the GE Xeleris Flood Uniformity Protocol (GE Healthcare) (22), which is a commercially available uniformity analysis program modeled on the National Electrical Manufacturers Association standard. It is a robust program capable of estimating the integral detector uniformity from nuclear medicine flood images across multiple manufacturer platforms. With this program, we calculated the estimated integral uniformity in both the useful field of view (UFOV) (center 90% of the full field) and the central field of view (CFOV) (center 75% of UFOV linear dimensions) for use in our analysis.
For the estimated integral UFOV and CFOV metrics, thresholds of 6.0% and 5.0%, respectively, were applied; these thresholds are commonly used in clinical settings (23,24). For the SNI metric, a threshold of 0.50 was empirically determined. With the established thresholds, the sensitivity, specificity, positive predictive value, and negative predictive value were computed. Additionally, the strength of the relationship of each uniformity analysis metric with the average expert observer score was evaluated with Spearman rank correlation analysis (25).
Receiver operating characteristic (ROC) curves (26) were generated to provide an additional evaluation of each metric. We generated the ROC curves by using the average expert observer score cutoff of 3.25 and by varying each uniformity metric across all cutoff thresholds to assess all possible combinations of specificity and sensitivity that the metric is able to achieve. This strategy allowed a full assessment of each uniformity metric independently of the cutoff value used and independently of the number of acceptable or unacceptable images used, as determined by the expert observers. The area under the ROC curve was used to evaluate each uniformity metric.
RESULTS
The Pearson product moment correlation coefficients for the observer assessments in the 2 trials and for the 5 expert observers are shown in Table 1. There was strong agreement between each observer’s original and repeated visual assessments (average r, 0.80). There was a higher degree of agreement when each observer’s average score was compared with the overall average score (average r, 0.91), indicating that all 5 observers had a similar impression of the clinical quality of uniformity images. On the basis of the results of these assessments, all 10 sets of observer scores were used in our analysis.
Pearson Product Moment Correlation of Expert Observer Responses
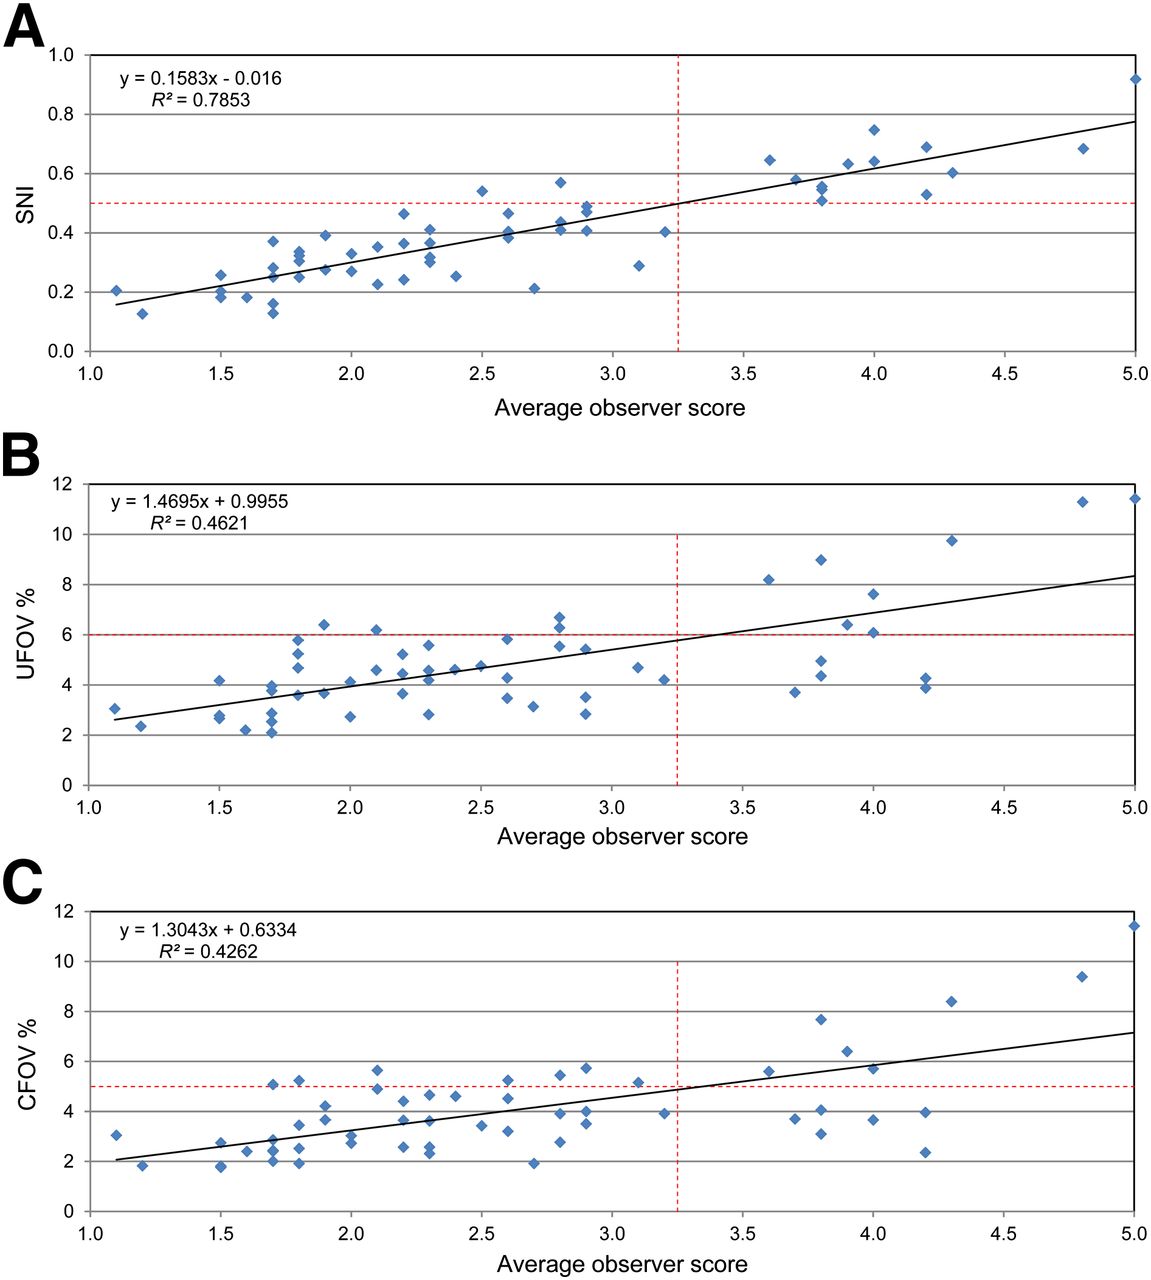
Spearman rank correlation coefficients were used to show the strength of the relationship between each uniformity analysis metric and the average expert observer score. The Spearman rank correlation coefficients of the SNI, estimated integral UFOV, and estimated integral CFOV were 0.86, 0.59, and 0.58, respectively. These results indicated that the SNI had a much stronger correlation with the average expert observer score than did the integral UFOV and the integral CFOV.
When established thresholds were used to create a confusion matrix (Fig. 3), the SNI performed at 100% sensitivity for identifying both structured and nonstructured nonuniformities; for the integral UFOV and CFOV uniformity metrics, the sensitivities were only 62% and 54% (Table 2). The SNI also outperformed the other metrics in overall positive predictive value (87%); for the traditional integral UFOV and CFOV uniformity metrics, overall positive predictive values were only 67% and 50%. Additionally, the SNI exhibited superior specificity and negative predictive value.

Relationship between average expert observer score and SNI (A), estimated integral UFOV uniformity metric (B), and estimated integral CFOV uniformity metric (C); established threshold values are included. Quadrants of each graph illustrate false-positive results (upper left), true-positive results (upper right), true-negative results (lower left), and false-negative results (lower right).
Uniformity Metric Performance Based on Average Expert Observer Visual Assessment
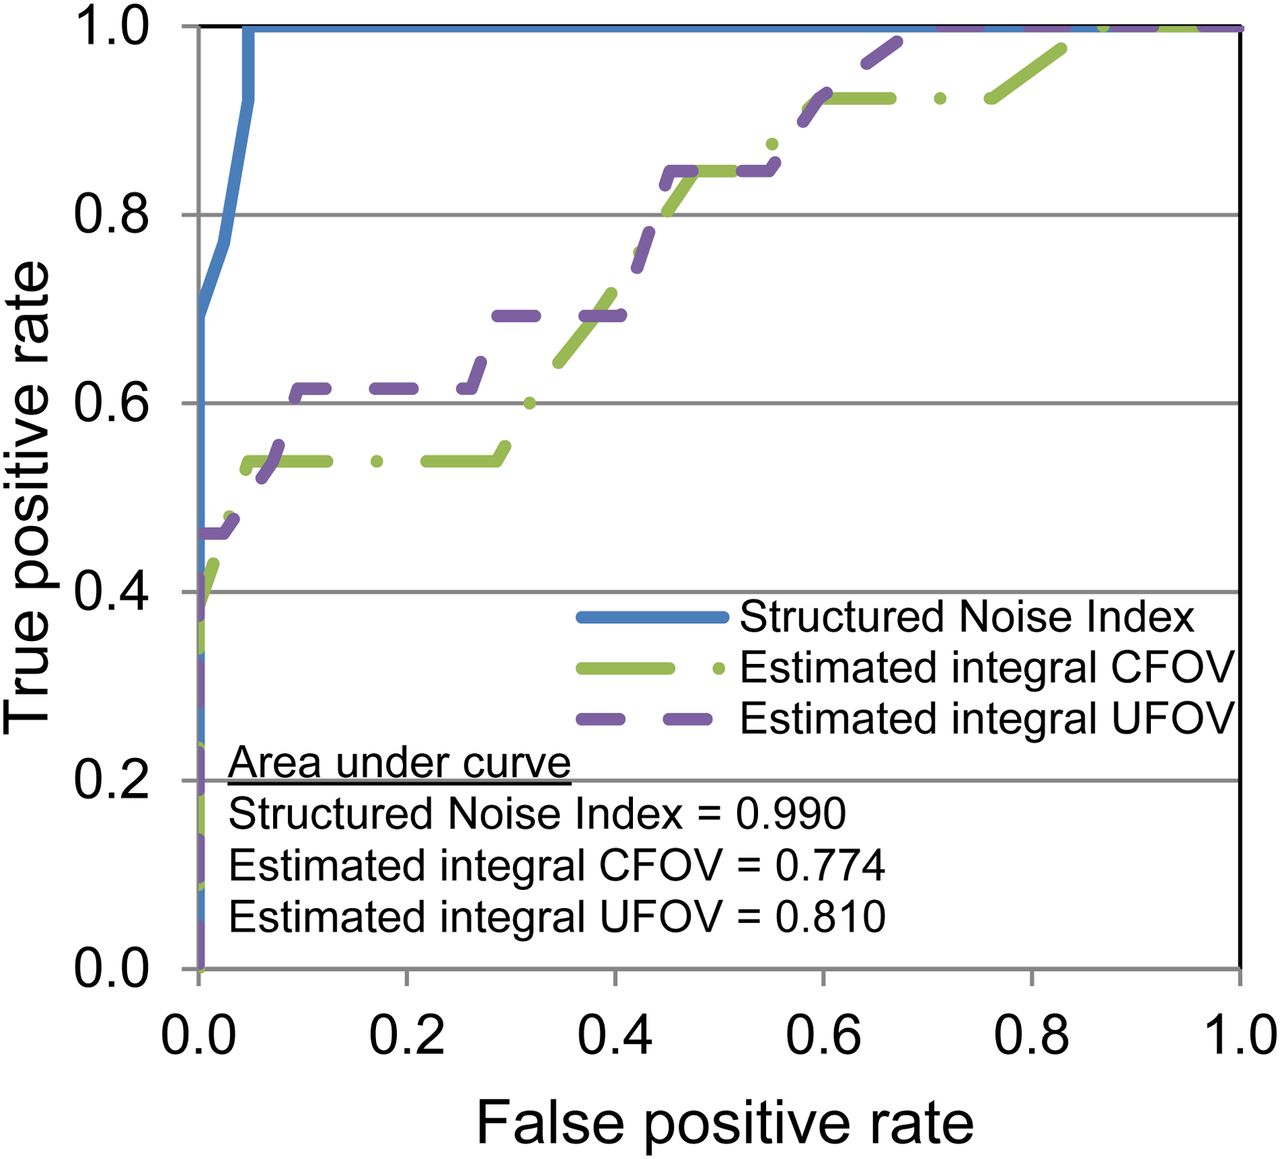
Figure 4 shows the results of the ROC analysis. The area under the ROC curve was an indicator of how well each metric performed (27), with an area of 1.0 indicating perfect agreement with the expert observer score. The SNI metric showed better agreement with the average expert observer score than the integral CFOV and UFOV metrics; the areas under the ROC curve for the SNI, integral CFOV, and integral UFOV were 0.99, 0.81, and 0.77, respectively.

ROC curves comparing each uniformity analysis metric with average expert observer score.
DISCUSSION
Daily uniformity evaluations of a γ camera are an essential element of nuclear medicine quality control and are typically performed by nuclear medicine technologists and overseen by qualified medical physicists (28). Most facilities do not have a qualified nuclear medicine physicist readily available to evaluate the daily uniformity images before clinical use. Furthermore, meticulous visual inspection of uniformity images can be challenging in busy clinics; the result may be that confidence is placed solely on the values generated by traditional pixel value–based analysis programs that often fail to capture subtle structures and patterns, which may be clinically unacceptable. Our strategy provides a more robust assessment of nonuniformity detection, enabling more efficient and accurate quality control evaluation.
The newly developed SNI, derived from the 2D NPS, identified structured patterns present in nuclear medicine flood-field uniformity images. The SNI showed excellent correlation with expert visual perception and statistically outperformed traditional analytic methods, according to all types of evaluation performed. The SNI offers a novel way to accurately quantify artifacts in uniformity images and, especially in the absence of an expert observer, may reduce the need for subjective visual analysis.
Human visual assessment, which is currently the gold standard for determining the clinical quality of uniformity images, is a subjective descriptor; it relies on the expertise of the reviewer as well as the viewing conditions. We attempted to standardize our observer study by providing detailed descriptors in the scoring scale (Fig. 2) and specifying the displayed image size. Even among the 5 expert observers in our controlled study, we found 1 observer with slightly less agreement in the perceived clinical quality of the flood images (Table 1). This finding confirms the subjective nature of visual assessment and provides a strong argument for the need for an objective and reproducible method of characterizing flood-field uniformity. The SNI metric not only provides a method for accurately identifying nonuniformities but also does so in an objective and reproducible manner.
Plots of each evaluated uniformity metric against the average observer score (Fig. 3) visually confirmed that the SNI showed the strongest correlation with expert visual perception. Additionally, when only the distribution of the average observer score was considered, a noticeable gap in the distribution between 3.0 and 3.5 was found. This finding suggests that the observers were in general agreement that images with an average score of less than 3.0 were acceptable for clinical use, whereas images with an average score of greater than 3.5 were unacceptable. These data further support our established threshold of 3.25, which falls at the midpoint of the gap.
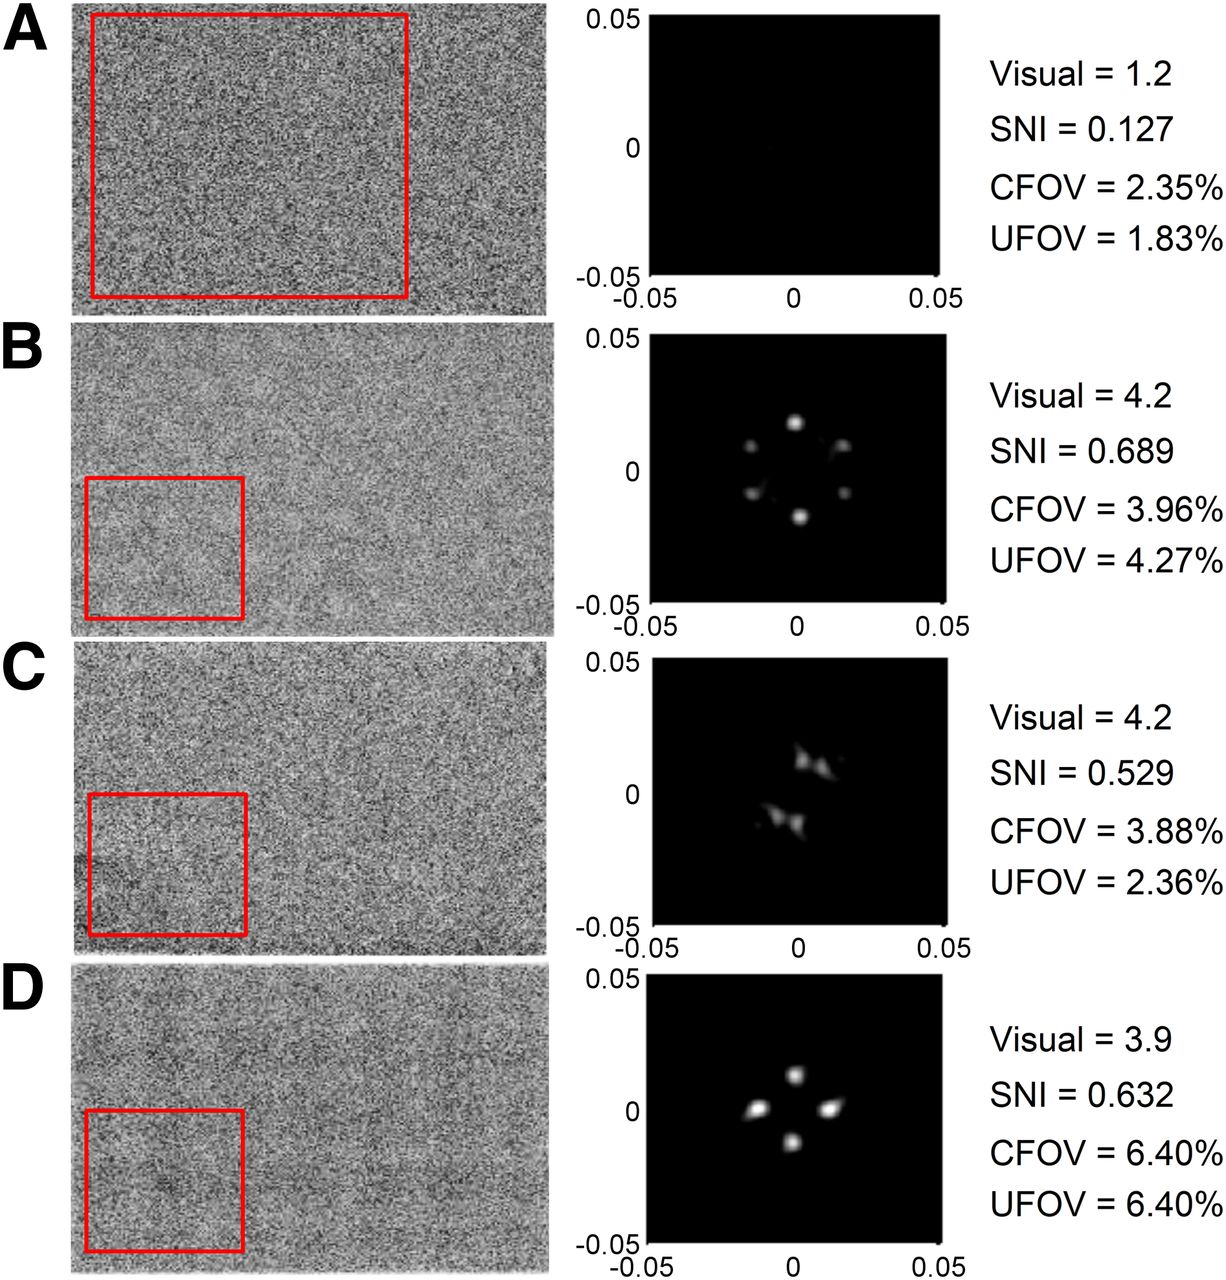
Despite the clinical utility of the SNI metric, we recognize that it is not without limitations. Because the texture of the image described by the NPS is dependent on the size of the ROI analyzed (29), the choice of ROI size is important; the ROI should be slightly larger than the structure that one wishes to capture. Because of differences in the characteristic sizes of numerous γ-camera artifacts, nonuniform structures may vary in size. To account for these differences, the SNI program analyzes 8 separate regions with 2 different sizes of ROIs, thereby accurately allowing for the detection of a wide variety of common artifacts encountered in clinical settings (Fig. 5). Although the sizes of the selected ROIs have been optimized with an initial training set of images, they may not provide the best representation of all possible artifacts; further work is needed to determine whether some structured patterns could be better represented by different sizes of ROIs.

SNI analysis of common clinical artifacts. (A) Good uniformity. (B) Drifting photopeak. (C) Photomultiplier tube gain issue. (D) Corrupt linearity correction. Boxes in input flood images at left indicate ROIs with highest SNIs; center column shows corresponding filtered 2D NPS frequency distributions; and values at right are average expert observer score, SNI, and estimated integral uniformity percentages.
Additionally, the visual response is determined in part by the distance of an observer from a displayed object. Although the human visual response filter attempts to account for this effect, it may not fully represent an actual observer’s visual response function. For example, the visual response filter is defined at a given distance, whereas a human observer may move closer or farther from the screen in an attempt to visualize subtle artifacts. It may be possible to mimic this activity by defining a series of visual response functions for various distances. Although the parameters for the 2D human visual response filter have been reasonably optimized, full clinical implementation of the SNI metric may result in further fine tuning of the parameters. It should be noted that changing any of the acquisition and filter parameters or ROI sizes may require adjustment of the SNI threshold value.
Finally, the parameters for the SNI analysis were chosen to minimize the likelihood of missing an artifact in an image; however, it is not possible to completely duplicate the performance of human observers. Therefore, the SNI offers an improvement in the integral UFOV and CFOV uniformity metrics but may not completely eliminate the need for visual assessment of flood images by qualified personnel. We envision that the SNI metric can be incorporated easily into clinical practice as an integral part of a quality control program; thresholds can be set low enough to ensure that all potential artifacts are flagged for review by qualified personnel while avoiding the need to review images with a high degree of uniformity. This integration would substantially reduce the time that busy hospital staff members spend reviewing inconsequential flood images. In addition, the SNI metric may provide additional objectivity for compliance with commissioning requirements.
CONCLUSION
Uniformity image analysis with traditional pixel value–based methods is not reliable because the tendency to miss subtle nonuniformities that may be visually apparent and clinically significant. This results in the need for additional meticulous and subjective visual assessment. A metric that we derived from the 2D NPS—the SNI—outperformed currently established pixel value–based methods in both identifying nonuniformities and correlating with expert visual analysis, thereby possibly reducing the need for additional visual assessment. This metric provided an accurate and objective uniformity evaluation and may be especially useful if integrated into daily quality control programs in which qualified medical physicists are unable to verify γ-camera flood quality before performing patient studies.
DISCLOSURE
The costs of publication of this article were defrayed in part by the payment of page charges. Therefore, and solely to indicate this fact, this article is hereby marked “advertisement” in accordance with 18 USC section 1734. No potential conflict of interest relevant to this article was reported.
Footnotes
Published online Nov. 8, 2013.
- © 2014 by the Society of Nuclear Medicine and Molecular Imaging, Inc.
REFERENCES
- Received for publication April 25, 2013.
- Accepted for publication September 24, 2013.


