


Article Figures & Data
Figures
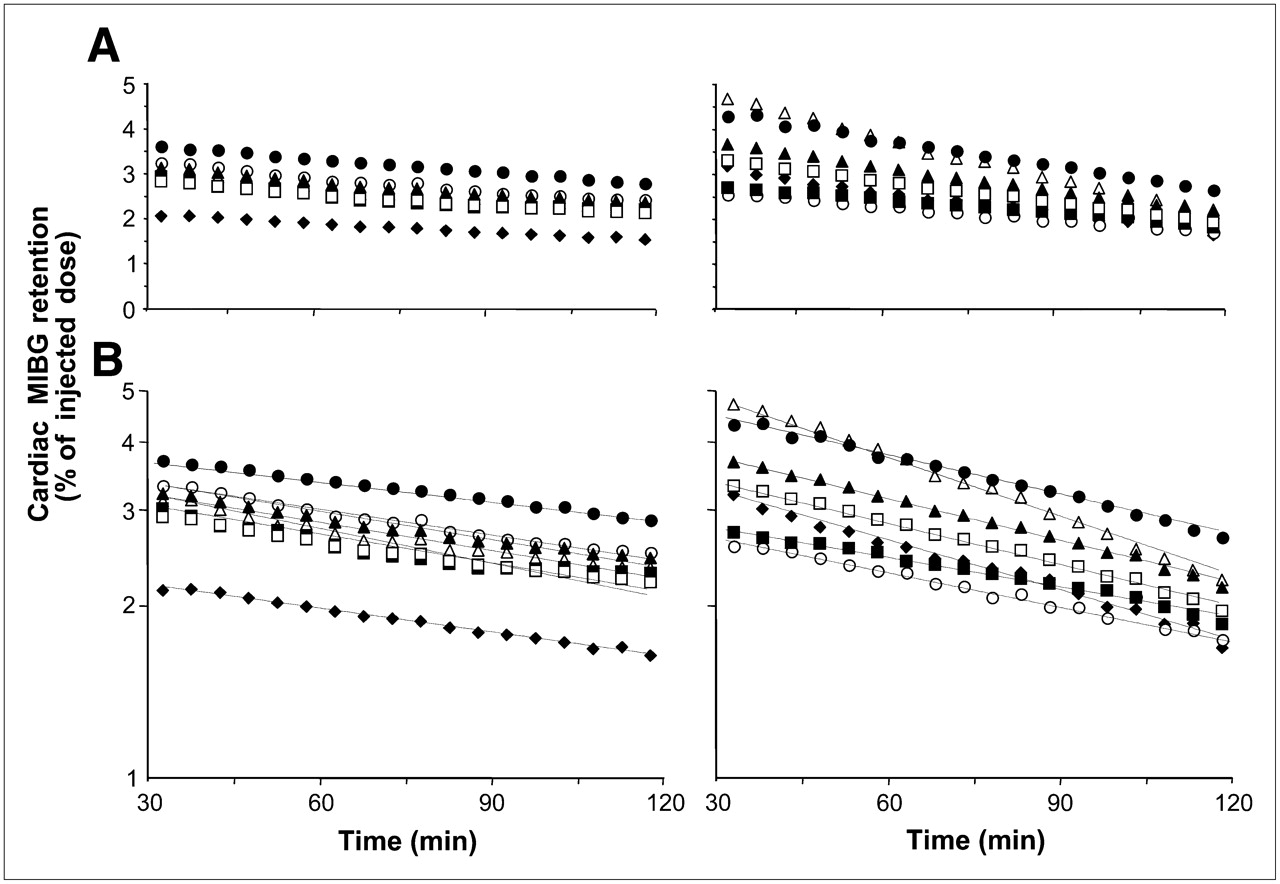
- FIGURE 1.
Myocardial time–activity curves of MIBG, depicted on linear scale (A) and on semilog scale (B). MIBG retention values, expressed as percentage of injected dose, are shown for control (left) and diabetic (right) mice. Early (30 min) uptake was similar for both groups of animals; by contrast, tracer washout was faster in diabetes.
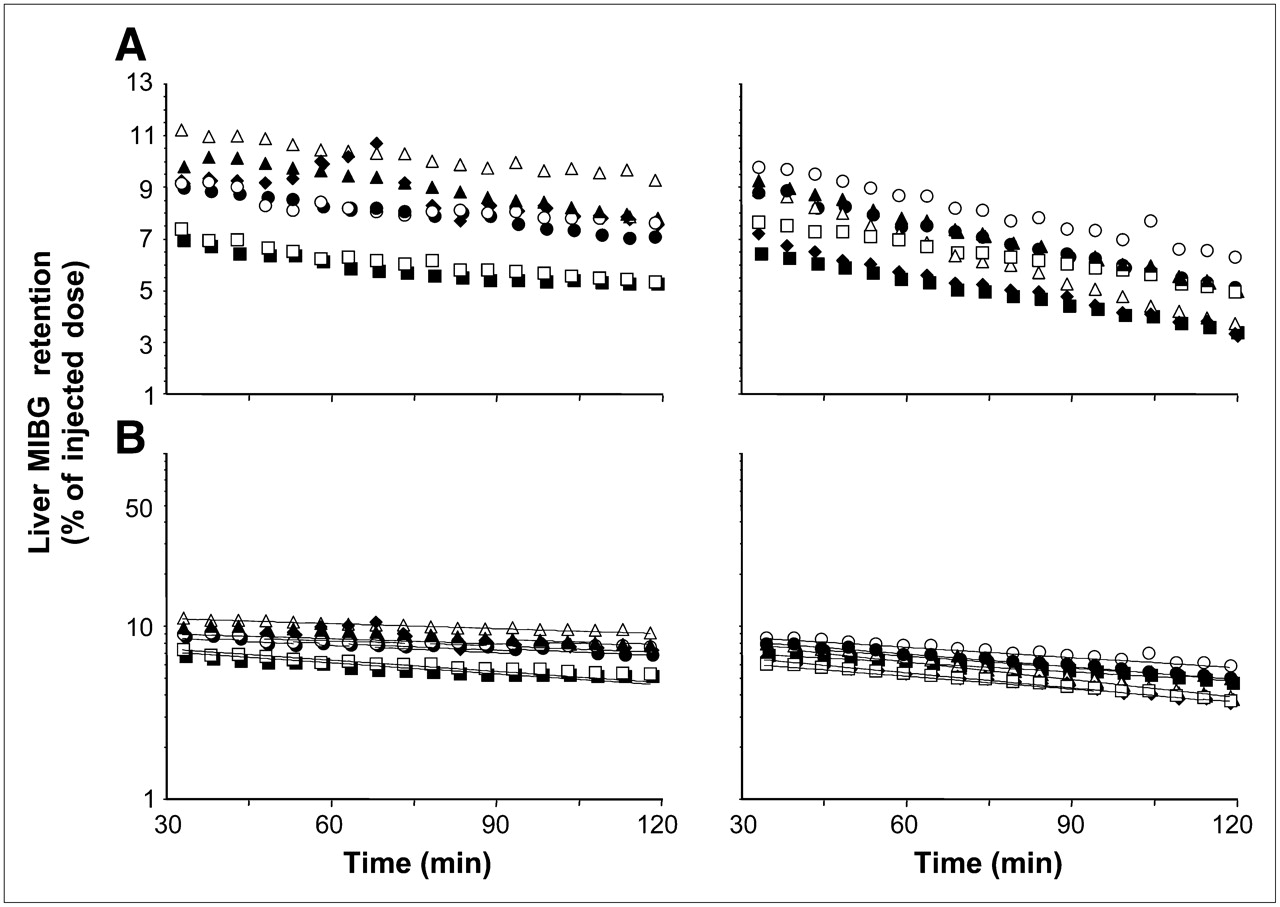
- FIGURE 2.
Liver time–activity curves of MIBG, depicted on linear scale (A) and on semilog scale (B). MIBG retention values, expressed as percentage of injected dose, are shown for control (left) and diabetic (right) mice. Early (30 min) uptake was similar for both groups of animals; by contrast, tracer washout was faster in diabetes.
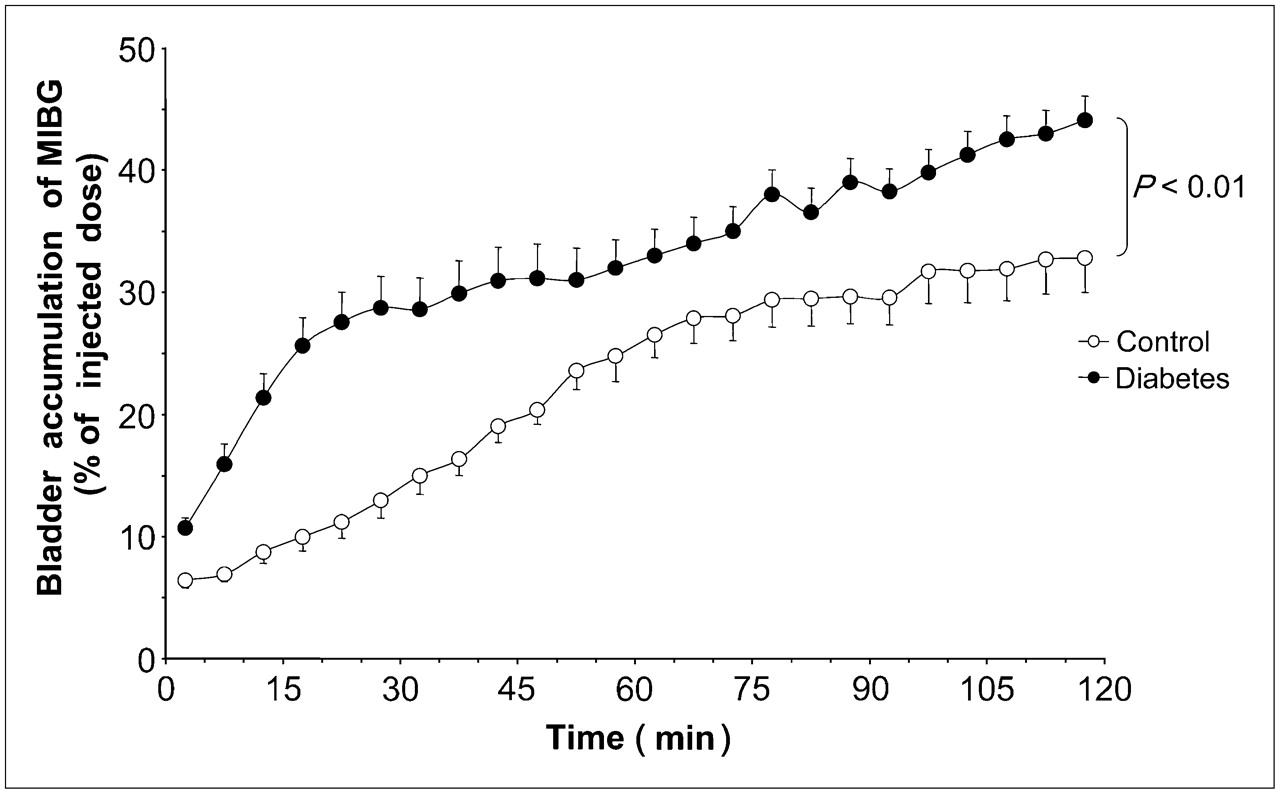
- FIGURE 3.
Bladder accumulation of MIBG, depicted on linear scale. MIBG accumulation curves, expressed as percentage of injected dose, are shown for control and diabetic mice. Data are mean ± SEM.
- FIGURE 4.
Relationship between heart washout and bladder accumulation. Data from control and diabetic mice are expressed as percentage of injected dose. Data are fitted by linear regression curve (black line, r = 0.73).


Tables


Jump to section
Related Articles
Cited By...
- No citing articles found.