
Main menu

  • Home
  • Content
    • Current
    • Ahead of print
    • Past Issues
    • JNM Supplement
    • SNMMI Annual Meeting Abstracts
    • Continuing Education
    • JNM Podcasts
  • Subscriptions
    • Subscribers
    • Institutional and Non-member
    • Rates
    • Journal Claims
    • Corporate & Special Sales
  • Authors
    • Submit to JNM
    • Information for Authors
    • Assignment of Copyright
    • AQARA requirements
  • Info
    • Reviewers
    • Permissions
    • Advertisers
  • About
    • About Us
    • Editorial Board
    • Contact Information
  • More
    • Alerts
    • Feedback
    • Help
    • SNMMI Journals
  • SNMMI
    • JNM
    • JNMT
    • SNMMI Journals
    • SNMMI

User menu

  • Subscribe
  • My alerts
  • Log in
  • My Cart

Search

  • Advanced search
Journal of Nuclear Medicine
  • SNMMI
    • JNM
    • JNMT
    • SNMMI Journals
    • SNMMI
  • Subscribe
  • My alerts
  • Log in
  • My Cart
Journal of Nuclear Medicine

Advanced Search

  • Home
  • Content
    • Current
    • Ahead of print
    • Past Issues
    • JNM Supplement
    • SNMMI Annual Meeting Abstracts
    • Continuing Education
    • JNM Podcasts
  • Subscriptions
    • Subscribers
    • Institutional and Non-member
    • Rates
    • Journal Claims
    • Corporate & Special Sales
  • Authors
    • Submit to JNM
    • Information for Authors
    • Assignment of Copyright
    • AQARA requirements
  • Info
    • Reviewers
    • Permissions
    • Advertisers
  • About
    • About Us
    • Editorial Board
    • Contact Information
  • More
    • Alerts
    • Feedback
    • Help
    • SNMMI Journals
  • View or Listen to JNM Podcast
  • Visit JNM on Facebook
  • Join JNM on LinkedIn
  • Follow JNM on Twitter
  • Subscribe to our RSS feeds
Research ArticleCLINICAL INVESTIGATIONS

Optimal Metabolite Curve Fitting for Kinetic Modeling of 11C-WAY-100635

Songmei Wu, R. Todd Ogden, J. John Mann and Ramin V. Parsey
Journal of Nuclear Medicine June 2007, 48 (6) 926-931; DOI: https://doi.org/10.2967/jnumed.106.038075
Songmei Wu
  • Find this author on Google Scholar
  • Find this author on PubMed
  • Search for this author on this site
R. Todd Ogden
  • Find this author on Google Scholar
  • Find this author on PubMed
  • Search for this author on this site
J. John Mann
  • Find this author on Google Scholar
  • Find this author on PubMed
  • Search for this author on this site
Ramin V. Parsey
  • Find this author on Google Scholar
  • Find this author on PubMed
  • Search for this author on this site
  • Article
  • Figures & Data
  • Info & Metrics
  • PDF
Loading

Article Figures & Data

Figures

  • Tables
  • FIGURE 1. 
    • Download figure
    • Open in new tab
    • Download powerpoint
    FIGURE 1. 

    Diagram of kinetic model. Parent compound begins in plasma and passes to tissue compartment (thought to be composed primarily of liver but could also include kidneys and other tissues). Some compound is metabolized and moves to “met” compartment; rest is excreted back to blood without being metabolized. Rate parameters k1– k4 are assumed to be nonnegative.

  • FIGURE 2. 
    • Download figure
    • Open in new tab
    • Download powerpoint
    FIGURE 2. 

    Fitted data for all models for 1 subject's data. Plots show fitted unmetabolized fraction vs. observed data.
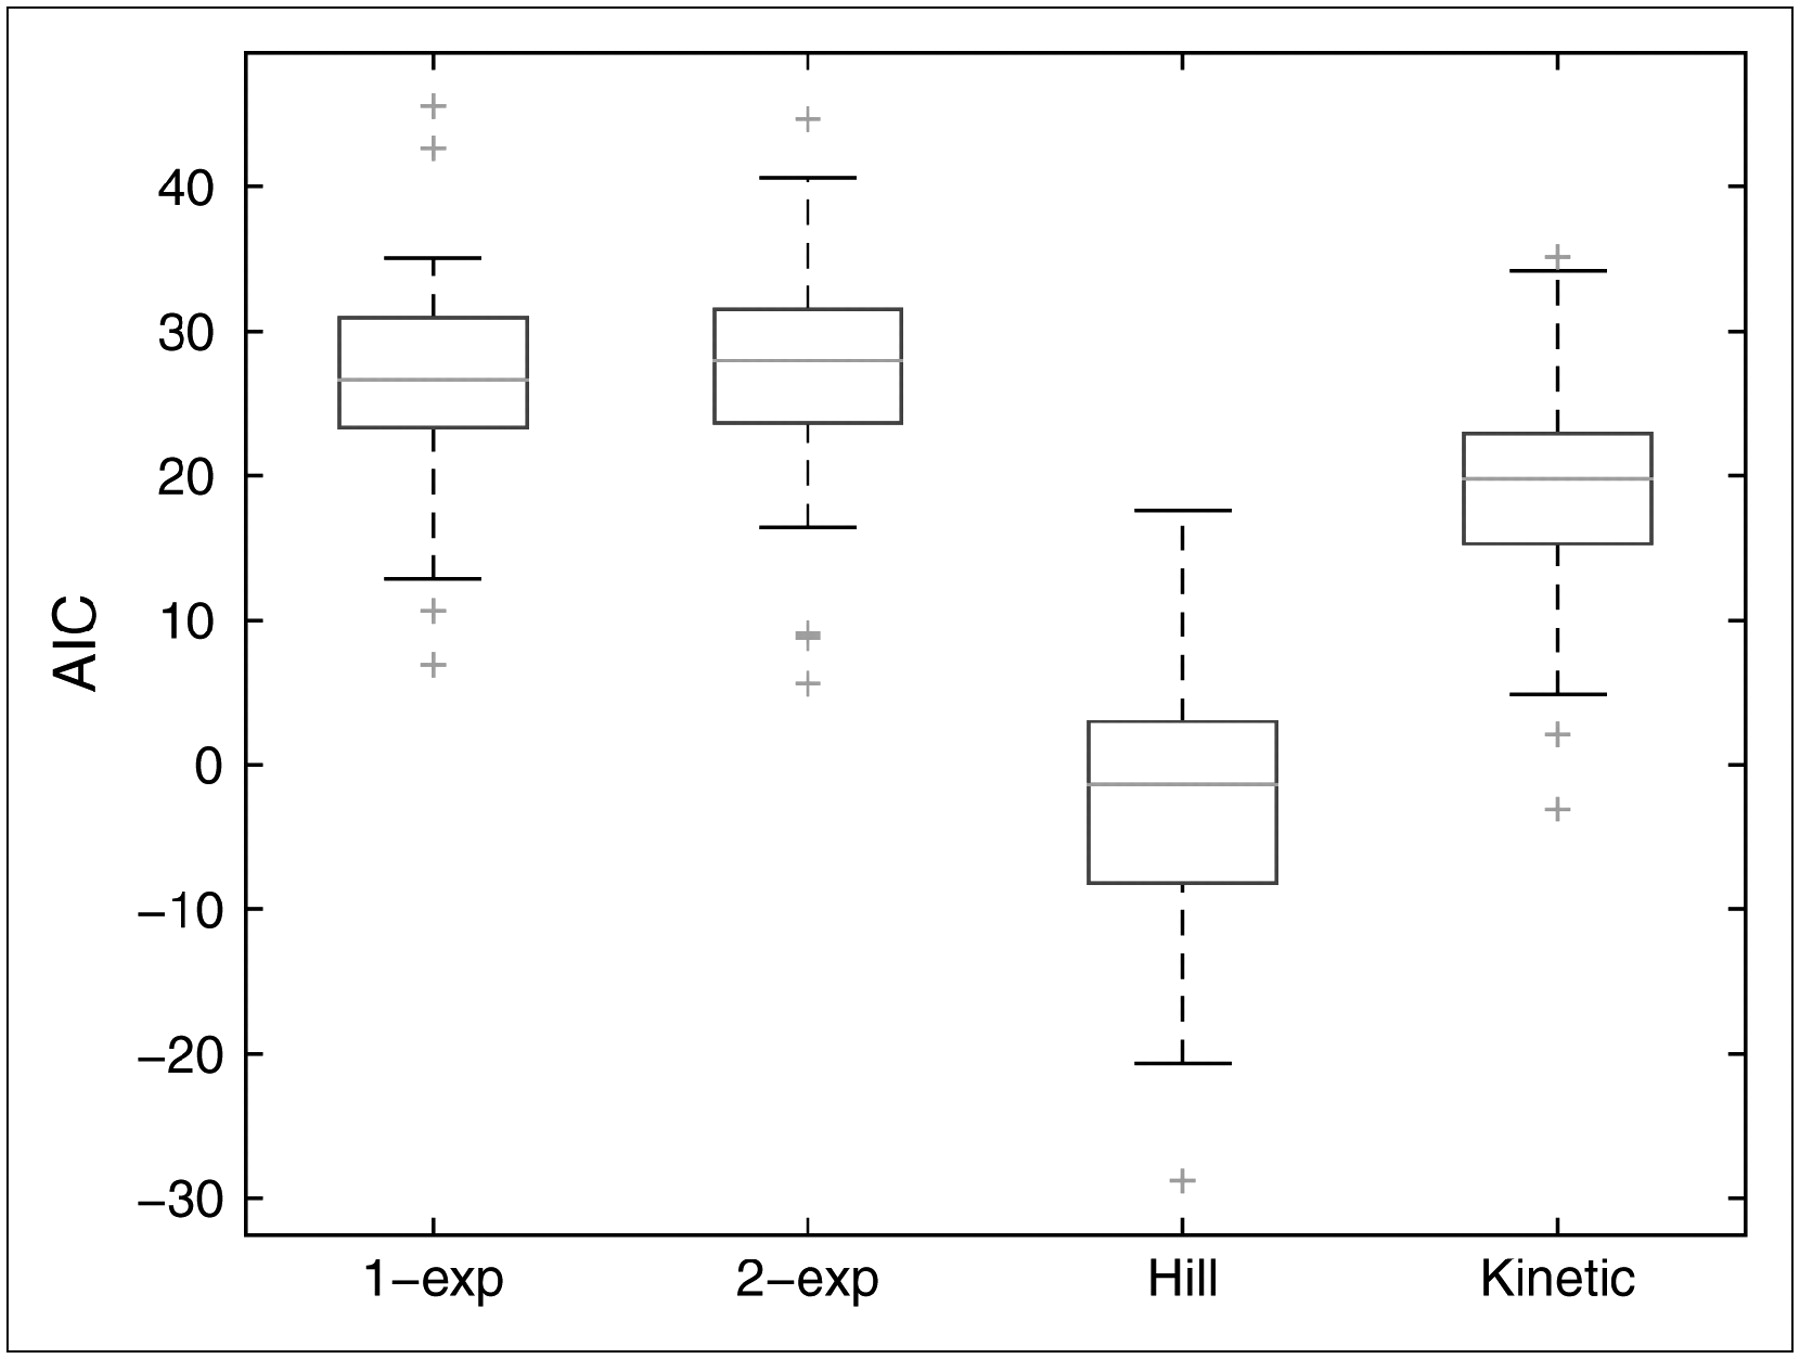
  • FIGURE 3. 
    • Download figure
    • Open in new tab
    • Download powerpoint
    FIGURE 3. 

    Box plots of AIC values for 1-exponential, 2-exponential, Hill, and kinetic models. One- and 2-exponential models have similar results, and kinetic model has smaller values than exponential models. Compared with the others, Hill model tends to have much smaller values: Maximum AIC value is less than median for kinetic model and less than 25th percentile for other models. exp = exponential.

  • FIGURE 4. 
    • Download figure
    • Open in new tab
    • Download powerpoint
    FIGURE 4. 

    Graph of weighted residual for each model. For better visual display, points are spread out by adding small amount of gaussian noise in x direction. For 1- and 2-exponential models, residuals tend to fall only on one side of zero at each time point. Means of residuals are relatively far from zero, and distributions of residuals are, in general, rather asymmetric and heavily skewed. For kinetic model, similar problems exist. Residuals for Hill model look more reasonable: They are evenly scattered around zero, and their distributions are fairly symmetric. Although, at first 2 time points, residuals are skewed to one side of zero, they are all quite small relative to those of other models.

Tables

  • Figures
    • View popup
    TABLE 1

    BP1 Measurements Using Each of the 4 Candidate Models on 4 Brain Regions, Along with VT Estimates for Cerebellum

    BP1
    ModelAmygdalaHippocampusCingulateParietal lobeVT, cerebellum
    1-exponential3.87 (2.41)3.14 (1.27)2.54 (1.01)5.91 (5.01)0.555 (0.257)
    2-exponential3.98 (2.56)3.16 (1.27)2.59 (1.09)5.43 (3.13)0.557 (0.237)
    Hill2.73 (1.21)2.47 (1.00)2.03 (0.83)3.88 (1.98)0.488 (0.211)
    Kinetic1.12 (1.31)1.07 (1.43)0.95 (1.26)2.05 (3.69)0.282 (0.237)
    • Data are means, with SDs in parentheses. SDs are substantially smaller for Hill model.

    • View popup
    TABLE 2

    Paired t Tests and Signed-Rank Tests for Testing Difference Between BP1 and VT Estimates from Different Models

    BP1
    ModelTestAmygdalaHippocampusCingulateParietal lobeVT, cerebellum
    Hill vs. 1-exponentialt statistic6.628.9212.974.939.81
    Degrees of freedom8483848383
    P value<0.0001<0.0001<0.0001<0.0001<0.0001
    No. of outliers23233
    Signed-rank statistic338140138199
    P value<0.0001<0.0001<0.0001<0.0001<0.0001
    Hill vs. 2-exponentialt statistic6.2010.8811.699.0910.95
    Degrees of freedom8483848083
    P value<0.0001<0.0001<0.0001<0.0001<0.0001
    No. of outliers23263
    Signed-rank statistic9612095140246
    P value<0.0001<0.0001<0.0001<0.0001<0.0001
    Hill vs. kinetict statistic−9.79−9.57−8.25−4.07−5.52
    Degrees of freedom7577777678
    P value<0.0001<0.0001<0.0001<0.0001<0.0001
    No. of outliers1199108
    Signed-rank statistic906822791905760
    P value<0.0001<0.0001<0.0001<0.0001<0.0001
    • For Wilcoxon test, all 87 subjects are included, but several outliers (generally resulting from nonconvergence of modeling of PET data) were removed before computing summaries displayed in Table 1 and conducting paired t tests.

PreviousNext
Back to top

In this issue

Journal of Nuclear Medicine: 48 (6)
Journal of Nuclear Medicine
Vol. 48, Issue 6
June 2007
  • Table of Contents
  • Table of Contents (PDF)
  • About the Cover
  • Index by author
Print
Download PDF
Article Alerts
Sign In to Email Alerts with your Email Address
Email Article

Thank you for your interest in spreading the word on Journal of Nuclear Medicine.

NOTE: We only request your email address so that the person you are recommending the page to knows that you wanted them to see it, and that it is not junk mail. We do not capture any email address.

Enter multiple addresses on separate lines or separate them with commas.
Optimal Metabolite Curve Fitting for Kinetic Modeling of 11C-WAY-100635
(Your Name) has sent you a message from Journal of Nuclear Medicine
(Your Name) thought you would like to see the Journal of Nuclear Medicine web site.
Citation Tools
Optimal Metabolite Curve Fitting for Kinetic Modeling of 11C-WAY-100635
Songmei Wu, R. Todd Ogden, J. John Mann, Ramin V. Parsey
Journal of Nuclear Medicine Jun 2007, 48 (6) 926-931; DOI: 10.2967/jnumed.106.038075

Citation Manager Formats

  • BibTeX
  • Bookends
  • EasyBib
  • EndNote (tagged)
  • EndNote 8 (xml)
  • Medlars
  • Mendeley
  • Papers
  • RefWorks Tagged
  • Ref Manager
  • RIS
  • Zotero
Share
Optimal Metabolite Curve Fitting for Kinetic Modeling of 11C-WAY-100635
Songmei Wu, R. Todd Ogden, J. John Mann, Ramin V. Parsey
Journal of Nuclear Medicine Jun 2007, 48 (6) 926-931; DOI: 10.2967/jnumed.106.038075
Twitter logo Facebook logo LinkedIn logo Mendeley logo
  • Tweet Widget
  • Facebook Like
  • Google Plus One
Bookmark this article

Jump to section

  • Article
    • Abstract
    • MATERIALS AND METHODS
    • RESULTS
    • DISCUSSION
    • CONCLUSION
    • Acknowledgments
    • Footnotes
    • References
  • Figures & Data
  • Info & Metrics
  • PDF

Related Articles

  • This Month in JNM
  • PubMed
  • Google Scholar

Cited By...

  • Modeling Strategies for Quantification of In Vivo 18F-AV-1451 Binding in Patients with Tau Pathology
  • Quantification of 11C-Laniquidar Kinetics in the Brain
  • In Hot Blood: Quantifying the Arterial Input Function
  • Modeling Considerations for 11C-CUMI-101, an Agonist Radiotracer for Imaging Serotonin 1A Receptor In Vivo with PET
  • Google Scholar

More in this TOC Section

  • Feasibility of Ultra-Low-Activity 18F-FDG PET/CT Imaging Using a Long–Axial-Field-of-View PET/CT System
  • Cardiac Presynaptic Sympathetic Nervous Function Evaluated by Cardiac PET in Patients with Chronotropic Incompetence Without Heart Failure
  • Validation and Evaluation of a Vendor-Provided Head Motion Correction Algorithm on the uMI Panorama PET/CT System
Show more Clinical Investigations

Similar Articles

SNMMI

© 2025 SNMMI

Powered by HighWire