


Abstract
One of the main degrading factors in the quality of oncologic PET images of the thorax and upper abdomen is respiratory motion of tumors. One method to reduce this effect is the acquisition of PET data in gated mode. A second method is the correction of studies for motion. Motion registration is essential in both cases. We report a method using list-mode data to detect the craniocaudal (z) movement of thoracic and abdominal lesions without using any external gating device. The aim of this study was to show the feasibility of applying this method to patient data. Methods: For 10 patients with lesions in the lung or upper abdominal organs, images for short time bins of 250, 500, and 750 ms were reconstructed. A volume of interest, which was manually defined in a summed image around the structure of interest, was projected to each time bin. The center of mass of the activity distribution in this volume of interest was determined for each case. The curves of the z-coordinate of the center of mass (zCOM) over the time were analyzed and compared with respiration curves obtained by a pressure-sensitive belt. Results: In 7 of the 10 patients, movement of the lesion was registered in good accordance with the pressure belt. In the 3 remaining patients, no changes in the center of mass due to respiration could be detected, most likely because of minimal respiratory motion. The maximal difference in zCOM for a lesion that was detected within the 10-min acquisition was 18.5 mm. For 7 of the 10 patients, the mean value for each respiration amplitude was between 11.0 and 2.0 mm. Conclusion: We have shown the feasibility of registering movement of high-uptake lesions without the use of any external device that may restrain the patient. Furthermore, unlike external sensors, this method quantifies internal motion and, thus, is a promising base for correction methods.
Because PET can deliver unique information on the metabolism of cancer lesions, interest in using it for tumor staging, radiation treatment planning, and therapy control has increased in recent years. Because the acquisition takes several minutes per bed position, the quantitative accuracy of the PET images is strongly reduced by movement of the patient. Especially in the region of the lung and upper abdominal organs, where tumors can move up to 2 cm because of respiration (1), this movement results in image blurring, leading to inaccurate quantification of the size and uptake of a lesion (2). In PET/CT, additional artifacts appear when the CT image, which is acquired within seconds and often during a breath-hold, is used for attenuation correction of the PET images (3). These inaccuracies are a problem for treatment planning in radiotherapy, in which implementing biologic target volumes is becoming increasingly important (4,5). Especially if respiration-gated radiotherapy is used (6,7), it is important to have 4-dimensional information about the tumor. To get this information from the PET dataset, investigators have reported several methods of handling the effects of respiratory motion in PET studies. The most common is respiration-gated PET (Fig. 1) (2). The disadvantage of this method is the reduced signal-to-noise ratio of each image, because only a fraction of the counts in the whole acquisition is used. Thus, the preferable method is to correct studies for patient movement (8–10). In that case, all acquired counts can be used.
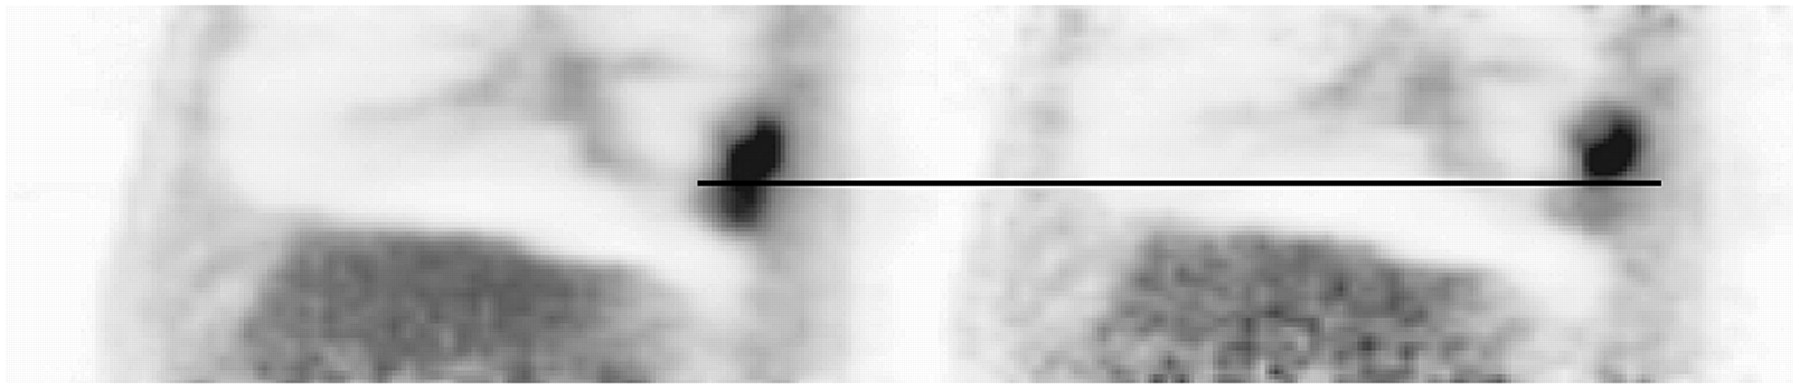
Comparison of ungated (left) and gated (right) 18F-FDG PET study of a lung tumor.
However, common to all the proposed methods is that movement has to be registered before application of the correction algorithm. Several types of external sensors are in use for movement registration, for example, pressure belts around the thorax (11), spirometers (12), and infrared tracking systems (2). All these external sensors need to be placed on the patient, a step that costs additional time and might increase the discomfort of the patient. Additionally, and most important for correction algorithms, all these sensors deliver information about movement of the thorax only—information that does not necessarily correspond to movement of internal structures. For example, Rietzel et al. found a phase shift between internal tumor and abdominal surface motion in 4-dimensional CT studies (13).
We report a method in which PET list-mode data are used to detect movement of lesions with focal uptake by looking at the z-coordinate of the center of mass (zCOM) for the activity distribution of this lesion in the PET data. In this first study, we concentrated on movement in the craniocaudal direction, because movement is expected to be greatest in this direction (1,14). The basic idea of this method was already applied by Klein et al. (15) to detect heart motion in cardiac PET studies. Use of the center of mass for detecting tumor position was previously applied by Goerres et al. (16) for testing coregistration between PET and CT. Our study focused on evaluating this data-driven method for the detection of movement of tumors in the lung and upper abdominal organs.
MATERIALS AND METHODS
Data Acquisition
All patients underwent a PET/CT examination using a routine clinical protocol for oncologic staging or restaging (18F-FDG), with an injected dose of between 320 and 507 MBq depending on the weight of the patient. The acquisition was performed with a Biograph Sensation 16 scanner (Siemens Medical Solutions), characterized recently by Martínez et al. (17). After the routine scan (between 86 and 116 min after injection), the axial field of view of the tomograph was centered on the expected lesion and 10-min list-mode data were acquired. All patients gave written informed consent for the PET and CT studies. Patients who did not have a lesion in the appropriate region—that is, the whole lung or upper abdominal organs—were excluded from the study, as were patients who had no well-circumscribed lesions. In all cases, the respiration cycle was monitored externally using a pressure-sensitive elastic belt around the thorax of the patient (Anzai Medical Co., Ltd.). The signal from this belt was acquired with a computer, stored in a separate file, and used as a standard of reference.
Data Processing
As a first step, the data of the whole 10-min acquisition were binned into a sinogram and a summed image was reconstructed with the attenuation-weighted ordered-subset expectation maximization algorithm implemented by the manufacturer of the tomograph (4 iterations and 8 subsets). This reconstruction included attenuation correction using the CT of the standard protocol and scatter correction (18). As a second step, the list-mode data were separated into short frames. For the first patient, frame lengths of 100, 250, 500, 750, and 1,000 ms were used to find the optimal value for sampling time. For the other 9 patients, frames of 250, 500, and 750 ms were used. Subsequently, these frames were rebinned into sinograms and reconstructed with the same attenuation-weighted ordered-subsets expectation maximization algorithm as was used before for the summed image. Attenuation correction was applied, but because of problems with the algorithm due to the low number of counts in the short frames, no scatter correction was applied. Noncommercial software developed by Siemens Medical Solutions was used for sinogram rebinning and image reconstruction.
In the summed image, a cuboid volume of interest (VOI) was drawn manually around the active structure that needed to be investigated for movement. Software that had been developed in house was used for this step (IDL; RSI Inc.). The VOI can be defined and manipulated in transversal, sagittal, or coronal views. This VOI was then projected to each of the short frames. Within this volume, the coordinate for the craniocaudal direction (z-coordinate) of the center of the activity distribution (Fig. 2A) was calculated using the following equation: Eq. 1where t is the time of the short frame, i covers all voxels inside the VOI, zi is the z-coordinate of the i-th pixel, and Ai is its activity value.
zCOM(t) as a function over time delivers the data-driven respiration curve (Fig. 2B). To reduce statistical noise and possible high-frequency motion due to the cardiac beat, a noise-degrading filter was applied to the obtained respiration curves. The Savitzky-Golay filter (19) was chosen for this purpose because it maintains the magnitude of the amplitude. Calculation of the center of mass for all frames, as well as processing of the respiration curve, was performed using IDL software. The obtained data-driven curves have been compared with curves acquired with the pressure-sensitive belt and analyzed for motion. This comparison was performed visually and also with IDL software. The software registers the maxima and minima of the respiration peaks, yielding the number and amplitude of respiration peaks within the 10 min. The number of registered peaks was then used as a quality criterion for the data-driven curves, compared with the curve from the pressure belt.
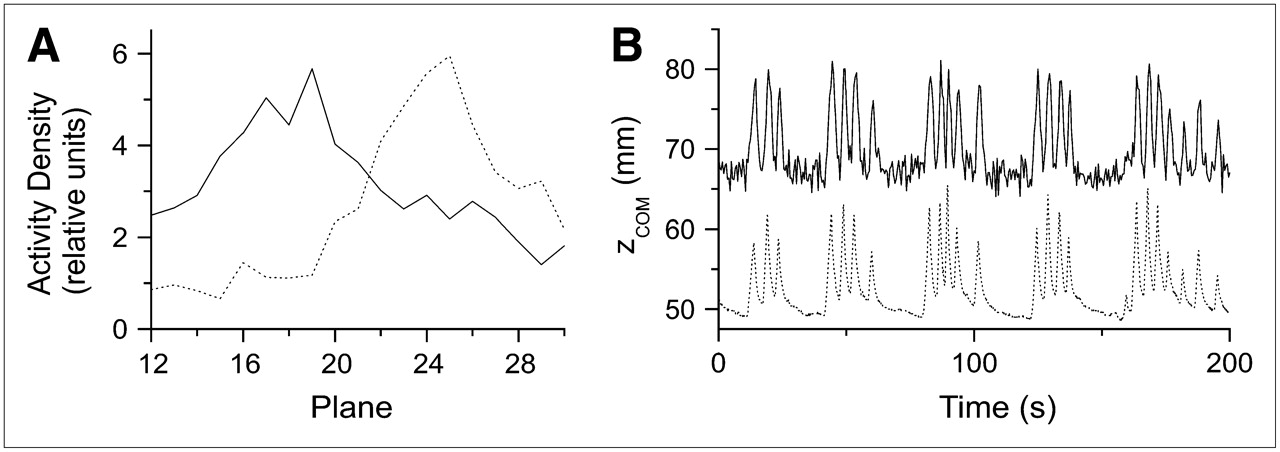
(A) Activity distribution within VOI around tumor for 2 different 500-ms frames: one in expiration state (solid line) and one in inspiration state (dotted line). (B) Data-driven curve of first 200 s of patient 1 (solid line), compared with curve obtained by pressure-sensitive belt (dotted line).
RESULTS
Patients
We scanned 10 patients with 11 lesions. Patients 1–4, 9, and 10 each had a single lung tumor. Patient 5 had 2 lung lesions that were clearly separable. Patient 6 had multiple metastases in the lung, but a group of metastases in the right lung was separable, so that it was possible to draw a VOI around them to analyze for motion. Patients 7 and 8 had a tumor in the stomach and the liver, respectively. The diameter of the lesions, measured from the CT data, ranged from 11 to 55 mm (Table 1).
Tumor Movement: Results from Analysis of Data-Driven Curves (500-ms Sampling Time)
Sampling Time
For patient 1, the data-driven curves for a sampling time of 250, 500, and 750 ms showed a signal fitting well the signal from the pressure-sensitive belt, and the number of registered peaks differed only by 2. For the sampling time of 100 ms, the signal was naturally noisier. Although it is possible to reduce this effect with noise-degrading filters as long as the motion signal is intense enough, it may be problematic when movement of lesions is at the limit of detectability. On the other hand, time frames of 1,000 ms lead to a shift in peak activity within the VOI during acquisition of the frame. Peak activity smears, and the registered amplitude lessens. Hence, we decided to analyze the following patient data only with 250-, 500-, and 750-ms sampling resolutions. Comparing these 3 sampling times for 10 patients (Table 2) with breathing frequencies ranging from 7 to 20 per minute yielded an optimal sampling time of 500 ms.
Quality of Data-Driven Curves
For the 10-min curve, in some cases fewer respiration peaks were detectable with time frames of 750 ms than with 500 ms. In a single patient with a breathing frequency of 20 per minute, the 750-ms sampling time showed only 172 of the 201 cycles found in the curve with a 500-ms sampling time. With a 250-ms sampling time, a few additional peaks have been registered. Either these were induced by statistical noise or the noise was so strong that respiration peaks were not detectable. In 1 case (patient 9), the data-driven curve with a 250-ms sampling time did not show a respiration cycle whereas those with 500- and 750-ms sampling times did. Hence, we decided to use the curves with a 500-ms sampling time for the further analysis shown below.
The measured value for the amplitude depended on the sampling time. The mean amplitude for the tumor in patient 1 varied between 9.7 mm for 1,000 ms and 11.2 mm for 250 ms. In summary, for the 10 patients, the difference in maximal and mean amplitude for the different sampling times stayed within 10%.
Tumor Motion
In patients 1, 4, and 9, the shape of the obtained data-driven respiration curve showed, visually and numerically, that the registered peaks agreed well with the peak from the pressure-sensitive belt, even without use of a noise-degrading filter (Fig. 2B). In patients 6–8, the obtained respiration curve was noisier; therefore, the previously described Savitzky-Golay filter was applied (Fig. 3A). The resulting curves agreed well with the curves from the belt.
(A) Use of Savitzky-Golay filter in 200-s sequence of patient 5 (lesion 1). Filtered curve (solid line) is shifted for demonstration. (B) Example of data-driven curve (solid line) showing no correlation with curve obtained by pressure-sensitive belt (dotted line).
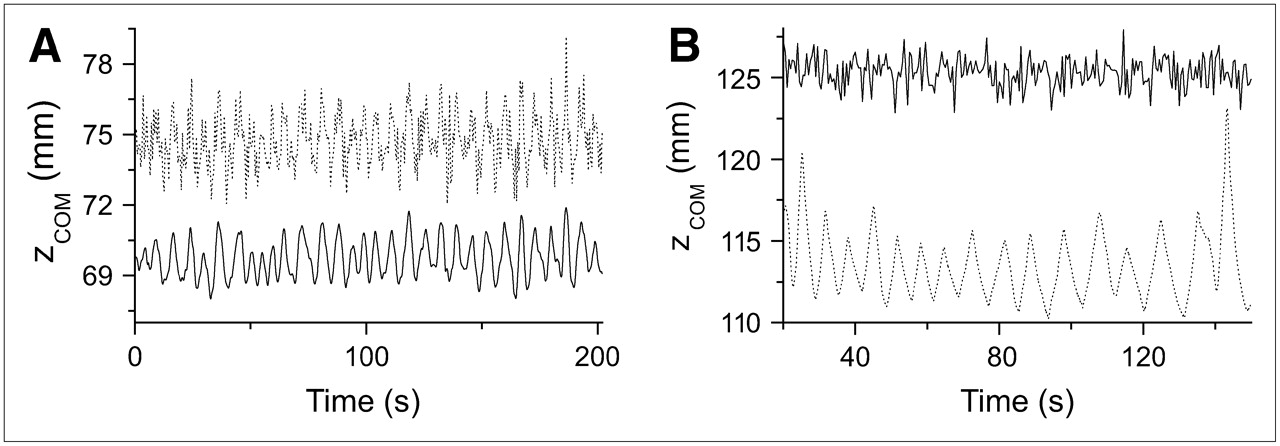
In 3 patients (patients 2, 3, and 10), the data-driven signal did not correlate with the breathing cycle (Fig. 3B). In patient 2, a shift in the baseline of the measured curve was found (Fig. 4A), most likely caused by a shift of the patient during the list-mode acquisition. In patient 8, during several intervals both signals—data-driven as well as from the pressure belt—were heavily disturbed when the patient coughed (Fig. 4B).

(A) Data-driven curve of patient 2 for the full 10 min. Baseline shift, which might indicate rigid body motion, is visible at about 420 s. (B) Example of irregular breathing pattern (coughing) in patient 8 at beginning of displayed 100-s sequence (arrow). Data-driven curve (solid line) is compared with signal from pressure-sensitive belt (dotted line).
After visual comparison of the curves, we analyzed each curve for the maximum difference in zCOM over the whole acquisition, the maximum difference in zCOM for 1 respiration cycle, and the mean difference in zCOM during the acquisition. The largest movement was registered for patient 1, with an 18.5-mm maximum difference in zCOM during the study, whereas the mean amplitude of the respiration cycle was 11 mm (Table 1).
DISCUSSION
In this study, we established the methodology for generating data-driven motion curves by the use of PET list-mode datasets. In 8 of 11 lesions, we obtained curves showing, visually and numerically, good agreement with the curve measured by a pressure-sensitive belt. An important advantage is that the registered motion is the internal movement of the structure of interest. Hence, the previously reported problem (13) of a possible phase difference between external thorax excursion and internal tumor movement does not appear. The problem of such a phase shift could also be solved by tracking tumor motion beforehand by CT, MRI, or ultrasound and matching it to the PET study using external movement signals. But this solution means additional time for handling, additional radiation exposure in the case of CT, problems with coregistration and synchronization, and much computation, which can induce noise and artifacts.
The measured motion amplitude is obtained as an absolute value. We have observed that the measured amplitude varies by about 10% depending on the frame length used to obtain the data-driven curves. Motion amplitude is also influenced by attenuation correction. In non–attenuation-corrected reconstruction, the wrong background activity, especially in the lung, can significantly misrepresent the amplitude of the data-driven curve.
Tumor motion within the lung and upper abdominal organs is highly variable (1,14), with the largest tumor motion being in the craniocaudal direction. Although in some cases, especially in the upper lobes of the lung, tumor motion occurs in the anteroposterior direction, we decided to track tumor movement in the craniocaudal direction to show the feasibility of the new method. We will expand our method in the future to see whether motion in other directions is significant. A statistically significant correlation between tumor mobility and tumor localization has been found, but with a high variability (14). Tumors in the lower region were more mobile than tumors in the upper region. Hence, the absence of respiratory motion in the data-driven signal of 3 patients (patients 2, 3, and 10) is not surprising and may be explained by the slightness or absence of tumor motion, especially because 2 of these tumors were in the upper lobe of the lung.
As observed in patient 2, the data-driven curves also show noncyclic motion of the patient, such as is caused by muscle relaxation during the examination. Most of the external sensors are not able to detect such motion. The same holds true for irregular breathing patterns such as those caused by coughing or speaking of the patient, for which the data-driven signal still delivers correct values. We view the use of data-driven motion registration together with list-mode data as an ideal base for correcting PET studies for motion, because we have absolute information about the movement and perfect synchronization of the respiration curve and the list-mode data. On the basis of this information, one can reduce the smearing effect by performing local shifts of the measured events, resulting in a PET study with more precise information about tumor size and activity uptake, such as would be important in therapy control studies, for example. Additionally, one obtains information about maximal and minimal tumor motion, which are important in using PET for radiotherapy planning. Actually, this motion information, because it delivers values over many respiration cycles, is more useful than the information obtained from, for example, 4-dimensional CT, which gives information about only 1 or 2 breathing cycles that do not necessarily correspond to standard respiration cycles of the patient. By using the center-of-mass concept for the CT as well, one can improve the coregistration between PET and CT and perform more appropriate attenuation correction of the PET data, hence improving the quality of the uptake measurement in the tumor.
Another application for data-driven curves is the kinetic PET study. Because the region in which the time–activity curve for the tumor is measured can be shifted according to tumor movement, the risk that the tumor will not be fully included in this region because of motion is reduced.
Visvikis et al. have reported another data-driven method (20). It measures time–activity curves in regions of interest that include a border between an organ with high uptake and one with low uptake. The advantage of this method is the use of physiologic structures for motion registration. On the other hand, this advantage may become a disadvantage when no borders can be found in the PET data. This may be the case especially with new, more specific tracers. For such tracers, the method of detecting the center of mass of the tumor will work even better.
A disadvantage of data-driven methods is the long computing time. On a dual-processor workstation, rebinning of the list-mode data into sinograms requires approximately 7 s per frame. In addition, reconstruction times are about 45 s per frame. For a 10-min list-mode dataset with a sampling time of 500 ms, the result is about 2.5 h of processing time for rebinning and 15 h for reconstructing. Hence, if all the data processing can be done in sinogram space, the whole time is reduced by a factor of 7. However, in sinogram space one can work only with lines of response. But each line of response that is part of the defined VOI includes events from outside the VOI as well, leading to a noisier signal as obtained in the image space.
The method is limited in some applications, because data-driven motion registration will work only if a structure with focal uptake is present. This limitation pertains to applications in which high precision is necessary. One such application is the use of PET data to define the target volume in radiotherapy. In that case, the metabolically active volume of the lesion needs to be determined accurately. Another such application is the use of PET uptake values as a parameter for tumor therapy monitoring. There, positive 18F-FDG signals need to be evaluated without the influence of motion-generated artifacts.
The main goal of the study was to investigate the quality of data-driven motion registration when applied to real patient data. The data presented in this study do not allow derivation of the minimal detectable motion. However, that derivation was beyond the scope of this first feasibility study, and the minimal detectable motion will be determined in the future using phantom experiments.
It is likely that as the spatial resolution of PET scanners improves, motion registration will become even more important, and the proposed method will benefit from higher resolution.
CONCLUSION
In this study, we have shown the feasibility of data-driven motion registration of tumors with focal uptake. This method is possible for periodic motion such as that caused by respiration and for irregular motion due to body movement or coughing. Because the proposed method delivers an absolute value for the amplitude of movement, it may serve as a good basis for various correction algorithms to better quantify tumor size and activity and to better coregister PET and CT.
Acknowledgments
We gratefully acknowledge the excellent technical assistance of Coletta Kruschke, Helga Fernolendt, and Anna Winter from the PET/CT staff. This project was supported in part by a research grant from Siemens Medical Solutions.
Footnotes
-
COPYRIGHT © 2007 by the Society of Nuclear Medicine, Inc.
References
- Received for publication August 2, 2006.
- Accepted for publication October 19, 2006.


Jump to section
Related Articles
Cited By...
- Data-Driven Motion Correction in Clinical PET: A Joint Accomplishment of Creative Academia and Industry
- Improved Alignment of PET and CT Images in Whole-Body PET/CT in Cases of Respiratory Motion During CT
- Data-Driven Gross Patient Motion Detection and Compensation: Implications for Coronary 18F-NaF PET Imaging
- Motion Correction Strategies for Integrated PET/MR
- Value of 4-Dimensional 18F-FDG PET/CT in the Classification of Pulmonary Lesions
- List Mode-Driven Cardiac and Respiratory Gating in PET
- PET/CT Attenuation Correction: Breathing Lessons