
Main menu

  • Home
  • Content
    • Current
    • Ahead of print
    • Past Issues
    • JNM Supplement
    • SNMMI Annual Meeting Abstracts
    • Continuing Education
    • JNM Podcasts
  • Subscriptions
    • Subscribers
    • Institutional and Non-member
    • Rates
    • Journal Claims
    • Corporate & Special Sales
  • Authors
    • Submit to JNM
    • Information for Authors
    • Assignment of Copyright
    • AQARA requirements
  • Info
    • Reviewers
    • Permissions
    • Advertisers
  • About
    • About Us
    • Editorial Board
    • Contact Information
  • More
    • Alerts
    • Feedback
    • Help
    • SNMMI Journals
  • SNMMI
    • JNM
    • JNMT
    • SNMMI Journals
    • SNMMI

User menu

  • Subscribe
  • My alerts
  • Log in
  • Log out
  • My Cart

Search

  • Advanced search
Journal of Nuclear Medicine
  • SNMMI
    • JNM
    • JNMT
    • SNMMI Journals
    • SNMMI
  • Subscribe
  • My alerts
  • Log in
  • Log out
  • My Cart
Journal of Nuclear Medicine

Advanced Search

  • Home
  • Content
    • Current
    • Ahead of print
    • Past Issues
    • JNM Supplement
    • SNMMI Annual Meeting Abstracts
    • Continuing Education
    • JNM Podcasts
  • Subscriptions
    • Subscribers
    • Institutional and Non-member
    • Rates
    • Journal Claims
    • Corporate & Special Sales
  • Authors
    • Submit to JNM
    • Information for Authors
    • Assignment of Copyright
    • AQARA requirements
  • Info
    • Reviewers
    • Permissions
    • Advertisers
  • About
    • About Us
    • Editorial Board
    • Contact Information
  • More
    • Alerts
    • Feedback
    • Help
    • SNMMI Journals
  • View or Listen to JNM Podcast
  • Visit JNM on Facebook
  • Join JNM on LinkedIn
  • Follow JNM on Twitter
  • Subscribe to our RSS feeds
OtherBASIC SCIENCE INVESTIGATIONS

Image-Derived Input Function for Assessment of 18F-FDG Uptake by the Inflamed Lung

Tobias Schroeder, Marcos F. Vidal Melo, Guido Musch, R. Scott Harris, Jose G. Venegas and Tilo Winkler
Journal of Nuclear Medicine November 2007, 48 (11) 1889-1896; DOI: https://doi.org/10.2967/jnumed.107.041079
Tobias Schroeder
  • Find this author on Google Scholar
  • Find this author on PubMed
  • Search for this author on this site
Marcos F. Vidal Melo
  • Find this author on Google Scholar
  • Find this author on PubMed
  • Search for this author on this site
Guido Musch
  • Find this author on Google Scholar
  • Find this author on PubMed
  • Search for this author on this site
R. Scott Harris
  • Find this author on Google Scholar
  • Find this author on PubMed
  • Search for this author on this site
Jose G. Venegas
  • Find this author on Google Scholar
  • Find this author on PubMed
  • Search for this author on this site
Tilo Winkler
  • Find this author on Google Scholar
  • Find this author on PubMed
  • Search for this author on this site
  • Article
  • Figures & Data
  • Info & Metrics
  • PDF
Loading

Article Figures & Data

Figures

  • Tables
  • FIGURE 1. 
    • Download figure
    • Open in new tab
    • Download powerpoint
    FIGURE 1. 

    Iterative algorithm for calculating model-adjusted input function (Embedded Image). Method is based on 2-compartment model. PET signal from blood-pool ROI is separated in blood and activity spillover component by estimating RC and SC. Index [i] refers to number of iterations. CROI(t) = raw PET signal from blood-pool ROI; Embedded Image estimate of plasma activity; Cp(t1) and Cp(t2) = calibration measurements of plasma activity, obtained at times t1 and t2.

  • FIGURE 2. 
    • Download figure
    • Open in new tab
    • Download powerpoint
    FIGURE 2. 

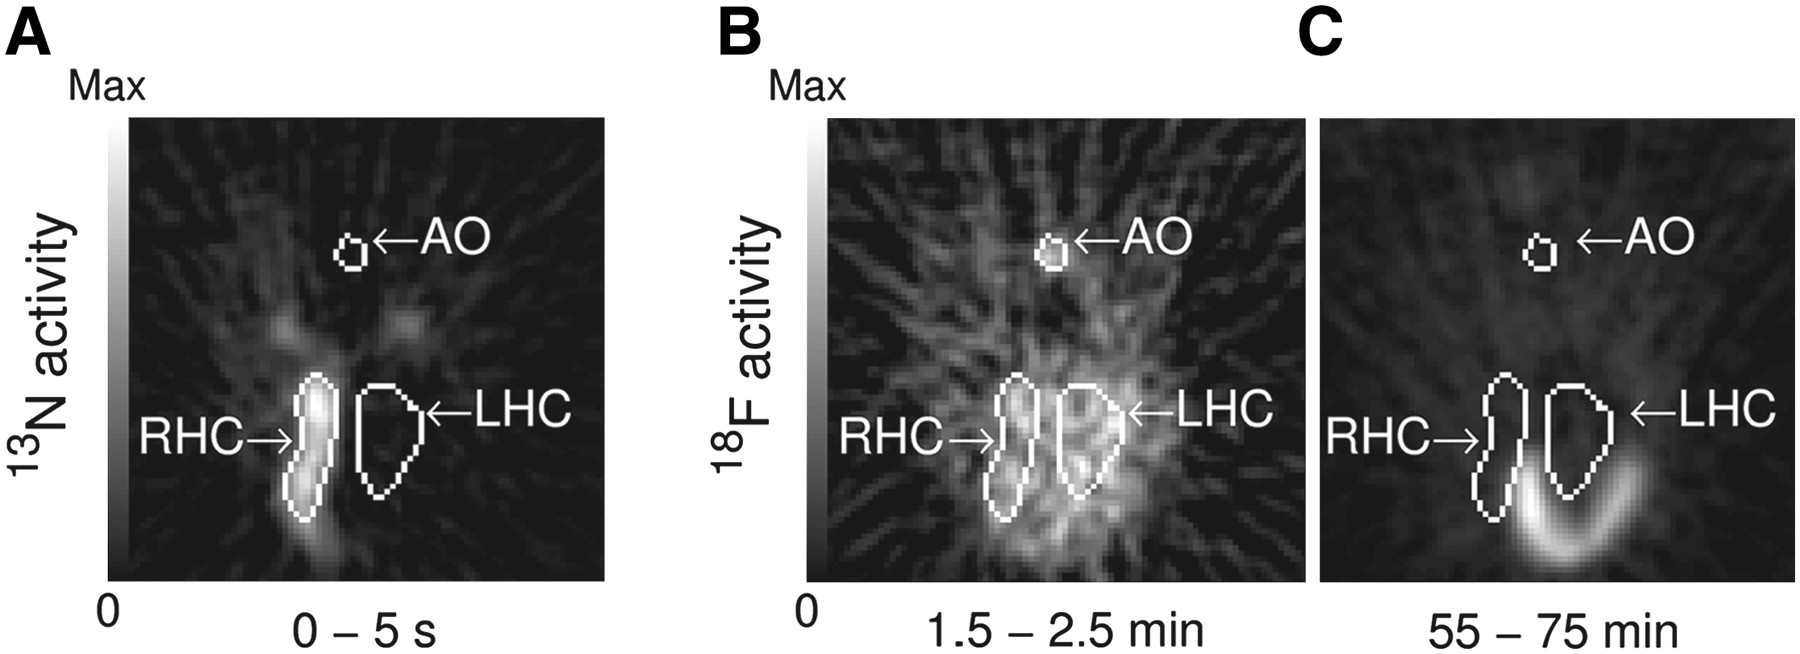
    Delineation (white outlines) of blood-pool ROIs in descending aorta (AO) and in RH cavities (RHC) and LH cavities (LHC) on representative image slice: regional activity after intravenous single-bolus injection of 13N-nitrogen dissolved in saline (A) and 18F-FDG activity, on identical scale, shortly after tracer injection and at end of imaging (B and C, respectively). The 3 ROIs are shown together only for illustration purposes.

  • FIGURE 3. 
    • Download figure
    • Open in new tab
    • Download powerpoint
    FIGURE 3. 

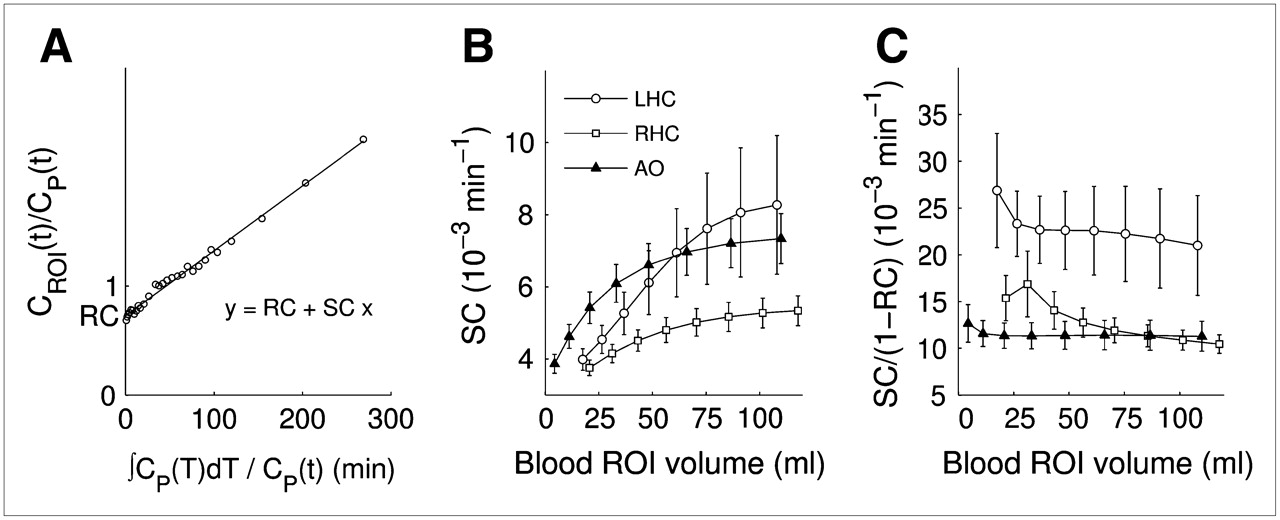
    Evaluation of model fit and effect of ROI volume on estimated parameter SC: representative model fit according to Equation 2 for dynamic PET data measured in blood-pool ROI over LH cavities (A), average SC obtained for blood-pool ROIs of varying size, illustrating how algorithm adjusts SC to different conditions (B); normalized SC/(1 − RC), illustrating differences in 18F-FDG uptake rates (C). Error bars are ±1 × SE. ROIs with lowest volume were used for analyses.

  • FIGURE 4. 
    • Download figure
    • Open in new tab
    • Download powerpoint
    FIGURE 4. 

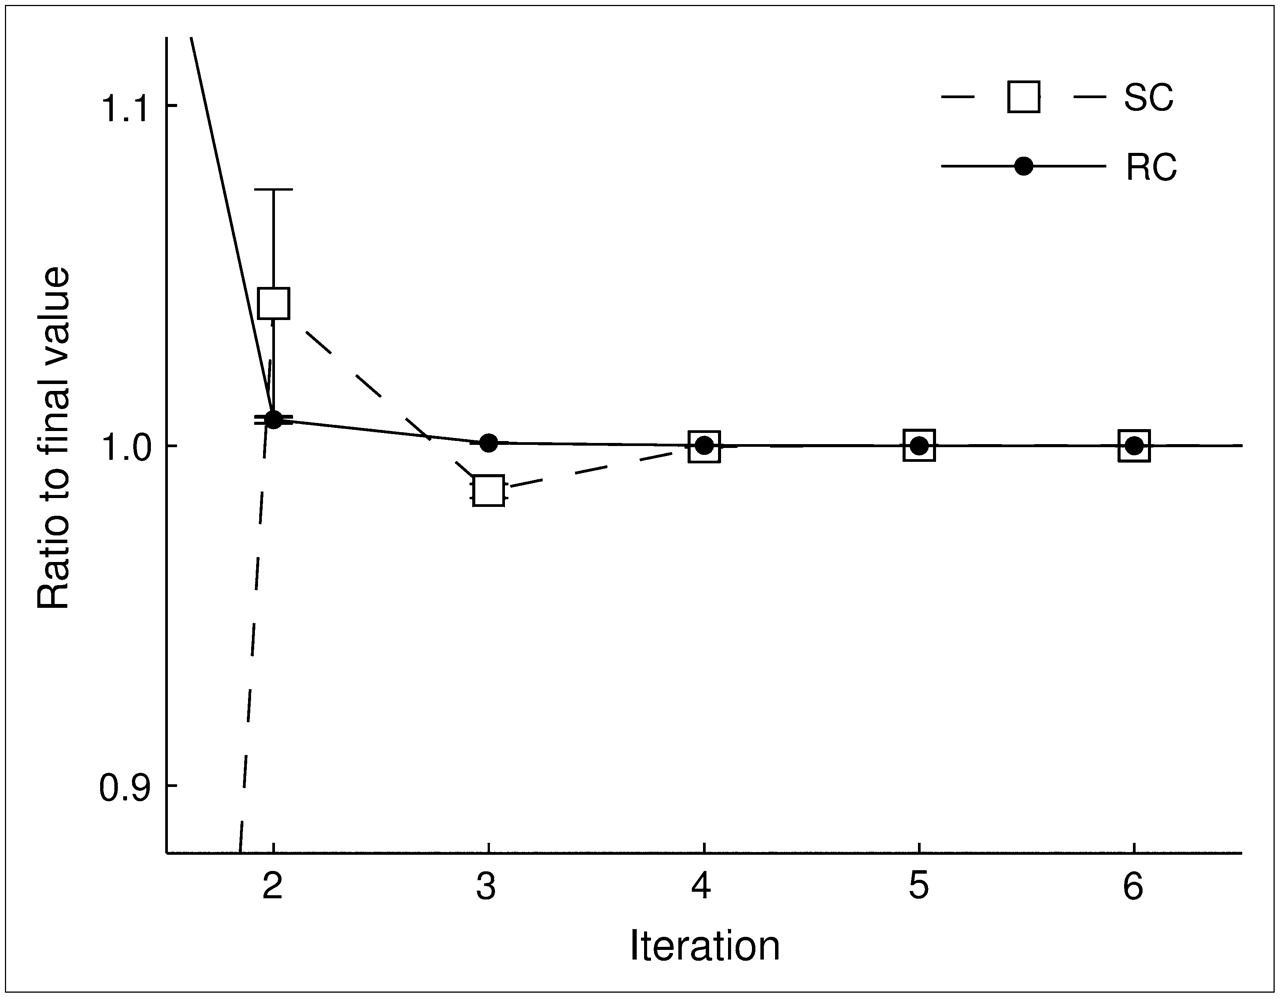
    Convergence of iterative algorithm (Fig. 1) for model parameters RC and SC. Plot was generated for blood-pool ROIs in LH. Error bars are ±1 × SE.

  • FIGURE 5. 
    • Download figure
    • Open in new tab
    • Download powerpoint
    FIGURE 5. 

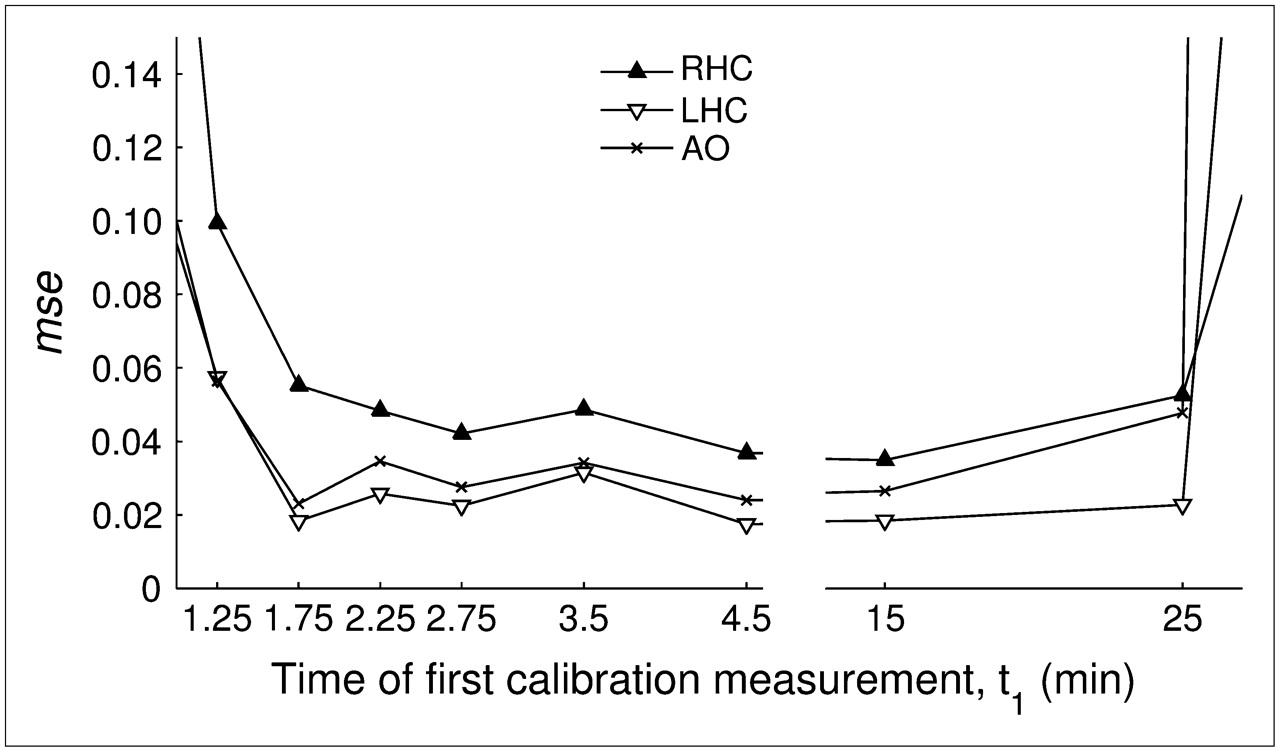
    mse between model-adjusted input function and manually sampled input function as function of time point of first calibration measurement, t1. Plot shows results for blood-pool ROIs in RH and LH cavities (RHC and LHC, respectively) and descending aorta (AO). Values are out of scale for t1 = 0.25 min, t1 = 0.75 min, and t1 > 25 min (not shown).

  • FIGURE 6. 
    • Download figure
    • Open in new tab
    • Download powerpoint
    FIGURE 6. 

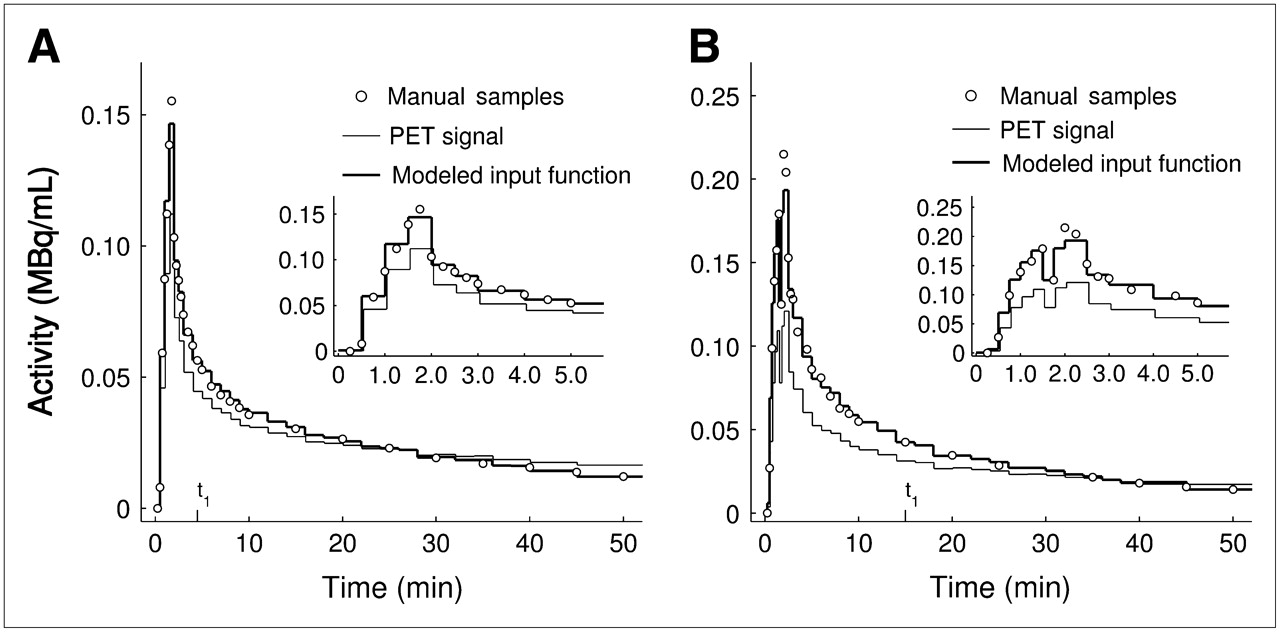
    Comparison of activity in manual blood samples of pulmonary artery plasma, raw PET signal from blood-pool ROI in LH cavities, and model-adjusted input function: example of calibration measurements at t1 = 4.5 min and t2 = 50 min (A); example of longer tracer injection time (90 s instead of 1 min) and shorter initial PET frames (15 s instead of 30 s), with t1 = 15 min and t2 = 50 min (B). Discontinuity during peak was due to delay between end of tracer injection and flush of saline used to remove remaining tracer from infusion system.

  • FIGURE 7. 
    • Download figure
    • Open in new tab
    • Download powerpoint
    FIGURE 7. 

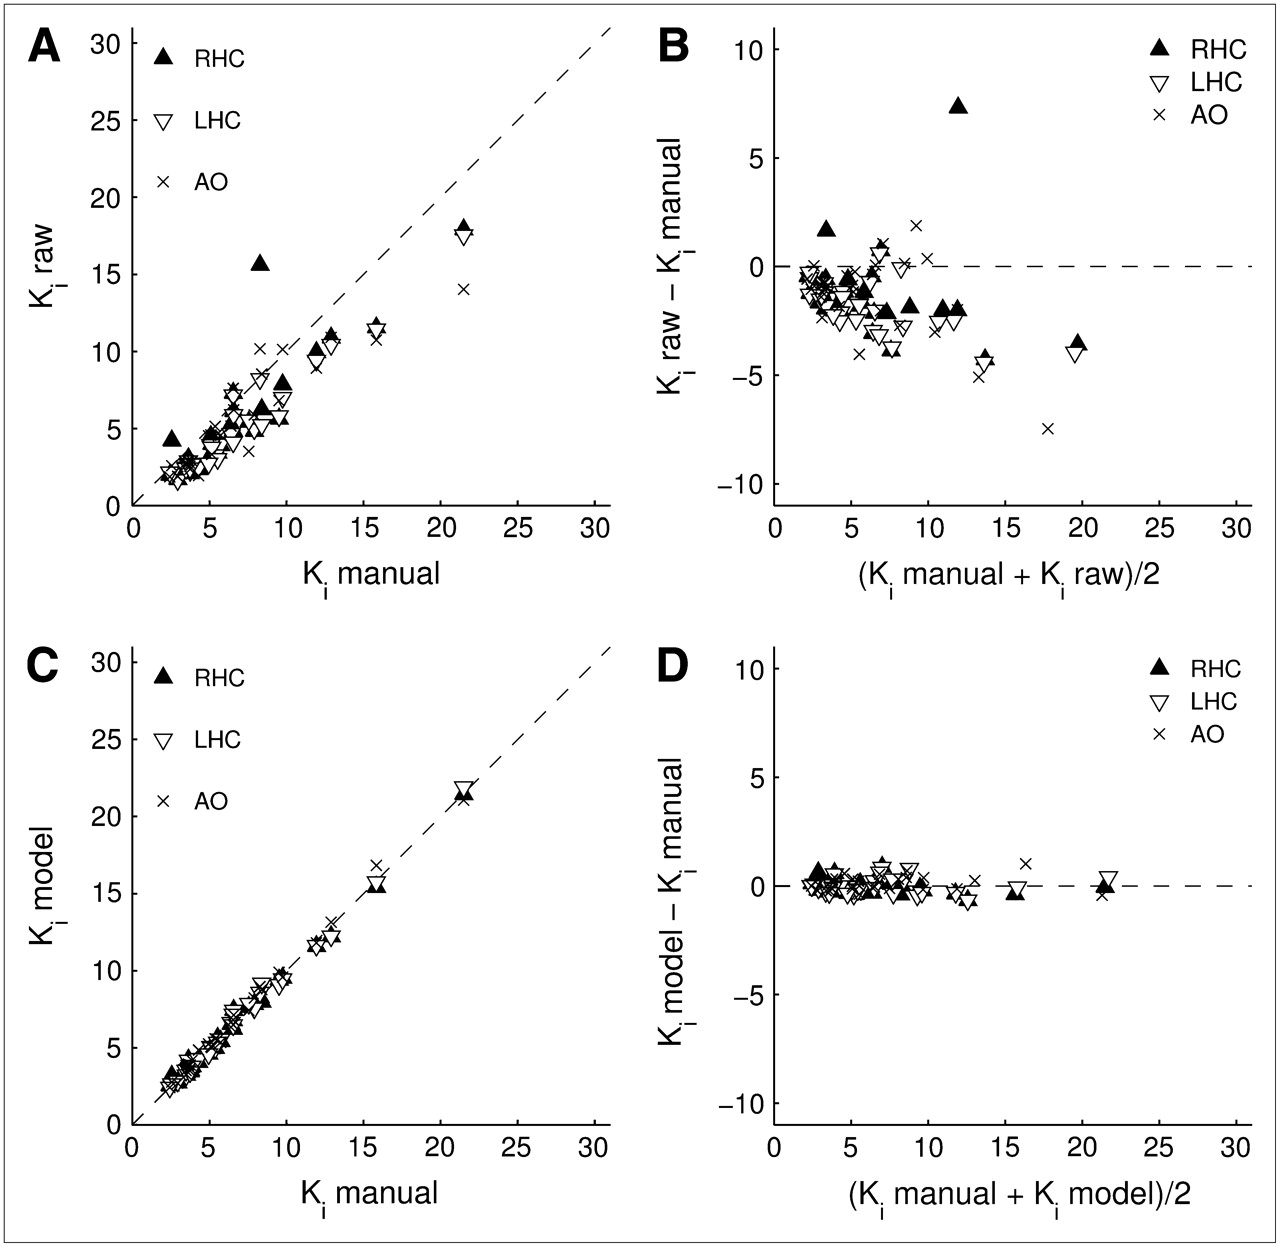
    Evaluation of 18F-FDG uptake rates (Ki) for raw image–derived input functions and for model-adjusted input functions in comparison to Ki values obtained with manual blood sampling. Ki values include exposed and nonexposed lungs and were obtained with input functions from blood-pool ROIs in RH cavities (RHC), LH cavities (LHC), and aorta (AO). Shown are Ki obtained with raw image–derived input functions (A) and corresponding Bland–Altman plot (B), and Ki values calculated with model-adjusted input functions (C) and corresponding Bland–Altman plot (D). All values are in 10−3 mL blood/mL lung/min. Parameters of linear regression analysis are summarized in Table 2.

Tables

  • Figures
    • View popup
    TABLE 1

    Volume of Blood-Pool ROIs and Estimates of Model Parameters RC and SC

    ROIROI volume (mL)RCSC (min−1)
    RH cavities20.6 ± 12.00.69 ± 0.180.0038 ± 0.0009
    LH cavities17.5 ± 8.30.78 ± 0.110.0039 ± 0.0011
    Descending aorta4.4 ± 1.30.64 ± 0.110.0039 ± 0.0011
    • View popup
    TABLE 2

    Regression Analysis of 18F-FDG Uptake Rates (Ki) for Model-Adjusted Input Functions and for Raw Image–Derived Input Functions in Comparison to Manual Blood Sampling (Figs. 7A and 7C)

    Input functionROISlope of regression liney-Intercept of regression lineR2
    Model-adjustedRH cavities0.9790.0650.994
    LH cavities1.003−0.0350.993
    Descending aorta1.0060.0800.994
    Raw image–derivedRH cavities0.839−0.1940.782
    LH cavities0.806−0.4680.945
    Descending aorta0.7120.6360.837
    • R2 = coefficient of determination.

PreviousNext
Back to top

In this issue

Journal of Nuclear Medicine: 48 (11)
Journal of Nuclear Medicine
Vol. 48, Issue 11
November 2007
  • Table of Contents
  • Table of Contents (PDF)
  • About the Cover
  • Index by author
Print
Download PDF
Article Alerts
Sign In to Email Alerts with your Email Address
Email Article

Thank you for your interest in spreading the word on Journal of Nuclear Medicine.

NOTE: We only request your email address so that the person you are recommending the page to knows that you wanted them to see it, and that it is not junk mail. We do not capture any email address.

Enter multiple addresses on separate lines or separate them with commas.
Image-Derived Input Function for Assessment of 18F-FDG Uptake by the Inflamed Lung
(Your Name) has sent you a message from Journal of Nuclear Medicine
(Your Name) thought you would like to see the Journal of Nuclear Medicine web site.
Citation Tools
Image-Derived Input Function for Assessment of 18F-FDG Uptake by the Inflamed Lung
Tobias Schroeder, Marcos F. Vidal Melo, Guido Musch, R. Scott Harris, Jose G. Venegas, Tilo Winkler
Journal of Nuclear Medicine Nov 2007, 48 (11) 1889-1896; DOI: 10.2967/jnumed.107.041079

Citation Manager Formats

  • BibTeX
  • Bookends
  • EasyBib
  • EndNote (tagged)
  • EndNote 8 (xml)
  • Medlars
  • Mendeley
  • Papers
  • RefWorks Tagged
  • Ref Manager
  • RIS
  • Zotero
Share
Image-Derived Input Function for Assessment of 18F-FDG Uptake by the Inflamed Lung
Tobias Schroeder, Marcos F. Vidal Melo, Guido Musch, R. Scott Harris, Jose G. Venegas, Tilo Winkler
Journal of Nuclear Medicine Nov 2007, 48 (11) 1889-1896; DOI: 10.2967/jnumed.107.041079
Twitter logo Facebook logo LinkedIn logo Mendeley logo
  • Tweet Widget
  • Facebook Like
  • Google Plus One
Bookmark this article

Jump to section

  • Article
    • Abstract
    • MATERIALS AND METHODS
    • RESULTS
    • DISCUSSION
    • CONCLUSION
    • Acknowledgments
    • Footnotes
    • References
  • Figures & Data
  • Info & Metrics
  • PDF

Related Articles

  • This Month in JNM
  • PubMed
  • Google Scholar

Cited By...

  • High-Temporal-Resolution Kinetic Modeling of Lung Tumors with Dual-Blood Input Function Using Total-Body Dynamic PET
  • Total-Body Multiparametric PET Quantification of 18F-FDG Delivery and Metabolism in the Study of Coronavirus Disease 2019 Recovery
  • High-Temporal-Resolution Lung Kinetic Modeling Using Total-Body Dynamic PET with Time-Delay and Dispersion Corrections
  • Measurement of PET Quantitative Bias In Vivo
  • Quantification of Lung PET Images: Challenges and Opportunities
  • Reply: 18F-FDG Uptake to Assess Eosinophilic Inflammation in Asthma: Would SUV at Late Imaging Be Relevant?
  • 18F-FDG Uptake Rate Is a Biomarker of Eosinophilic Inflammation and Airway Response in Asthma
  • Google Scholar

More in this TOC Section

  • How Sensitive Is the Upper Gastrointestinal Tract to 90Y Radioembolization? A Histologic and Dosimetric Analysis in a Porcine Model
  • 11C-Methionine PET of Myocardial Inflammation in a Rat Model of Experimental Autoimmune Myocarditis
  • Counting Rate Characteristics and Image Distortion in Preclinical PET Imaging During Radiopharmaceutical Therapy
Show more Basic Science Investigations

Similar Articles

SNMMI

© 2025 SNMMI

Powered by HighWire