
Main menu

  • Home
  • Content
    • Current
    • Ahead of print
    • Past Issues
    • JNM Supplement
    • SNMMI Annual Meeting Abstracts
    • Continuing Education
    • JNM Podcasts
  • Subscriptions
    • Subscribers
    • Institutional and Non-member
    • Rates
    • Journal Claims
    • Corporate & Special Sales
  • Authors
    • Submit to JNM
    • Information for Authors
    • Assignment of Copyright
    • AQARA requirements
  • Info
    • Reviewers
    • Permissions
    • Advertisers
  • About
    • About Us
    • Editorial Board
    • Contact Information
  • More
    • Alerts
    • Feedback
    • Help
    • SNMMI Journals
  • SNMMI
    • JNM
    • JNMT
    • SNMMI Journals
    • SNMMI

User menu

  • Subscribe
  • My alerts
  • Log in
  • Log out
  • My Cart

Search

  • Advanced search
Journal of Nuclear Medicine
  • SNMMI
    • JNM
    • JNMT
    • SNMMI Journals
    • SNMMI
  • Subscribe
  • My alerts
  • Log in
  • Log out
  • My Cart
Journal of Nuclear Medicine

Advanced Search

  • Home
  • Content
    • Current
    • Ahead of print
    • Past Issues
    • JNM Supplement
    • SNMMI Annual Meeting Abstracts
    • Continuing Education
    • JNM Podcasts
  • Subscriptions
    • Subscribers
    • Institutional and Non-member
    • Rates
    • Journal Claims
    • Corporate & Special Sales
  • Authors
    • Submit to JNM
    • Information for Authors
    • Assignment of Copyright
    • AQARA requirements
  • Info
    • Reviewers
    • Permissions
    • Advertisers
  • About
    • About Us
    • Editorial Board
    • Contact Information
  • More
    • Alerts
    • Feedback
    • Help
    • SNMMI Journals
  • View or Listen to JNM Podcast
  • Visit JNM on Facebook
  • Join JNM on LinkedIn
  • Follow JNM on Twitter
  • Subscribe to our RSS feeds
OtherBASIC SCIENCE INVESTIGATIONS

Troponin I Overexpression Inhibits Tumor Growth, Perfusion, and Vascularization of Morris Hepatoma

Kerstin Schmidt, Johannes Hoffend, Annette Altmann, Fabian Kiessling, Ludwig Strauss, Dirk Koczan, Walter Mier, Michael Eisenhut, Ralf Kinscherf and Uwe Haberkorn
Journal of Nuclear Medicine September 2006, 47 (9) 1506-1514;
Kerstin Schmidt
  • Find this author on Google Scholar
  • Find this author on PubMed
  • Search for this author on this site
Johannes Hoffend
  • Find this author on Google Scholar
  • Find this author on PubMed
  • Search for this author on this site
Annette Altmann
  • Find this author on Google Scholar
  • Find this author on PubMed
  • Search for this author on this site
Fabian Kiessling
  • Find this author on Google Scholar
  • Find this author on PubMed
  • Search for this author on this site
Ludwig Strauss
  • Find this author on Google Scholar
  • Find this author on PubMed
  • Search for this author on this site
Dirk Koczan
  • Find this author on Google Scholar
  • Find this author on PubMed
  • Search for this author on this site
Walter Mier
  • Find this author on Google Scholar
  • Find this author on PubMed
  • Search for this author on this site
Michael Eisenhut
  • Find this author on Google Scholar
  • Find this author on PubMed
  • Search for this author on this site
Ralf Kinscherf
  • Find this author on Google Scholar
  • Find this author on PubMed
  • Search for this author on this site
Uwe Haberkorn
  • Find this author on Google Scholar
  • Find this author on PubMed
  • Search for this author on this site
  • Article
  • Figures & Data
  • Info & Metrics
  • PDF
Loading

Article Figures & Data

Figures

  • Tables
  • FIGURE 1. 
    • Download figure
    • Open in new tab
    • Download powerpoint
    FIGURE 1. 

    Expression of TnI in clones of MH3924A. (A) Northern blot. (B) Western blot. Representative blots are shown. α-Tubulin or β-actin was used as internal control. bp = base pairs.

  • FIGURE 2. 
    • Download figure
    • Open in new tab
    • Download powerpoint
    FIGURE 2. 

    Proliferation and apoptosis of HUVECs cocultured with WT-MH3924A or TnI-MH3924A cells. (A) Proliferation. (B) Apoptosis. Values are mean ± SEM. *P < 0.05 vs. WT-MH3924A.

  • FIGURE 3. 
    • Download figure
    • Open in new tab
    • Download powerpoint
    FIGURE 3. 

    Tumor growth of WT-MH3924A and TnI-MH3924 tumors until 40 d after inoculation. Values are mean ± SEM. ***P < 0.001; **P < 0.01; *P < 0.05 vs. WT-MH3924A.

  • FIGURE 4. 
    • Download figure
    • Open in new tab
    • Download powerpoint
    FIGURE 4. 

    H215O PET. Representative images and time–activity curves measured in WT-MH3924A (A and C) and TnI-MH3924A (B and D) tumor; 2-dimensional acquisition. Results of modeling analysis are shown in Table 2. T = tumor.
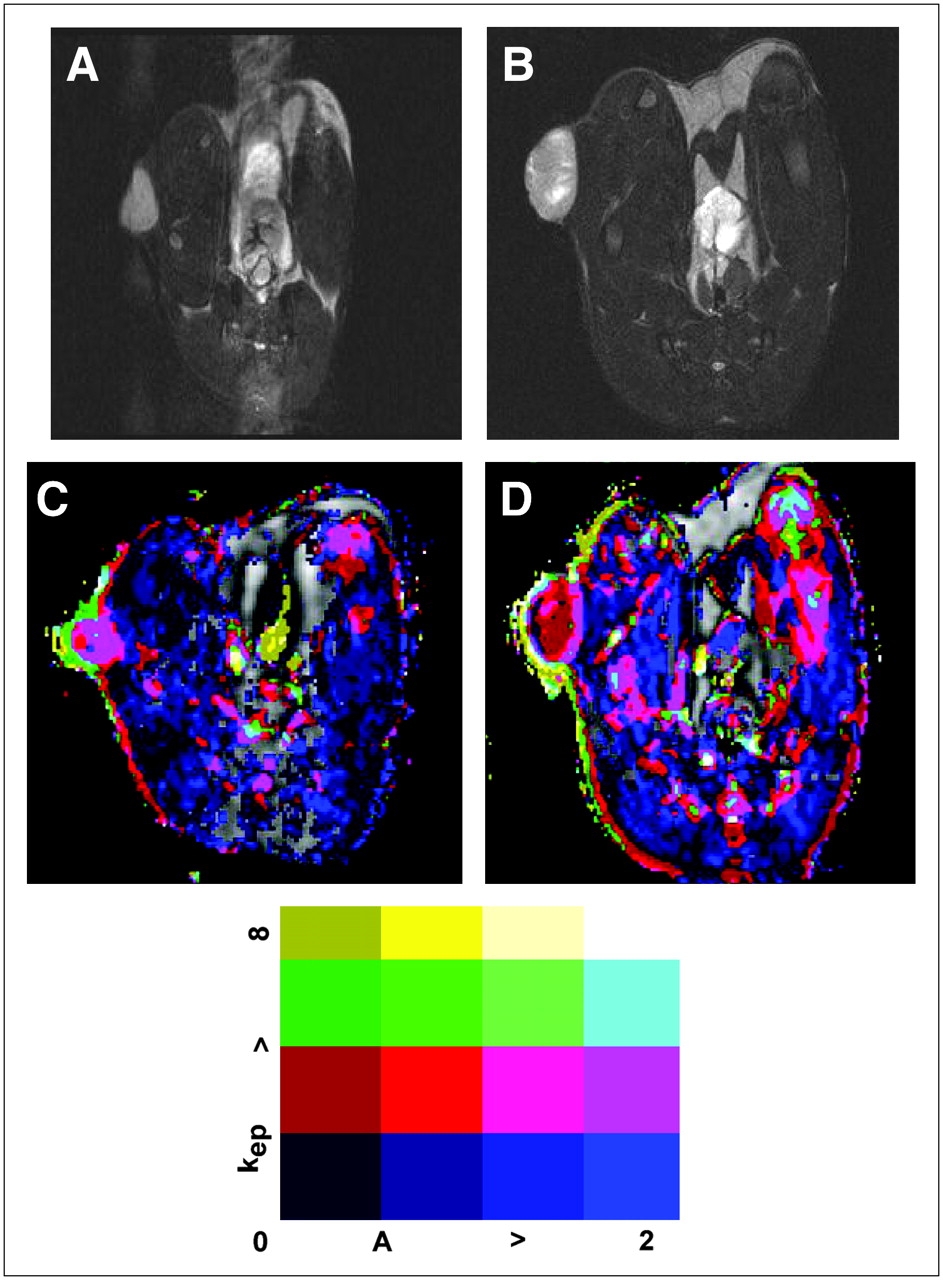
  • FIGURE 5. 
    • Download figure
    • Open in new tab
    • Download powerpoint
    FIGURE 5. 

    Functional MRI. Representative T2-weighted images of WT-MH3924A (A) and TnI-MH3924A (B) tumor. Corresponding parametric images for A and kep are shown in C and D. Range of signal intensity for kep and A is indicated at bottom.

Tables

  • Figures
    • View popup
    TABLE 1

    Histochemical Analyses of Morris Hepatomas Transplanted into ACI Rats: Apoptosis, Proliferation, Oxidative Stress, and Inflammatory Cells

    ParameterWT-MH3924ATnI-MH3924AP
    H215O PET
     K1 (mL·mL tissue−1·min−1)0.43 ± 0.040.32 ± 0.050.14
     k2 (1/min)0.73 ± 0.090.25 ± 0.070.002
     DV (mL/mL tissue)0.65 ± 0.111.69 ± 0.400.022
     VB (mL·mL−1)0.02 ± 0.010.016 ± 0.0070.94
     68Ga-Albumin uptake (SUV)0.48 ± 0.140.47 ± 0.090.91
    Functional MR amplitude
     Total0.84 ± 0.110.78 ± 0.120.75
     Center0.42 ± 0.090.49 ± 0.100.63
     Periphery1.12 ± 0.091.01 ± 0.170.58
     Muscle0.30 ± 0.070.37 ± 0.070.41
    Functional MR kep
     Total9.19 ± 0.714.82 ± 0.790.003
     Center3.42 ± 1.893.51 ± 1.220.95
     Periphery12.29 ± 1.075.89 ± 1.340.006
     Muscle2.65 ± 0.223.35 ± 1.040.56
    • Values are expressed as mean ± SD (n = 6).

    • View popup
    TABLE 2

    H215O PET, 68Ga-DOTA-Albumin PET, and T1-Weighted DCE MRI

    ParameterWT-MH3924ATnI-MH3924AP
    H215O PET
     K1 (mL·mL tissue−1·min−1)0.43 ± 0.040.32 ± 0.050.14
     k2 (1/min)0.73 ± 0.090.25 ± 0.070.002
     DV (mL/mL tissue)0.65 ± 0.111.69 ± 0.400.022
     VB (mL·mL−1)0.02 ± 0.010.016 ± 0.0070.94
     68Ga-Albumin uptake (SUV)0.48 ± 0.140.47 ± 0.090.91
    Functional MR amplitude
     Total0.84 ± 0.110.78 ± 0.120.75
     Center0.42 ± 0.090.49 ± 0.100.63
     Periphery1.12 ± 0.091.01 ± 0.170.58
     Muscle0.30 ± 0.070.37 ± 0.070.41
    Functional MR kep
     Total9.19 ± 0.714.82 ± 0.790.003
     Center3.42 ± 1.893.51 ± 1.220.95
     Periphery12.29 ± 1.075.89 ± 1.340.006
     Muscle2.65 ± 0.223.35 ± 1.040.56
    • Tumor perfusion, blood volume, amplitude, and kep were measured in WT-MH3924A (n = 5) and TnI-MH3924A (n = 6) tumors of ACI rats. Skeletal muscle tissue was used as control in MRI studies. Values are expressed as mean ± SD.

    • View popup
    TABLE 3

    Changes in Gene Expression in Genetically Modified TnI-Expressing Hepatomas

    GeneTumor ratioCell ratio
    Angiogenesis associated
     Mast cell protease 1059.820.73
     Vascular chymase11.460.55
     Mast cell protease 8 precursor9.681.27
     Mast cell protease 35.290.68
     VEGF-D3.313.2
     FGF2.740.44
    Apoptosis associated
     Leukocyte common antigen receptor (LAR)6.871.22
     Leukocyte common antigen-related protein2.560.45
     ICE-like cysteine protease (Lice)2.550.6
     A2b-adenosine receptor2.490.81
    Signal transduction and stress
     Glutathione S-transferase8.471.81
     Prolactin6.891
     2′,5′-Oligoadenylate synthetase6.680.48
     Menkes protein6.490.42
     C kinase substrate calmodulin-binding protein5.70.99
     High-affinity IgE receptor (Fc-ε-R-I)5.662.78
     cAMP-regulated phosphoprotein5.032.63
     PPAR-γ4.241.15
     Cholecystokinin-A receptor3.491.72
     Liver microsomal retinol dehydrogenase type I3.190.69
     Nicotinic acetylcholine receptor α-33.161.08
     Extracellular calcium-sensing receptor3.140.53
     Megalin3.060.8
      γ-Crystallin D type3.030.75
     Glycolipid-anchored form of acetylcholinesterase2.881.14
     CCA32.851.22
     Regeneration-associated serpin protein-1 (rasp-1)2.760.9
     Cytochrome P-450b2.760.82
     Retinol dehydrogenase type II2.511.33
     Prepro-complement C32.470.19
     Calcium-activated potassium channel β-subunit2.41.85
     Guanylin2.330.79
     cAMP protein kinase regulatory subunit2.330.45
     Hsp70-32.31.08
     GABA-B receptor gb22.290.83
     Na+,K+-ATPase (EC 3.6.1.3) α2 subunit2.260.64
     Anaphylatoxin C3a receptor2.232.34
     Granzyme-like protein III2.220.64
     GABA-A receptor δ-subunit2.211.5
     T-cell receptor α-chain2.170.65
     Insulin receptor (IRS-1)2.020.48
    • VEGF-D = vascular endothelial growth factor-D; FGF = fibroblast growth factor; ICE = interleukin 1β converting enzyme; cAMP = cyclic adenosine monophosphate; PPAR-γ = peroxisome proliferator-activated receptor γ; CCA3 = confluent 3Y1 cell-associated 3; Hsp70-3 = heat shock protein 70-3; GABA-B = γ-aminobutyric acid receptor B; GABA-A = γ-aminobutyric acid receptor A.

PreviousNext
Back to top

In this issue

Journal of Nuclear Medicine: 47 (9)
Journal of Nuclear Medicine
Vol. 47, Issue 9
September 2006
  • Table of Contents
  • Table of Contents (PDF)
  • About the Cover
  • Index by author
Print
Download PDF
Article Alerts
Sign In to Email Alerts with your Email Address
Email Article

Thank you for your interest in spreading the word on Journal of Nuclear Medicine.

NOTE: We only request your email address so that the person you are recommending the page to knows that you wanted them to see it, and that it is not junk mail. We do not capture any email address.

Enter multiple addresses on separate lines or separate them with commas.
Troponin I Overexpression Inhibits Tumor Growth, Perfusion, and Vascularization of Morris Hepatoma
(Your Name) has sent you a message from Journal of Nuclear Medicine
(Your Name) thought you would like to see the Journal of Nuclear Medicine web site.
Citation Tools
Troponin I Overexpression Inhibits Tumor Growth, Perfusion, and Vascularization of Morris Hepatoma
Kerstin Schmidt, Johannes Hoffend, Annette Altmann, Fabian Kiessling, Ludwig Strauss, Dirk Koczan, Walter Mier, Michael Eisenhut, Ralf Kinscherf, Uwe Haberkorn
Journal of Nuclear Medicine Sep 2006, 47 (9) 1506-1514;

Citation Manager Formats

  • BibTeX
  • Bookends
  • EasyBib
  • EndNote (tagged)
  • EndNote 8 (xml)
  • Medlars
  • Mendeley
  • Papers
  • RefWorks Tagged
  • Ref Manager
  • RIS
  • Zotero
Share
Troponin I Overexpression Inhibits Tumor Growth, Perfusion, and Vascularization of Morris Hepatoma
Kerstin Schmidt, Johannes Hoffend, Annette Altmann, Fabian Kiessling, Ludwig Strauss, Dirk Koczan, Walter Mier, Michael Eisenhut, Ralf Kinscherf, Uwe Haberkorn
Journal of Nuclear Medicine Sep 2006, 47 (9) 1506-1514;
Twitter logo Facebook logo LinkedIn logo Mendeley logo
  • Tweet Widget
  • Facebook Like
  • Google Plus One
Bookmark this article

Jump to section

  • Article
    • Abstract
    • MATERIALS AND METHODS
    • RESULTS
    • DISCUSSION
    • CONCLUSION
    • Acknowledgments
    • Footnotes
    • References
  • Figures & Data
  • Info & Metrics
  • PDF

Related Articles

  • This Month in JNM
  • PubMed
  • Google Scholar

Cited By...

  • No citing articles found.
  • Google Scholar

More in this TOC Section

  • 11C-Methionine PET of Myocardial Inflammation in a Rat Model of Experimental Autoimmune Myocarditis
  • Counting Rate Characteristics and Image Distortion in Preclinical PET Imaging During Radiopharmaceutical Therapy
  • Design and Fabrication of Kidney Phantoms for Internal Radiation Dosimetry Using 3D Printing Technology
Show more Basic Science Investigations

Similar Articles

SNMMI

© 2025 SNMMI

Powered by HighWire