


Abstract
Antiangiogenic gene transfer inhibiting growth of new blood vessels is a promising approach in cancer therapy. Human troponin I (TnI) efficiently inhibits endothelial cell proliferation, migration, as well as angiogenesis and tumor growth in vivo. However, little is known about its effects on perfusion and tumor biology. Methods: Stable Morris hepatoma (MH3924A) cells overexpressing human TnI (TnI-MH3924A) were cocultured with human umbilical vein endothelial cells (HUVECs) followed by measurements of endothelial apoptosis and proliferation. Furthermore, tumor growth and perfusion were determined using H215O and 68Ga-DOTA-albumin (DOTA is 1,4,7,10-tetraazacyclododecane-N,N′,N′′,N′′′-tetraacetic acid) PET as well as functional MRI. Additionally, histologic measurements of vascularization, apoptosis, proliferation, and gene array analyses were performed. Results: Apoptosis of HUVECs was increased and proliferation was decreased after coculture with TnI-MH3924A cells. TnI-MH3924A tumors showed a significant inhibition of growth (90%) and a decreased perfusion (25%), whereas blood volume remained unchanged. MRI investigations demonstrated a significant decrease of the rate constant kep. Immunohistochemical analyses showed decreased microvessel density and proliferation and significant induction of apoptosis. Furthermore, TnI-expressing hepatomas demonstrated changes in the expression of genes related to angiogenesis, apoptosis, signal transduction, or stress. Conclusion: TnI regulates tumor growth by modulating vascularization including apoptosis induction and decrease of proliferation. In addition, changes in expression of genes associated with angiogenesis, apoptosis, signal transduction, or stress were found. The upregulation of angiogenesis and stress-related genes indicates a cross-talk of different mechanisms as part of the tumor's reaction to TnI. Because the decrease of vascularization led to lower perfusion values as measured by PET and MRI, these noninvasive methods are promising tools for the monitoring of antiangiogenic gene therapy.
Because tumor growth depends on angiogenesis, application of antiangiogenic agents targeting vascular endothelium should be effective in a broad variety of tumors and prevent drug resistance by acting on genetically stable endothelial cells. Several antiangiogenic agents have been successfully used in preclinical models and clinical studies (1). One of these agents is troponin I (TnI), isolated from cartilage, which has been shown to be an efficient endogenous inhibitor of endothelial cell proliferation and migration in vitro but also inhibits angiogenesis, tumor growth, and metastasis in vivo (2,3). Despite convincing evidence of its efficacy, little is known about the multifactorial mechanism of action of TnI (3,4). Thus, monitoring of antiangiogenic approaches with functional imaging and histomorphometric analyses are desirable to deliver information about physiologic effects caused by this therapeutic modality.
PET, using H215O, provides a quantitative measure of tissue perfusion—that is, blood flow and blood volume in tumors as well as the efflux of tracer from tumor tissue in the vascular space—and thereby provides functional relevant data of angiogenesis. Using 68Ga-DOTA-albumin (DOTA is 1,4,7,10-tetraazacyclododecane-N,N′,N′′,N′′′-tetraacetic acid) PET, it is possible to measure tumor blood pool (5). MRI is a further tool of monitoring vascularization in carcinoma (6). Our aim was to investigate the effects of TnI gene transfer on endothelial cell apoptosis/proliferation in vitro, as well as on tumor growth, perfusion, vascularization, apoptosis/proliferation, and gene expression in vivo.
MATERIALS AND METHODS
Cell Culture and Generation of Recombinant Cells
MH3924A cells were cultured (37°C, 95% air/5% CO2) in RPMI 1640 medium (Gibco BRL) supplemented with 292 mg/L glutamine and 20% fetal calf serum (FCS).
TnI Gene Transfer, Northern Blots, and Western Blots
Stable cell lines were generated after lipofection of MH3924A cells with a human TnI2 (pGT60hTNNI2; InvivoGen) expression vector by hygromycin selection (425 μg/mL) for 4 wk. RNA was isolated using Trizol reagent (Roche), and messenger RNA (mRNA) content was assessed by Northern blots using radioactive labeled probes for TnI and β-actin. Secretion of TnI protein into cell culture media was verified by Western blots. For this purpose conditioned medium was produced by culture of 106 transfected MH3924A cells in Optimem medium (Life Technologies) for 48 h. TnI protein was purified by ammonium sulfate precipitation. After gel electrophoresis, protein was blotted to a polyvinylidene difluoride membrane (Bio-Rad Laboratories) and immunostained using monoclonal mouse anti-TnI (2 μg/mL; Acris) antibodies and ECL Western blotting detection reagent (Amersham Biosciences).
Measurement of Apoptotic/Proliferating Cells
Human umbilical vein endothelial cells (HUVECs) were isolated as described (7,8) and cultured in M199 medium supplemented with 4 ng/mL basic fibroblast growth factor, 20% FCS, 292 mg/L glutamine, 100,000 IE/L penicillin, and 100 mg/L streptomycin. After 3 d of coculture with wild-type (WT) or TnI-MH3924A in a “without-contact” system (pore size, 3 μm; BD Biosciences), proliferation of HUVECs was determined by methyl-3H-thymidine (3H-TdR) (Amersham-Buchler) incorporation after precipitation with 0.5 mol/L perchloric acid/1 mol/L NaOH, and apoptosis was measured in unfixed cells by YO-PRO-1 staining as described earlier (9). Coculture experiments were done in triplicate in 2 independent experiments.
Animal Studies
All animal studies were performed in compliance with the national laws relating to the conduct of animal experimentation. The in vitro doubling time of the cell lines was 16.95 h for WT-MH3924A and 18.7 h for hTnI-MH3924A cells. After subcutaneous inoculation of WT or TnI cells (2 × 10⁶ cells/animal) into the right thigh of ACI or RNU rats (Charles River Laboratories), tumor growth was measured using calipers.
Perfusion and blood volume in tumors with diameters between 10 and 13 mm (8−19 d after transplantation for WT-MH3924A [11.85 ± 3.62 d; median, 10 d] and 14−28 d for TnI-MH3924A [19.83 ± 5.26 d; median, 21 d]) were examined after intravenous bolus injection of 70−150 MBq H215O in 0.3 mL and 5−10 MBq 68Ga-labeled albumin (same animals and session; albumin PET scan performed after the activity of H215O decayed). The size of tumors showed no statistically significant difference between the 2 tumor types with 660.5 ± 199.4 μL (mean ± SEM; range, 448.7−904.3 μL; median, 523.4 μL) for WT-MH3924A and 717.5 ± 115.6 μL (mean ± SEM; range, 605.8−904.3 μL; median, 696.5 μL). All PET studies were done as dynamic measurements (20 × 3 s, 6 × 10 s, 4 × 15 s, 6 × 30 s [15O-labeled water] and 12 × 10 s, 3 × 20 s, 4 × 30 s, 10 × 60 s [68Ga-DOTA-albumin]) in 2-dimensional mode using a matrix of 256 × 256 on an ECAT HR+ (Siemens/CTI) scanner (pixel size, 2.277 × 2.777 × 2.425 mm; transaxial resolution, 4.3 mm). A transmission scan was done for 10 min before tracer administration with 3 rotating germanium pin sources to obtain cross-sections for attenuation correction. After iterative reconstruction with the space-alternating generalized expectation maximization method ([SAGE] 0 subsets, 20 iterations) applying median root prior correction, the dynamic PET data were evaluated after definition of volumes of interest (VOIs) as described earlier using the PMOD software package (7). Time–activity curves were created using VOIs, which consist of several regions of interest (ROIs) over the target area. For the input function, we determined the mean value of the VOI data obtained from the heart. ROIs were defined at 3−6 s after bolus injection in at least 3 consecutive slices (2.4-mm thickness) surrounded by 2 slices showing the heart in each direction. The ROI size (mean ± SEM) for the input function was 59.6 ± 25.1 voxels (WT-MH3924A) and 54.8 ± 24.9 voxels (TnI-MH3924A) (P = 0.63); the ROI size for the tumors was 52.4 ± 23.3 voxels (WT-MH3924A) and 61.0 ± 34.4 voxels (TnI-MH3924A) (P = 0.71). This approach was based on the findings of Ohtake et al., who demonstrated that the input function can be retrieved from image data with acceptable accuracy (10). Heart weight and heart volume of a 250-g rat are 1.0 g and 1.2 mL, respectively (11). Furthermore, the size of the heart was determined in the rats showing a median value of 795 μL (range, 605–904 μL). This results in an estimated recovery error of 10%, which can be neglected for the purposes of this study. The 68Ga-DOTA-albumin uptake was expressed as the mean standardized uptake value (SUV) between 10 and 15 min after injection when the time–activity curve reaches a plateau (8).
In a further experiment an additional group of ACI rats bearing WT- (n = 5) or TnI- (n = 6) expressing hepatomas was examined by dynamic contrast-enhanced (DCE) MRI. Gadolinium-diethylenetriaminepentaacetic acid (Gd-DTPA; Omniscan, Nycomed GmbH), diluted in 0.9% NaCl (total volume, 600 μL), was used in a dosage of 0.1 mmol/kg and injected into the tail vein as a bolus within 5 s after the fourth measurement. MRI investigations were performed on a 1.5-T whole-body MRI system (Magnetom Vision; Siemens) using a custom-made radiofrequency coil for radiofrequency excitation and signal reception (6). To optimize the available signal-to-noise ratio, manual tuning and matching of the coil's resonance circuitry were performed individually for each animal. Animals were examined with transversal T1-weighted and T2-weighted pulse sequences followed by the T1-weighted DCE MRI scan. T1-weighted spin-echo MRI was performed using the following parameters: repetition time (TR) = 600 ms, echo time (TE) = 14 ms, 1 acquisition, acquisition time (TA) = 3 min 53 s, field of view = 50 × 37.5 mm, matrix = 128 × 106, slice thickness = 1 mm, resulting voxel size = 1.0 × 0.39 × 0.35 mm3; parameters of the transversal T2-weighted turbo spin-echo sequence were TR = 4,000 ms, TE = 96 ms, 1 acquisition, echo train length = 7, TA = 1 min 49 s, field of view = 50 × 37.5 mm, matrix = 140 × 256, slice thickness = 2 mm, voxel size = 2.0 × 0.36 × 0.15 mm3. T1-weighted DCE MRI was conducted with a gradient-echo sequence (FLASH): TR = 100 ms, TE = 6.5 ms, flip angle α = 90°, 1 acquisition, TA = 8 s, field of view = 50 × 37.5 mm, matrix = 64 × 48, slice thickness = 2 mm, resulting voxel size = 2.0 × 0.78 × 0.78 mm3. Six transversal slices were placed, 4 covering the tumor and 2 at the position of the kidneys. Sixty measurements were performed during a measurement time of 8 min (6).
Analysis of dynamic data containing the amplitude (A) and the exchange rate constant (kep) was based on a pharmacokinetic 2-compartment model (12). The signal–time curve was fitted using a Levenberg–Marquart algorithm. Amplitude (A) and the kep value were calculated for each pixel of the MR images. Exchange of infused contrast agent between the first compartment representing the intravascular space and the second compartment representing the extravascular extracellular space is described by the rate constant kep, which depends on perfusion and vessel permeability. The parameter amplitude (A) represents the relative change of signal intensity after contrast media injection and is physiologically a parameter of tissue blood and interstitial volume. ROIs were drawn manually covering the complete tumor at its maximum extension. To obtain precise local tumor perfusion data, additional ROIs were determined in the tumor center and in the periphery at the tumor base (6). Color-coded parameter maps of A and kep values were calculated and overlaid on morphologic T1-weighted MR images.
Tissue Preparation and Immunohistochemistry
To obtain quantitative data on tissue properties, which may influence tumor perfusion, an immunohistochemistry analysis of proliferation, apoptosis, necrosis, immune reactions, and vessel density was done. Tumors obtained from the animals immediately after the PET perfusion studies were fixed with IHC zinc fixative (BD Biosciences), 4% paraformaldehyde (and embedded in paraffin), or shock-frozen in liquid nitrogen–cooled isopentane, and kept in a freezer at −70°C. Immunohistochemistry of tumors was performed on 6-μm cryostat sections according to procedures as described (7–9). For immunohistochemical investigations, the monoclonal antibodies mouse anti-α-actin (1:100; Roche), mouse antirat-CD31 (1:500; BD Bisosciences), mouse antiproliferating cell nuclear antigen ([PCNA] 1:500; DakoCytomation), mouse antirat CD11b (1:500; BD Biosciences), rabbit antimouse-cyclooxygenase-2 ([COX-2] 1:300; Cayman Chemical Co.), monoclonal mouse antip53 (1:50; Roche), and mouse antihuman-macrophage migration inhibitory factor (MIF) (1:50; R&D Systems GmbH) were applied. Negative controls were performed using control immunoglobulin or omission of the primary antibody.
Apoptosis was measured on cross-sections of paraffin-embedded tumors by the TUNEL (terminal deoxynucleotidyl transferase-mediated dUTP nick-end labeling) technique using a commercial kit (Oncor).
Morphometric Analysis
Immunoreactive cells were recorded by video camera (Olympus HCC-3600 P high gain) and quantified using a computer-assisted image analysis system (VIBAM 0.0-VFG 1-frame grabber) as described earlier (7). For quantifying tumor vascularization, we measured microvessel density and the mean number of vessels in angiogenic hot spots (7). Morphometric analyses were performed twice by 2 independent observers (interobserver variability, <5%). Cell density (number/mm2) or percentage of positive cells was quantified by analyzing 5 ROIs. Immunoreactive areas were quantified by analyzing 5 hot spots per tumor.
Gene Arrays
Aliquots of WT- and TnI-MH3924A tumors (excised immediately after the PET perfusion studies) obtained from the tumor periphery were mashed in Trizol to extract RNA as described (7,8). Furthermore, mRNA extraction was done from the WT- and TnI-expressing cell line. Gene chip expression arrays were performed using The Rat Genome U34 Set (Affimetrix Inc.). RNAs of WT- (n = 6) and TnI-MH3924A (n = 3) tumors were pooled and evaluated on separate gene chips as described (7,8). After normalizing values to β-actin expression, ratios of genetically modified versus WT tumors were calculated. Ratios of modified tumors versus WT tumors were determined and values above 2 and below 0.5 were interpreted as significant. The complete experiment was repeated twice, revealing a high correlation of signals in both experiments (r = 0.99 [tumor]; r = 0.96 [cells]).
Statistical Methods
Results are presented as mean ± SEM. Statistical analyses were performed by the Mann–Whitney U test using the SIGMASTAT program (Jandel Scientific). P ≤ 0.05 was considered statistically significant.
RESULTS
Inhibition of Proliferation and Induction of Apoptosis in Coculture Experiments with HUVECs
To verify TnI expression, Northern and Western blots were performed showing increased TnI mRNA content in transfected MH3924A cells (Fig. 1A). In addition, a protein with a molecular weight of 18 kDa was identified in cell culture medium of TnI-expressing cells (Fig. 1B).

Expression of TnI in clones of MH3924A. (A) Northern blot. (B) Western blot. Representative blots are shown. α-Tubulin or β-actin was used as internal control. bp = base pairs.
After incubation with 3H-TdR and perchloric acid extraction, HUVECs cocultured with WT-MH3924A revealed a 30% increase in proliferation in comparison with HUVECs cultured alone. Coculture of HUVECs with TnI-MH3924A cells significantly decreased endothelial cell proliferation by 30% compared with coculture with WT-MH3924A cells (Fig. 2A). In comparison with HUVECs cocultured with WT-MH3924A, coculture with TnI-MH3924A cells resulted in a 2.6-fold increased percentage of apoptotic HUVECs (Fig. 2B).

Proliferation and apoptosis of HUVECs cocultured with WT-MH3924A or TnI-MH3924A cells. (A) Proliferation. (B) Apoptosis. Values are mean ± SEM. *P < 0.05 vs. WT-MH3924A.
Inhibition of Tumor Growth and Proliferation and Induction of Apoptosis in TnI-MH3924A Tumors
At 36 d after inoculation in ACI rats, in vivo growth of TnI-MH3924A tumors was reduced by 90% (Fig. 3). In cell-mixture experiments, mixtures of 10% and 90% TnI-overexpressing MH3924A cells and corresponding parts of WT-MH3924 cells were inoculated. The 90% TnI tumor group revealed 60% tumor growth inhibition 36 d after inoculation, whereas tumors with 10% TnI-MH3924A cells demonstrated no significant growth inhibition. To exclude immunologic effects as possible causes of growth inhibition, additional experiments were done on athymic (nude) RNU rats. Eighteen days after inoculation, 60% suppression of tumor growth was noted in RNU rats bearing TnI-overexpressing tumors (1,450 ± 160 μL; n = 3) in comparison with WT-MH3924A (3,600 ± 400 μL; n = 5).

Tumor growth of WT-MH3924A and TnI-MH3924 tumors until 40 d after inoculation. Values are mean ± SEM. ***P < 0.001; **P < 0.01; *P < 0.05 vs. WT-MH3924A.
Immunohistochemistry data were in concert with the coculture experiments showing 70% increased apoptosis, whereas the proliferation rate was significantly decreased (25%; Table 1). Furthermore, the necrotic area was significantly increased in TnI-expressing tumors. Analysis of anti-p53 staining revealed no significant differences. Furthermore, in TnI-MH3924A tumors the percentage of CD11b−immunoreactive cells showed a significant 54% reduction (Table 1). As a marker for inflammation, we used COX-2 antibodies and found that in TnI-MH3924A tumors the percentage of COX-2−immunoreactive cells was significantly reduced to 2% (Table 1). MIF staining showed a significant 24% and 25% increase in the periphery and the center, respectively.
Histochemical Analyses of Morris Hepatomas Transplanted into ACI Rats: Apoptosis, Proliferation, Oxidative Stress, and Inflammatory Cells
Perfusion and Vascularization in TnI-MH3924A: PET, MRI, and Immunohistomorphometry
Because we expected differences in tissue perfusion or blood volume in TnI-expressing tumors, dynamic PET measurements with H215O and 68Ga-DOTA-albumin as well as MRI studies were performed (Figs. 4 and 5). Pharmacokinetic analysis of H215O PET data revealed that tumor perfusion, represented as K1 (in mL × mL tissue−1 × min−1), showed a mean decrease of 24% (P = 0.14) in TnI-MH3924A (0.32 ± 0.05) in comparison with WT-MH3924A (0.43 ± 0.04; Table 2). However, the flow of tracer from tumor tissue back to the blood vessels, represented as k2, was significantly decreased by 66% (P = 0.002) in TnI-MH3924A (0.25 ± 0.07) compared with WT-MH3924A (0.73 ± 0.09; Table 2). Additionally, the fractional volume of distribution (DV) significantly increased in TnI-MH3924A (1.69 ± 0.40; P = 0.022) compared with WT-MH3924A (0.65 ± 0.11; Table 2), whereas the vascular fraction (VB) was not significantly different between WT (0.02 ± 0.01) and genetically modified (0.016 ± 0.007) tumors (Table 2). Furthermore, blood-pool PET using 68Ga-DOTA-albumin for selective measurement of the perfused intravascular space demonstrated no difference between TnI-expressing (0.48 ± 0.03) and WT tumors (0.48 ± 0.06) (Table 2).

H215O PET. Representative images and time–activity curves measured in WT-MH3924A (A and C) and TnI-MH3924A (B and D) tumor; 2-dimensional acquisition. Results of modeling analysis are shown in Table 2. T = tumor.

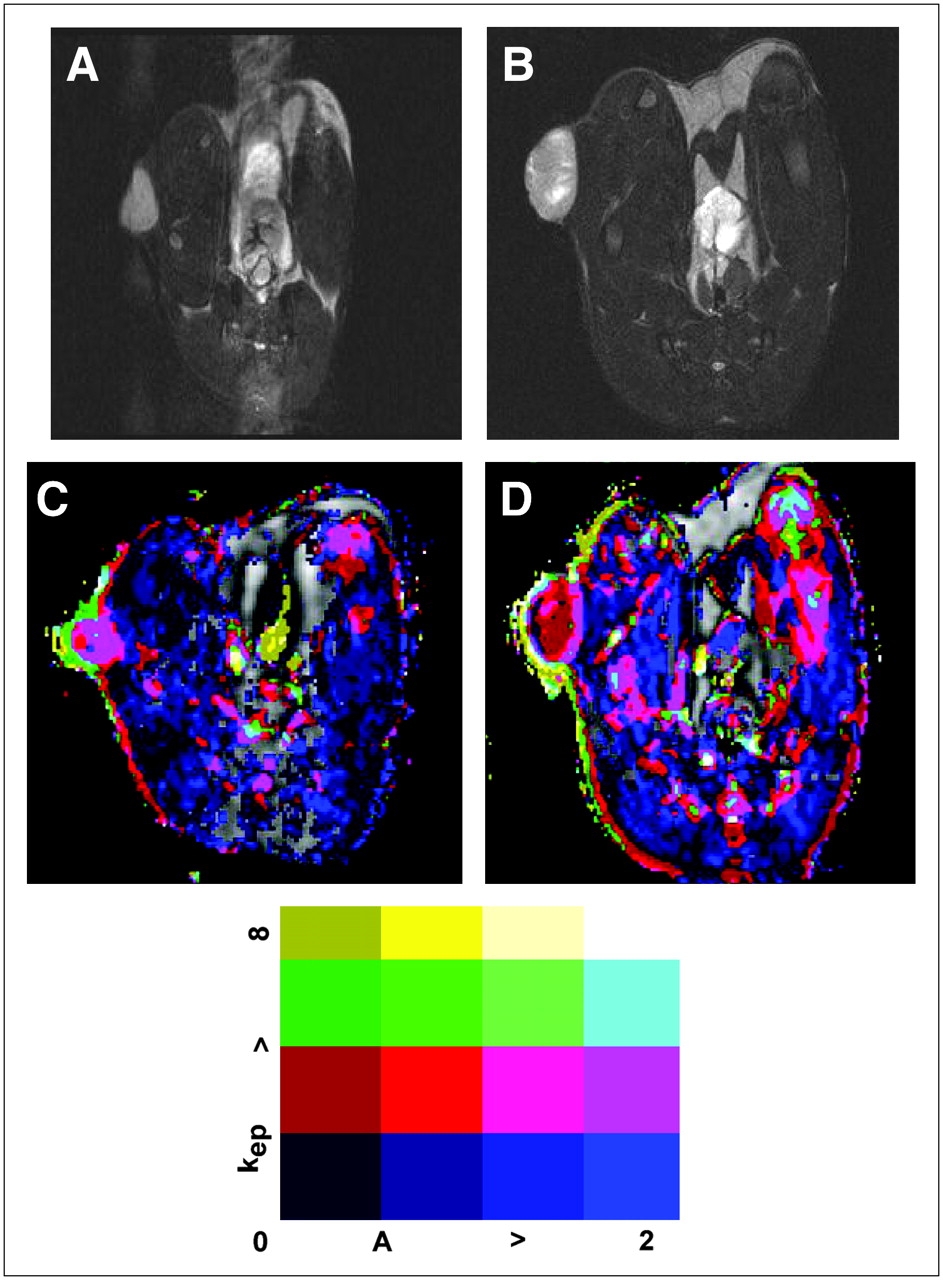
Functional MRI. Representative T2-weighted images of WT-MH3924A (A) and TnI-MH3924A (B) tumor. Corresponding parametric images for A and kep are shown in C and D. Range of signal intensity for kep and A is indicated at bottom.
H215O PET, 68Ga-DOTA-Albumin PET, and T1-Weighted DCE MRI
In line with the results from PET, the vascular tumor volume described by amplitude was not significantly different between TnI and WT MH3924A tumors in the DCE MRI experiments. ROIs of the tumor periphery revealed significantly increased amplitudes in comparison to total tumor values, whereas amplitudes of the tumor center were significantly decreased (Table 2). The rate constant kep, highly influenced by the curve gradient and by vessel permeability, was significantly decreased by 52% in the periphery of TnI-MH3924A tumors and by 56% in the total tumor area. kep values of the tumor center were reduced in TnI-MH3924A as well as WT-MH3924A, however without significant differences (Table 2).
In general, microvessel density in both tumor groups was 2−3 times higher in the periphery in comparison with the center, as indicated by the MRI experiments. In contrast to the functional measurements of tumor blood volume, microvessel density was decreased by 45% in the periphery of TnI-MH3924A compared with WT-MH3924A tumors (Table 1). Furthermore, the mean number of blood vessels was significantly decreased in TnI-MH3924A (137.70 ± 15.95 per mm2) in comparison with WT-MH3924A (222.02 ± 25.58 per mm2). Tumor sections were also stained with α-actin, which is expressed in mural cells of arterioles and venules but not in capillaries. The α-actin−immunoreactive area was similar in the periphery as well as in the center of TnI- and WT-MH3924A tumors (Table 1), which is in accordance with our functional blood volume measurements. However, it was twice as high in the circumference in comparison with the center (Table 1).
Effects of hTnI Gene Transfer on Expression of Tumor Genes: Gene Arrays
To assess the general effects of TnI gene transfer on MH3924A cells, the in vitro and in vivo gene expression pattern was studied using gene arrays. Because transfer of selection markers such as the hygromycin gene and the selection procedure may cause changes in the genetic program, we analyzed the expression pattern in the tumor cell lines as well as in explanted tumors of these cell lines. In general, we found changes in expression of genes related to apoptosis, signal transduction/stress, or angiogenesis (Table 3), with clear differences between in vitro and in vivo patterns. This indicates that the observed effects are caused by the microenvironment in vivo.
Changes in Gene Expression in Genetically Modified TnI-Expressing Hepatomas
DISCUSSION
In vitro proliferation of HUVECs is inhibited by 30% when cocultured with TnI-MH3924A cells (Fig. 2A). These results confirm and extend findings showing that TnI inhibits both basic fibroblast growth factor (bFGF)-stimulated and basal levels of capillary endothelial cell proliferation. These studies led to the hypothesis that the effect of TnI is specific for the bFGF receptor (2,3). Furthermore, TnI-MH3924A cells induce apoptosis in HUVECs (Fig. 2B), which is in contrast to findings of Feldman et al. (3) and might be explained by the use of primary endothelial cells (HUVECs) instead of capillary endothelial cells. However, proapoptotic effects of other antiangiogenic genes such as angiostatin or endostatin have been recently reported (13).
We observed significant inhibition of tumor growth in animals bearing TnI-MH3924A (Fig. 3), which might be due to reduced vascularization, blocked bFGF receptors of tumor cells, altered tumor proliferation, or induction of apoptosis. Explanted TnI-MH3924A tumors presented an increased apoptosis rate, which was p53 independent (Table 1) with an increase in necrotic areas, whereas the proliferation rate was significantly reduced (Table 1). Addition of TnI to nonendothelial bFGF-dependent BaF3/FGFR1 tumor cells resulted in an inhibition of proliferation (3). This could be a hint for bFGF-dependent proliferation of Morris hepatoma cells, which demonstrated a diminished proliferation rate of TnI transfected tumors in vivo (Table 1).
Our H215O PET measurements revealed marginally decreased changes in tumor tissue perfusion, represented as K1, in TnI transfected tumors (Table 2). Additionally, k2, representing the back flow of tracer from tumor tissue into the intravascular space, is significantly diminished in TnI-MH3924A, whereas the tumor blood volume measured by 68Ga-DOTA-albumin-PET in TnI transfected tumors demonstrates no change (Table 2). As we evaluated WT- and TnI-expressing tumors with the same diameter, these changes are not due to differences in partial-volume effects. The findings of reduced tumor tissue perfusion without changes of tumor blood volume were supported by dynamic MRI investigations showing no differences in amplitude (a marker for the vascular volume) between both tumor groups. In contrast, kep values were significantly decreased in TnI-overexpressing tumors (Table 2). In this context, our immunohistologic analysis revealed that microvessel density in the periphery as well as in the center of TnI-overexpressing hepatoma is reduced, providing additional evidence for the antiangiogenic effects of this gene. However, the fraction of larger vessels containing α-actin−immunoreactive smooth muscle cells was comparable between WT- and TnI-MH3924A tumors (Table 1), indicating that TnI expression does not affect macrovessels such as arterioles. kep must be seen as a compound parameter, which is highly influenced by vessel permeability and perfusion. In tumors with sufficiently high blood flow kep represents vessel permeability, whereas in tumors with low blood flow and high permeability perfusion is the main influencing factor of kep (14). In the present case, microvessel density as well as kep and PET perfusion markers k2 (significantly) and K1 (marginally) are reduced, leading to an increase in necrosis. Furthermore, our PET data show that the fractional volume of distribution (DV) significantly increased in TnI-MH3924A tumors, whereas the vascular fraction (VB) remained unchanged (Table 2). The discrepancy between the values for DV and albumin accumulation may reflect the fact that albumin data represent the volume defined by the intravascular space, whereas water evenly distributes in the total tumor volume.
CD11b(+) macrophages are suggested to be the major source of oxidative stress and their cellular infiltration into the tissue was found to correspond to an enhanced tumor growth (15). Because the percentage of CD11b(+) macrophages is reduced in TnI-MH3924A tumors, their stimulatory effect on tumor growth may be reduced. Further evidence is obtained by the decrease of proinflammatory COX-2−positive cells in TnI-MH3924A tumors (Table 1). COX-2−derived prostaglandin E2 stimulates the expression of angiogenic regulatory genes such as VEGF, Flt, Ang2, and Tie-2 in mammary tumor cells isolated from COX-2 transgenic mice. In consequence, COX-2−selective nonsteroidal antiinflammatory drugs reduced the expression of VEGF and FLT-1 (16). In colorectal tumors, the MIF level is related to their levels of biologic aggressiveness (17) and MIF is suggested to act as an autocrine factor that stimulates angiogenesis and metastasis in hepatoma by promoting expression of angiogenic factors and migration of tumor cells (18). Our data show that, although the percentage of MIF-positive cells is increased in TnI-MH3924A tumors, the micro-/macrovascularization and proliferation rate are decreased and tumor growth is inhibited. Because MIF is a modulator of prooxidative stress-induced apoptosis (19), it may also function in this way in TnI-MH3924A.
As TnI-expressing tumors required a longer time period to achieve the appropriate size for PET measurements, a potential bias in the tumor microenvironment might have been introduced due to the longer presence of the TnI-expressing tumors within the animals and the resulting host response, such as the inflammatory reactions and differences in the RNA patterns. However, this is unlikely for the following reasons: During a longer growth period tumors are expected to have more time for the development of vessels and, because of a longer exposure time, also for the development of immune reactions. We found a decrease in microvessel density and a reduced inflammatory response. Furthermore, similar reactions have been demonstrated in the same tumor model after transfer of the soluble receptor for VEGF (sFLT), which resulted only in a moderate growth inhibition but similar effects on immune response and gene expression to those found in TnI-expressing hepatoma (7). A misinterpretation due to clonal variation can be excluded for similar reasons: Transfer of the genes for sFLT (7), angiostatin (8), or angiopoietin-2 (20) resulted in moderate (sFLT), strong (angiostatin), or no (angiopoietin-2) growth inhibition associated with a decreased (sFLT), increased (angiostatin), or similar (angiopoietin-2) perfusion.
Besides decreased perfusion/vascularization and proliferation as well as increased apoptosis, additional genes may change their expression pattern as a result of tumor cells reacting to the TnI activity. Therefore, a gene array analysis was performed in tumor cell lines and in explanted tumors. Gene arrays of genetically modified cells revealed that TnI affects expression of several genes (Table 3). The differential gene expression of TnI cells and TnI tumors is a result of the in vivo situation, where a mixture of cells (hepatoma cells, cells of the vessel wall, or cells of connective tissue), metabolic interaction of cells, oxygen supply, and so forth are potential influencing factors. In genetically modified tumors, we found significant changes in a variety of genes related to angiogenesis, apoptosis, signal transduction, or stress. Gene array analyses revealed an increase in several protease genes, such as mast cell protease 10, vascular chymase, mast cell protease 8 precursor, and mast cell protease 3, which are known to be associated with angiogenesis. Furthermore, increased expression of the angiogenic growth factor FGF was observed possibly as a response of tumor cells to the TnI arranged blockade of the bFGF receptor as suggested by others (3). VEGF-D expression, playing a role in lymphangiogenesis, is increased in TnI-expressing tumors, which may be a reaction of tumor cells to TnI activity, possibly competing with VEGF for heparin sulfate proteoglycan on the endothelial cell surface (2). Evidence for a cross-talk among different angiogenic factors has been found in experiments targeting the VEGF receptor system. In these studies phenotypic resistance emerged to anti-VEGFR2 therapy, involving vascular regrowth in a VEGF-independent second wave of angiogenesis, which was mediated in part by proangiogenic ligands of the FGF family (21).
An apoptosis-inducing function of TnI is also demonstrated by upregulation of apoptosis-associated genes in TnI-MH3924A tumors, supporting our in vitro and immunohistochemistry data. We found an increase in expression of the ICE-like cysteine protease and leukocyte common antigen receptor (LAR) gene in TnI-MH3924A tumors, which have been shown to be linked during apoptosis induction (22). In addition, in TnI-MH3924A tumors, the expression of the A2b-adenosine receptor gene, which is involved in induction of apoptosis in different cell types, is upregulated (23,24). Adenosine receptors bind adenosine, which is a ubiquitous nucleoside present in all body cells being released from metabolically active or stressed cells (24). However, until now, no data relating to the influence of TnI gene expression and induction of apoptosis by activation of these pathways were available. A significant induction of additional proapoptotic genes in TnI-MH3924A tumors would seem to provide promising tools to inhibit tumor growth in vivo in the near future.
CONCLUSION
TnI overexpression in hepatoma results in decreased vascularization and perfusion, which was shown by decreased K1 (not significant), k2 for PET, and kep for MRI. The inhibition of tumor growth seems to depend on reduced tumor perfusion but also on mechanisms involved in proliferation and apoptosis. Furthermore, gene transfer of TnI in Morris hepatoma induces changes in expression pattern of multiple genes related to angiogenesis, apoptosis, signal transduction, or stress. Because these changes in gene expression pattern are observed in tumor tissue and not in vitro, they represent reactions of the tumor to its microenvironment. The upregulation of some angiogenic genes can be seen as a compensatory mechanism.
Acknowledgments
The authors have no conflicting financial interests and thank Thomas Dengler, Britta Engelhardt, Helmut Eskerski, Antonia Dimitrakopoulou-Strauss, Silke Vorwald, Uschi Schierbaum, and Karin Leotta for their help in performing animal experiments and analyses as well as for providing HUVECs. Financial support was from Wilhelm Sander Stiftung (1999.085.1), Tumorzentrum Heidelberg/Mannheim, Ferdinand-Heinrich-Mörsel, Wilhelm Seiter Foundation, and EMIL network.
Footnotes
-
↵* Contributed equally to this work.
-
COPYRIGHT © 2006 by the Society of Nuclear Medicine, Inc.
References
- Received for publication October 28, 2005.
- Accepted for publication May 8, 2006.


Jump to section
Related Articles
Cited By...
- No citing articles found.