


Article Figures & Data
Figures
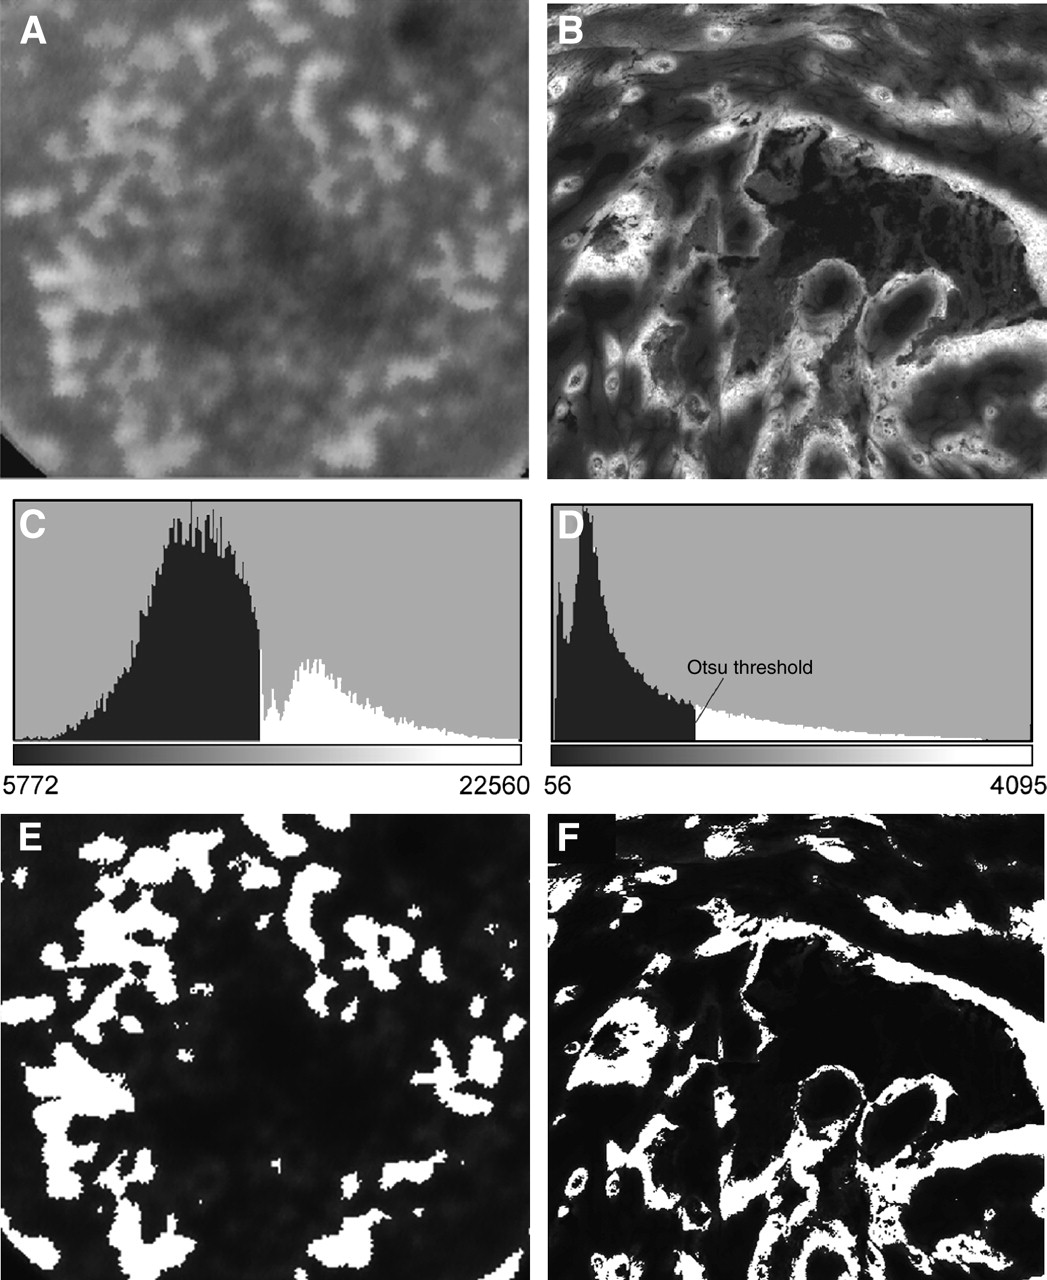
- FIGURE 1.
Image thresholding in area fraction measurement. (A and B) Original 64Cu-ATSM autoradiography image and EF5 fluorescent staining image. (C and D) Corresponding histograms for above images. The Otsu automatic thresholding method was used to determine the threshold based on histograms. Pixels with intensity higher than the threshold (in white color) were treated as positive uptake or staining area. (E and F) Segmented images using the Otsu threshold for autoradiography and EF5 staining image. Area in white is regarded as 64Cu-ATSM uptake area or positive staining area.
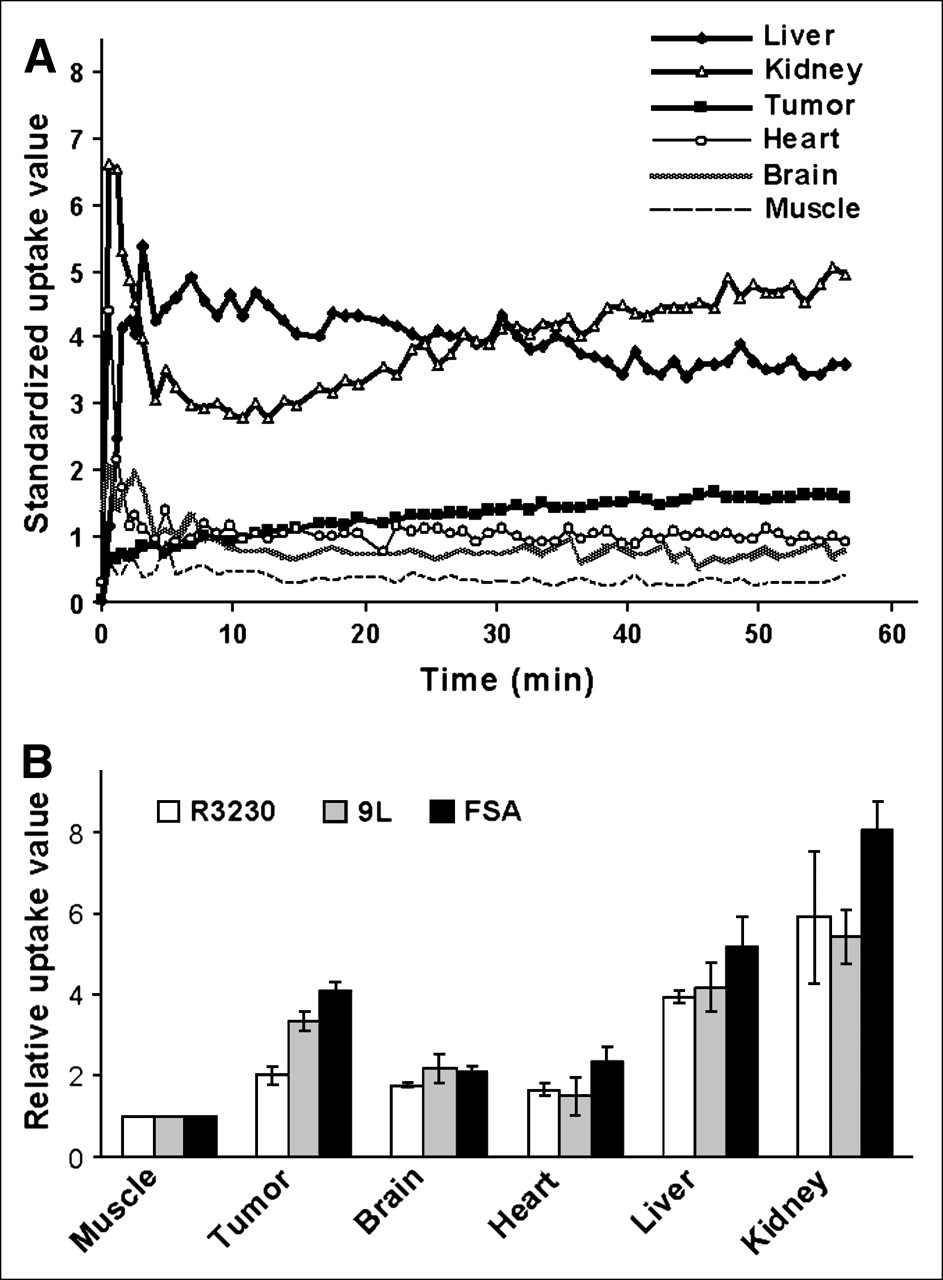
- FIGURE 2.
Biodistribution of 64Cu-ATSM in tumor-bearing rat model. (A) Dynamic uptake of 64Cu-ATSM in different organs in 9L tumor-bearing rat measured from whole-body microPET. (B) Biodistribution data measured using autoradiography on organs taken from animals at 1 h after radiopharmaceutical injection in 3 tumor lines. Biodistribution data are presented as a relative uptake value for each organ normalized to muscle in each animal.
- FIGURE 3.
microPET of 3 different tumor types. (A) Typical PET image for R3230Ac with transverse, coronal, and sagittal sections. An ROI was drawn in transverse section to measure the uptake level. For each tumor, measurements were taken in 4 ROIs and averaged, representing an overall uptake level. (B) Dynamic uptake of 64Cu-ATSM in 3 tumors including R3230Ac (n = 8), 9L (n = 7), and FSA (n = 7). Uptake value in muscle was taken from R3230Ac animals.
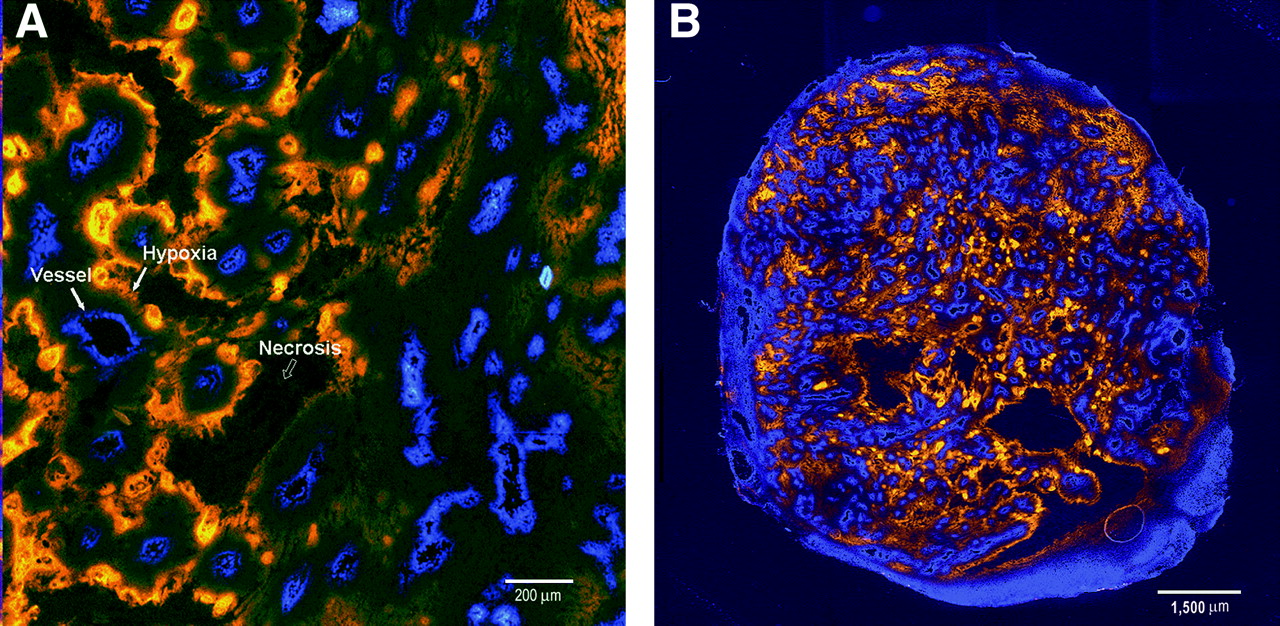
- FIGURE 4.
Typical immunostaining of EF5 binding in tumor tissues (R3230Ac). Dual fluorescence images (A) are overlaid to show distribution of hypoxia relative to vasculature. Hypoxic tissue is indicated by EF5 staining in orange. Vasculature is indicated by the Hoechst 33342 perfusion marker in blue. (B) A whole tumor section staining image was generated by stitching together images from microscope stage scans.
- FIGURE 5.
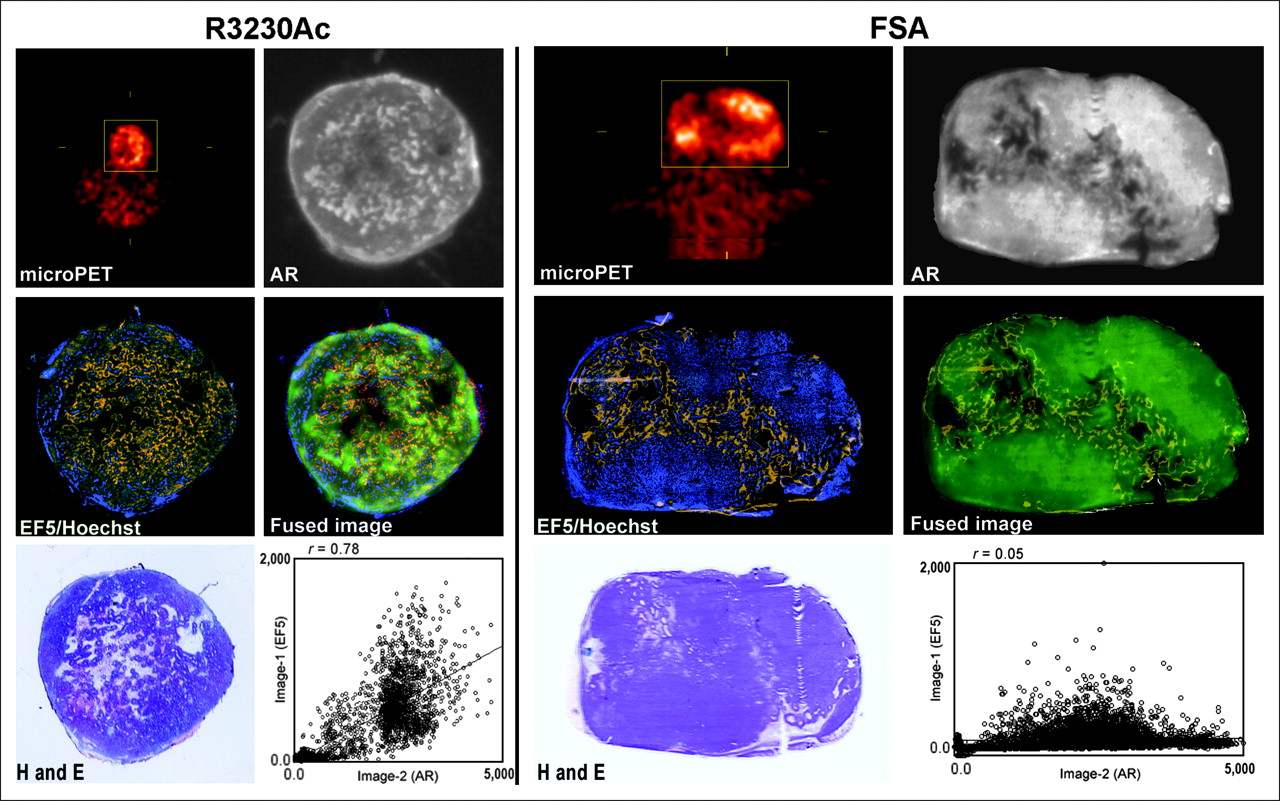
Comparisons between 64Cu-ATSM uptake and hypoxia measured by immunostaining in R3230Ac and FSA. Close correlation between 64Cu-ATSM uptake and EF5-stained hypoxic area was observed in R3230Ac tumor (left), whereas no correlation was found in FSA tumor (right). Images include 64Cu-ATSM microPET image, autoradiography (AR) section from same tumor, EF5 and Hoechst immunostaining from adjacent section, fused image from autoradiography and EF5 images, H&E staining, and correlation plot between autoradiography and EF5 staining images. EF5-stained hypoxic area is indicated by orange, perfused vessels are marked by blue fluorescent Hoechst 33342 dye, and 64Cu-ATSM distribution in AR is indicated by green in fused image. In FSA, a large amount of 64Cu-ATSM accumulated in well-perfused areas, which are indicated in Hoechst perfusion image. The spatial correlation between autoradiography and EF5 staining images in this specific FSA tumor is 0.05, whereas the spatial correlation is 0.78 in the shown R3230Ac tumor.
- FIGURE 6.
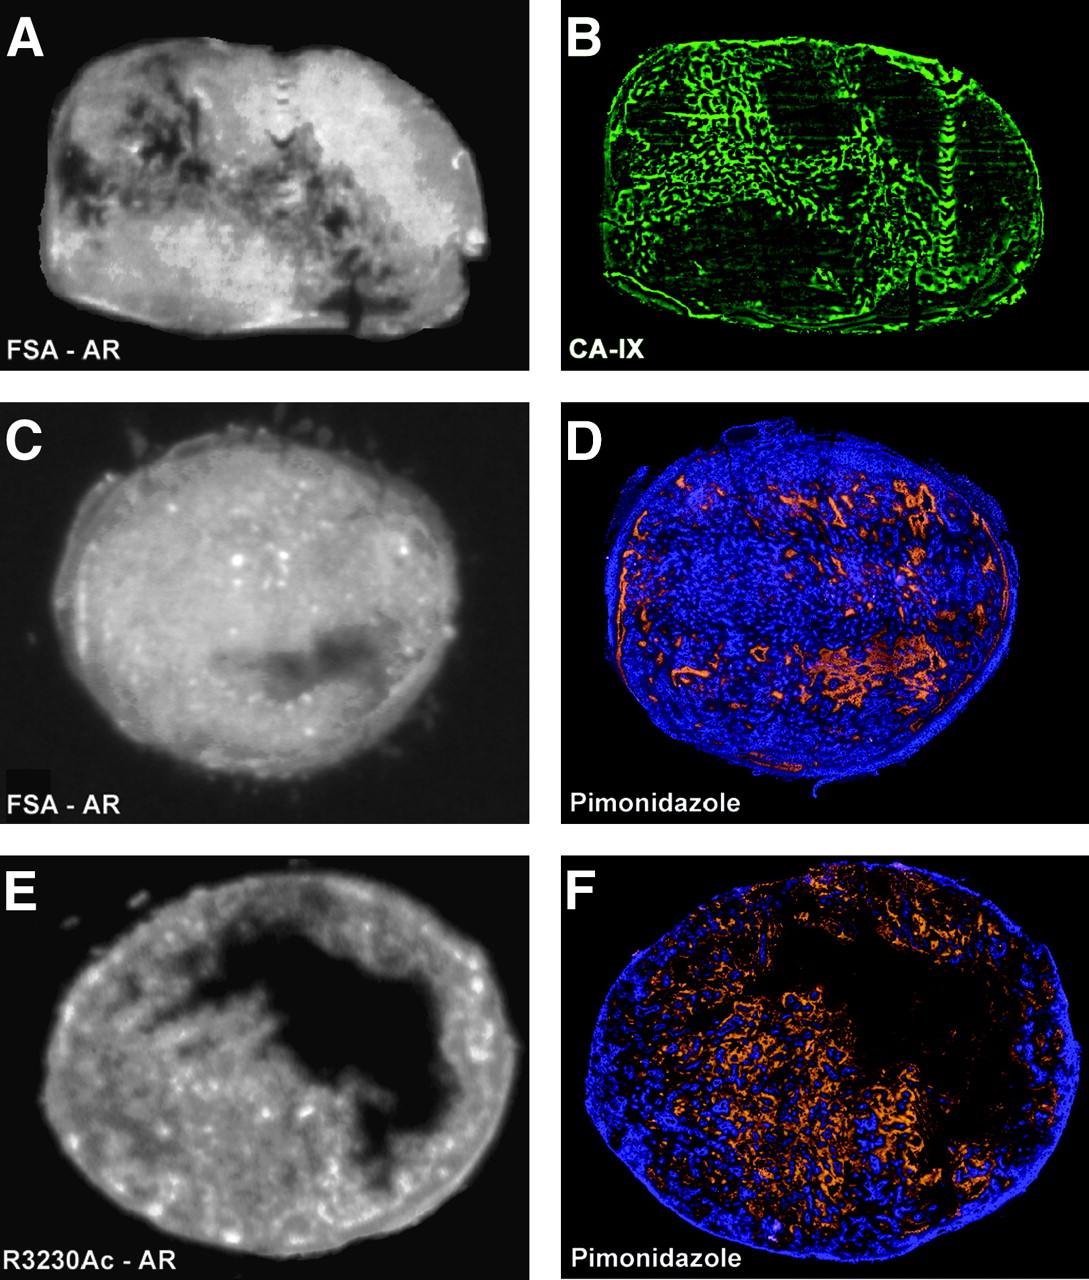
CA-IX and pimonidazole staining on FSA and R3230Ac tumor sections. (A and B) 64Cu-ATSM autoradiography (AR) and CA-IX staining (green) on same FSA tumor section (in same tumor as shown in Fig. 5, FSA panel). CA-IX staining shows a hypoxia distribution that is consistent with EF5 staining. (C and D) 64Cu-ATSM autoradiography and pimonidazole staining (orange) with Hoechst 33342 vascular perfusion marker (blue) illustrate low correlation between 64Cu-ATSM and this hypoxia marker in FSA. (E and F) 64Cu-ATSM autoradiography and pimonidazole staining in R3230Ac tumor. Close correlation can be seen between 64Cu-ATSM uptake and pimonidazole staining.
- FIGURE 7.
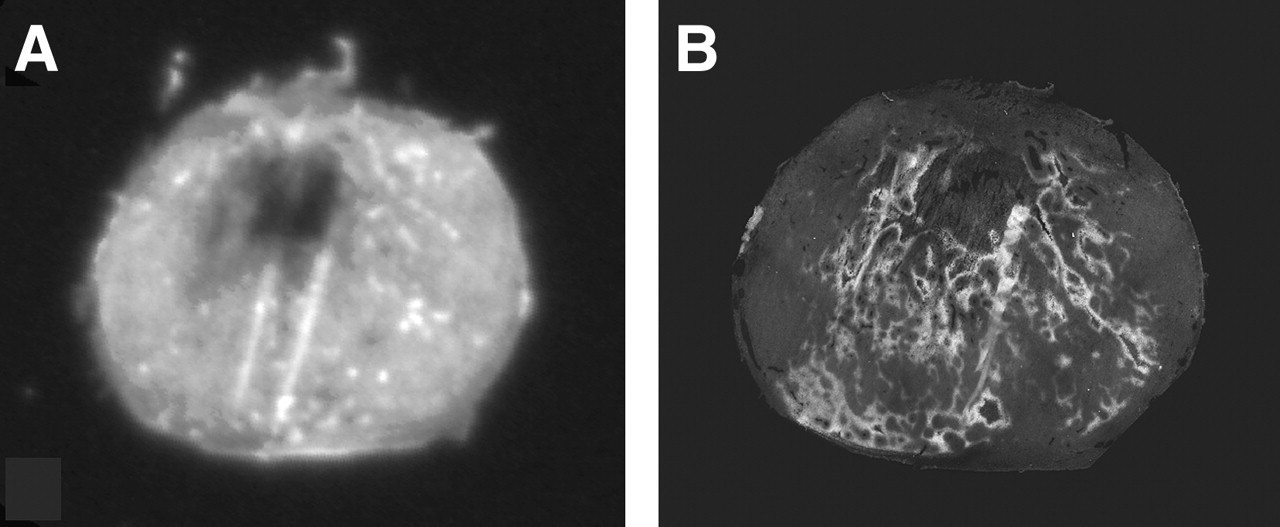
64Cu-ATSM distribution in response to oxygenation. FSA-bearing rats breathed carbogen for 3 h before and during microPET. (A) 64Cu-ATSM autoradiography image. (B) EF5 binding (orange) and Hoechst perfusion (blue) fluorescent staining image for the neighboring tumor section from same animal. There is no correlation between 64Cu-ATSM uptake and hypoxia marked by EF5 binding. A significant decrease in EF5 staining, but not uptake of 64Cu-ATSM, was found in carbogen-breathing animal group (Table 3).


Tables
Tumor 64Cu uptake area fraction* EF5 staining area fraction Spatial correlation* R3230Ac (n = 8) 0.239 ± 0.036 0.207 ± 0.025 0.74 ± 0.02, P < 0.001 9L (n = 7) 0.166 ± 0.067 0.208 ± 0.051 0.61 ± 0.04, P < 0.001 FSA (n = 7) 0.442 ± 0.094 0.165 ± 0.041† 0.11 ± 0.03, P = 0.2 ↵* 64Cu-ATSM autoradiography images were used for area fraction and spatial correlation analysis. Area fraction is defined as ratio of positive staining or uptake region to overall viable tissue.
↵† P < 0.05, significant difference between 64Cu-ATSM uptake and EF5 staining area fractions for FSA.
Data are presented as mean ± SEM.
- TABLE 3
Uptake of 64Cu-ATSM and EF5 Staining in Air-Breathing and Carbogen-Breathing Animals Bearing FSA Tumor
Tumor SUV 64Cu uptake area fraction EF5 staining area fraction FSA (n = 7) (air) 2.39 ± 0.36 0.442 ± 0.094 0.165 ± 0.041* FSA (n = 3) (carbogen) 4.20 ± 1.24 0.615 ± 0.150 0.076 ± 0.049* Significance† P = 0.09 P = 0.23 P < 0.05


Jump to section
Related Articles
Cited By...
- Addressing Biological Questions with Preclinical Cancer Imaging
- 64Cu-ATSM Reflects pO2 Levels in Human Head and Neck Cancer Xenografts but Not in Colorectal Cancer Xenografts: Comparison with 64CuCl2
- Oxygen-Enhanced MRI Is a Major Advance in Tumor Hypoxia Imaging
- Comparison of the Hypoxia PET Tracer 18F-EF5 to Immunohistochemical Marker EF5 in 3 Different Human Tumor Xenograft Models
- On the Destiny of (Copper) Species
- A Comparison of the Behavior of 64Cu-Acetate and 64Cu-ATSM In Vitro and In Vivo
- Heterogeneity in Intratumor Correlations of 18F-FDG, 18F-FLT, and 61Cu-ATSM PET in Canine Sinonasal Tumors
- Interrogating Tumor Metabolism and Tumor Microenvironments Using Molecular Positron Emission Tomography Imaging. Theranostic Approaches to Improve Therapeutics
- Imaging hypoxia in gliomas
- Preclinical evaluation and validation of [18F]HX4, a promising hypoxia marker for PET imaging
- NADPH oxidase-mediated reactive oxygen species production activates hypoxia-inducible factor-1 (HIF-1) via the ERK pathway after hyperthermia treatment
- PET of Hypoxia with 89Zr-Labeled cG250-F(ab')2 in Head and Neck Tumors
- Retention of the Radiotracers 64Cu-ATSM and 64Cu-PTSM in Human and Murine Tumors Is Influenced by MDR1 Protein Expression
- Noninvasive 64Cu-ATSM and PET/CT Assessment of Hypoxia in Rat Skeletal Muscles and Tendons During Muscle Contractions
- Applications of Nitroimidazole In Vivo Hypoxia Imaging in Ischemic Stroke