


Abstract
The hypoxia PET tracer 64Cu-diacetyl-bis(N4-methylthiosemicarbazonate) (64Cu-ATSM) has shown promising results in clinical studies. However, concerns have been raised with regard to the possible effect of copper metabolism and free copper on tumor uptake and thereby the robustness of 64Cu-ATSM as a hypoxia marker. In this study, accumulation and distribution of 64Cu-ATSM and 64CuCl2 in tumor tissue were compared with partial pressure of oxygen (pO2) probe measurements. Methods: One-hour dynamic PET scans were performed on nude mice bearing subcutaneous human head and neck tumors (FaDu) and human colorectal tumors (HT29) after administration of either 64Cu-ATSM or 64CuCl2. Subsequently, tracks were generated and track markers were positioned in tumors to allow for registration of their exact location on the high-resolution CT scan. After completion of the CT scan, pO2 probe measurements were performed along each track. PET and CT images were coregistered and ROIs drawn on the basis of the location of track markers and pO2 probe measurement depth. A linear mixed model for repeated measures was applied for the comparison of PET tracer uptake to corresponding pO2 values. Results: Comparable uptake of 64Cu-ATSM and 64CuCl2 was found in the kidney, muscle, and liver of all animals, but 64CuCl2 showed a higher uptake 10–60 min after injection in both tumor models. Significant differences were also found for both tumor-to-muscle and tumor-to-liver ratios. The intratumoral distribution of 64Cu-ATSM, but not 64CuCl2, showed a significant negative relationship with pO2 measurements in FaDu tumors. However, this relationship was not found in HT29 tumors. Conclusion: 64Cu-ATSM and 64CuCl2 displayed different uptake in tumors. In human head and neck xenografts, 64Cu-ATSM but not 64CuCl2 reflected pO2 measurements, indicating that 64Cu-ATSM is a hypoxia-specific marker in this tumor type. However, data from colorectal cancer xenografts indicated that 64Cu-ATSM may not be a hypoxia marker in all tumor types.
Tumor hypoxia is associated with an aggressive tumor phenotype and radio- and chemotherapy resistance (1–4). A variety of techniques have been applied to assess hypoxia, but partial pressure of oxygen (pO2) probe measurements are currently regarded as the gold standard and have been extensively used to study the relationship between tumor oxygenation and clinical outcome (1,5–7). However, this method has several limitations due to the inaccessibility of some tumors for needle placement, the limited sampling volume, and the invasive nature of the procedure (8). In addition, the oxygen electrode is unable to distinguish between necrotic and viable hypoxic areas, and insertion of the probe disrupts the tissue at the site of measurement.
Tissue oxygenation can also be quantified with noninvasive imaging techniques, such as MRI, electron paramagnetic resonance, and PET (9,10), and 64Cu-diacetyl-bis(N4-methylthiosemicarbazonate) (64Cu-ATSM) is one of several PET tracers currently under evaluation for imaging of tumor hypoxia. 64Cu-ATSM has a high tumor-to-background ratio and has shown promising results in small clinical studies, in which the tumor-to-muscle ratio was able to predict treatment outcome (11–13). However, the robustness of 64Cu-ATSM as a marker of hypoxia has been questioned, because preclinical studies have reported temporal changes in tumor uptake and cell-type–specific differences in hypoxia selectivity (14–26). Table 1 provides an overview of major studies using 64Cu-ATSM in small-animal tumor xenograft models.
Major Studies Using Cu-ATSM in Small-Animal Tumor Models
The mechanism responsible for 64Cu-ATSM retention is not completely understood, but in vitro studies have indicated that the 64Cu-ATSM complex undergoes reduction by free diffusion after entering the cells (27–29). In normoxic cells, 64Cu-ATSM is rapidly reoxidized and consequently able to leave the cell again by free diffusion. In hypoxic cells, reoxidation occurs at a slower rate, leaving enough time for dissociation of the unstable [64Cu-ATSM]−. The radioactive copper isotope then becomes part of the intracellular copper pool, and some studies have indicated that there also appears to be an efflux of either radiolabeled 64Cu-ATSM or copper from cancer cells (30–32). Moreover, studies of copper metabolism using 64CuCl2 PET in tumor xenograft mouse models have reported high tumor accumulation in some tissue types (33,34). This is interesting with regard to the proposed trapping mechanism and in vivo stability of 64Cu-ATSM, as copper could both accumulate in tumor tissue and redistribute after dissociation from the 64Cu-ATSM complex. Indeed, a recent study comparing 64Cu-ATSM and 64Cu-acetate uptake in tumor-bearing mice found great similarity between the two tracers (16). In addition, in vivo stability experiments indicated that a fraction of 64Cu found in blood was not associated with the 64Cu-ATSM complex within a few minutes after tracer administration (16).
Oxygen probe measurements have previously been applied to compare the uptake of PET tracers to average tumor pO2 values (35–37). Moreover, the technique has also been used for evaluation of the spatial distribution of hypoxia PET tracers in a few studies (21,38,39). In this study, uptake of 64Cu-ATSM and 64CuCl2 was measured in human tumor xenograft-bearing nude mice using small-animal PET, and the intratumoral distribution was compared with pO2 probe measurements.
MATERIALS AND METHODS
Tumor Model
All experiments were performed under national and European Union–approved guidelines for animal welfare. Human head and neck cancer (FaDu) and colorectal cancer (HT29) cell lines (ATCC) were cultured at 37°C and 5% CO2 in minimum essential medium and McCoy 5A medium, respectively, both supplemented with 10% fetal calf serum and 1% penicillin–streptomycin (all from Invitrogen Co.). Seven-week-old female nude NMRI mice (Taconic Europe) had 107 cells, dissolved in 100 μL of medium mixed with 100 μL of Matrixgel Basement Membrane Matrix (BD-Biosciences), subcutaneously inoculated into each flank. Throughout the experiment, the mice were regularly weighed and tumor dimensions measured using a caliper.
Experimental Setup
64CuCl2 and 64Cu-ATSM were produced and synthesized by Risø National Laboratory, Technical University of Denmark. Before the procedure, the animals were weighed and randomized into 4 groups of 4 animals each. All tumors used in this study had diameters of about 10 mm in each dimension. During all procedures, the mice were anesthetized using a mixture of 3% sevoflurane (Abbott Scandinavia AB) mixed with 35% O2 in N2.64Cu-ATSM or 64CuCl2 was injected into a tail vein, and the exact dose calculated (64Cu-ATSM: 8.96 ± 0.65 MBq (mean ± SD); 64CuCl2: 9.47 ± 1.55 MBq) on the basis of measurements of the syringe before and after injection using a radioisotope calibrator (HRC-120; Amersham). Immediately after the injection, the mice were placed on a scanner bed, and the subcutaneous tumors on each flank were positioned for optimal needle access and fixed to eliminate movement. One-hour dynamic scans were performed on a microPET Focus 120 (Siemens Medical Solutions) with a resolution of 1.18 mm (sagittal), 1.13 mm (coronal), and 1.44 mm (transversal) at the center of the field of view. The resulting list-mode data were postprocessed using 3-dimensional maximum a priori algorithms into 256 × 256 × 95 image matrices with a voxel size of 0.43 mm3. For each mouse, frames were defined so they contained data from 10 to 20, 20 to 30, 30 to 40, 40 to 50, and 50 to 60 min from injection to the start of PET acquisition.
After the PET acquisition, two to three 24-gauge vein catheters (Becton Dickinson A/S) were pierced through each tumor and the catheter needle retracted. The plastic catheter tubes were left in the tumor tissue as track markers and for later guidance of pO2 probe insertion. There was a minimum of 3–4 mm between the individual tracks. The animal bed was moved to a small-animal CT scanner and a 7-min CT scan performed. Immediately after completion of the CT scan, the animals were moved to a preheated pO2 measurement platform and a fiber-optic oxygen-sensitive probe (OxyLite 4000; Oxford Optronix) was used to measure local oxygen tension in tumors. More detail on oxygen probe measurement is provided in the supplemental data (available at http://jnm.snmjournals.org).
Data and Statistical Analysis
For each group, pO2 measurements were pooled and cumulative frequency plots of pO2 measurements were used to compare the distribution. Values below 1.5 mm Hg, equal to 2 times the measurement accuracy of the Oxylite measurement system, were excluded from the analysis. After this step, there were 108, 98, 102, and 127 data points left for further analysis in the FaDu 64Cu-ATSM, FaDu 64CuCl2, HT29 64Cu-ATSM, and HT29 64CuCl2, groups, respectively.
All image data were analyzed using Inveon software (Siemens Medical Solutions). PET and CT images were coregistered in 3 dimensions by an affine registration algorithm and visually inspected. Regions of interest (ROIs) were drawn on tumor, muscle, liver, and kidney tissue and uptake calculated as mean %ID/g (percentage injected dose per gram of tissue), tumor-to-muscle ratio, and tumor-to-liver ratio for comparison of image-derived biodistribution. In addition, multiple 20-voxel spheric ROIs (∼0.6 mm3) were placed along each catheter track. This first ROI was placed immediately under the skin, and the distance between each data point was the same as for the pO2 measurements (∼0.5 mm). The uptakes of all regions along each track were calculated as mean %ID/g.
A linear mixed model adjusting for serial correlation (autoregressive) of repeated measurements was used to assess the association between uptake of 64Cu-ATSM or 64CuCl2 and the corresponding pO2 probe measurements when both tumor model and time effect was considered. It was assumed that variation caused by tracer type, tumor model, time, and pO2 and the interactions between them was fixed and that the effect of individual animals was random. Statistical analysis was performed with SPSS statistical software, version 20.0 (IBM Corp.), and Prism 5 (GraphPad Software, Inc.) was used for illustrations. The cumulative frequency plots were visualized using in-house–constructed algorithm using Matlab (version 2014b; The MathWorks, Inc.). PET data are presented as mean ± SEM. A P value of less than 0.05 was considered statistically significant in all analyses.
RESULTS
Comparison of 64Cu-ATSM and 64CuCl2 Uptake
The image-derived biodistribution of 64Cu-ATSM and 64CuCl2 in different tissues from 10 to 60 min after injection was investigated (Fig. 1). Uptake of 64Cu-ATSM was comparable to that of CuCl2 in muscle, kidney, and liver tissue in both tumor models. However, a higher accumulation of 64CuCl2 than of 64Cu-ATSM was found in both FaDu and HT29 tumors, resulting in significantly higher tumor-to-muscle and tumor-to-liver ratios (Figs. 2 and 3). Also, a higher variation in tumor and liver uptake between animals was observed in the 64CuCl2 group.

Image-derived biodistribution of 64Cu-ATSM and 64CuCl2 obtained from dynamic PET scans performed 10–60 min after injection. Uptake in FaDu tumor–bearing mice of 64Cu-ATSM (black symbols) (n = 4) and 64CuCl2 (blue symbols) (n = 4) and uptake in HT29 mice of 64Cu-ATSM (red symbols) (n = 4) and 64CuCl2 (green symbols) (n = 4) is given as mean %ID/g ± SEM in tumor (A), liver (B), kidney (C), and muscle (D). Animals were anesthetized during scans by breathing 3% sevoflurane mixed with 35% O2 in N2.

Representative transaxial PET images 50–60 min after injection of FaDu tumor–bearing mice with 64Cu-ATSM (A) and 64CuCl2 (B) and of HT29 tumor–bearing mice with 64Cu-ATSM (C) and 64CuCl2 (D) (arrows indicate tumors).

Tumor-to-liver (A) and tumor-to-muscle (B) ratios from dynamic 64Cu-ATSM or 64CuCl2 PET scans performed 10–60 min after injection. Uptake in FaDu mice of 64Cu-ATSM (black symbols) (n = 4) and 64CuCl2 (blue symbols) (n = 4) and uptake in HT29 mice of 64Cu-ATSM (red symbols) (n = 4) and 64CuCl2 (green symbols) (n = 4) is shown. Animals were anesthetized during scans by breathing 3% sevoflurane mixed with 35% O2 in N2.
Intratumoral pO2 Measurements
The pO2 values obtained with the oxygen probe in FaDu tumors ranged from −0.55 to 53 mm Hg in the 64Cu-ATSM group and −0.72 to 46 mm Hg in the 64CuCl2 group. In HT29 tumors, the pO2 values ranged from −0.60 to 57.74 mm Hg in the 64Cu-ATSM group and −0.86 to 60.04 mm Hg in the 64CuCl2 group. To evaluate the compatibility of pO2 measurement in the 64Cu-ATSM and 64CuCl2 groups, the relative frequency of readings ≤2.5, ≤5, and ≤10 mm Hg and the mean and median pO2 were determined on the basis of the cumulative median frequency plots (Supplemental Figs. 2 and 3). In the FaDu tumor–bearing mice, the 64Cu-ATSM group had 64%, 68%, and 77% of measurements ≤2.5 mm Hg, ≤5 mm Hg, and ≤10 mm Hg, respectively. The respective percentages in the 64CuCl2 group were 60%, 64%, and 72%. In the HT29 tumor–bearing mice, the 64Cu-ATSM group had 74%, 78%, and 81% of measurements ≤2.5 mm Hg, ≤5 mm Hg, and ≤10 mm Hg, respectively. The respective percentages in the 64CuCl2 group were 66%, 76%, and 81%.
Intratumoral 64CuCl2 and 64Cu-ATSM Uptake and pO2 Measurements
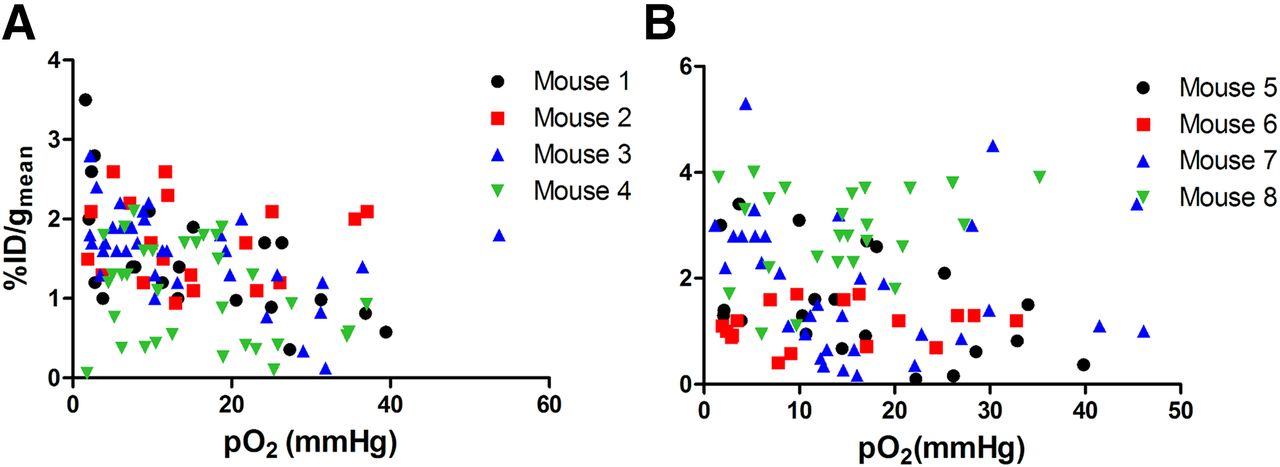
The possible association between the pO2 probe measurements and 64Cu-ATSM and 64CuCl2 uptake in corresponding regions in FaDu and HT29 tumors was evaluated by a linear mixed model (Table 2). We found a significant negative association between pO2 and the mean %ID/g of 64Cu-ATSM in FaDu tumors (P < 0.0001), whereas no significant association was found between pO2 and 64CuCl2 (P = 0.248). In the HT29 tumors, no significant association was found between either 64Cu-ATSM or 64CuCl2 uptake and pO2 (P = 0.590 and P = 0.132, respectively) (Table 2). In FaDu tumors, the association between pO2 and mean 64Cu-ATSM was found to be significant at all time points. The changes in regression coefficients over time were small and nonsystematic (Table 3). Figures 4 and 5 show the relationships between tracer uptake and pO2 at 50–60 min after injection in FaDu and HT29 tumors, respectively.
Regression Coefficients for Effect of pO2 on PET Tracer Uptake
Estimated Effect of pO2 on PET Tracer Uptake at Different Time Points

Comparison between pO2 probe measurements and tracer uptake (mean %ID/g) in FaDu tumor subvolumes. (A) 64Cu-ATSM 50–60 min after injection. (B) 64CuCl2 50–60 min after injection. Number of tumor subvolumes used for analysis was 108 for 64Cu-ATSM and 96 for 64CuCl2.

Comparison between pO2 measurements and tracer uptake (mean %ID/g) in HT29 tumor subvolumes. (A) 64Cu-ATSM 50–60 min after injection. (B) 64CuCl2 50–60 min after injection. Number of tumor subvolumes used for analysis was 102 for 64Cu-ATSM and 127 for 64CuCl2.
DISCUSSION
The mechanism responsible for 64Cu-ATSM retention is not fully understood, and recently there has been a focus on the possible effect of copper metabolism on tumor uptake (16,33). A recent study compared 64Cu-ATSM and 64Cu-acetate uptake in tumor-bearing mice and reported that the two tracers had similar biodistributions (16). Moreover, the immunohistochemical hypoxia marker 2-(2-nitro-1H-imidazol-1-yl)-N-(2,2,3,3,3-pentafluoropropyl)-acetamide (EF5) correlated with the late (16 h), but not the early (15 min and 2 h), intratumoral tracer distribution of both 64Cu-ATSM and 64Cu-acetate (16). It was previously reported that the relationship between 64Cu-ATSM and EF5 accumulation in tumors is dependent on tissue type (25). However, the similarity in biodistribution and tumor uptake shown by 64Cu-acetate and 64Cu-ATSM could indicate that a large fraction of the 64Cu that had initially bound to ATSM dissociated.
In this study, we also found a similar accumulation of copper in kidney, liver, and muscle tissue using 64Cu-ATSM and 64CuCl2 PET. However, in contrast, 64CuCl2 showed a higher uptake than 64Cu-ATSM in both HT29 and FaDu tumors at all time points. Also, different relationships between pO2 and the spatial distribution of 64CuCl2 and 64Cu-ATSM were found. The level of tumor uptake and tumor-to-background ratios of both 64Cu-ATSM and 64CuCl2 found in this study seems to be lower than has previously been reported (14,20,33). However, during the 1-h dynamic scans, the tumor-to-muscle ratios of both 64Cu-ATSM and 64CuCl2 continued to increase and did not reach a plateau. Importantly, the different imaging time points and anesthetic procedures applied in the different studies complicate a direct comparison of results. It has previously been shown that both anesthetics and level of oxygen in anesthetic gas mixtures can influence tissue uptake of both 64Cu-ATSM and copper (16,17). Therefore, to avoid fluctuations in uptake, the level of the anesthetic gas mixture was strictly kept at a constant level during all procedures from tracer injection until completion of pO2 probe measurements. However, the experimental setup has likely contributed to slower accumulation and clearance from the background than would be seen when the tracer is allowed to distribute in an unanesthetized animal (16,17).
A previous study on nude rats with FaDu tumors found no correlation between hypoxia marker, pimonidazole, and intratumoral spatial distribution of 64Cu-ATSM 1 and 18 h after injection (20). In contrast, another study using the same tumor model found that there was no temporal change in the intratumoral distribution of 64Cu-ATSM early (2 h) or late (16 h) after injection and that pO2 probe measurements from different tumor sections corroborated well with PET images (21). This is consistent with our finding of a negative relationship between pO2 probe measurements and the intratumoral spatial distribution of 64Cu-ATSM in FaDu. However, when we performed the same experiment on mice bearing HT29 tumors no relationship was found. A tumor type–dependent difference between intratumoral 64Cu-ATSM accumulation and other hypoxic markers has previously been reported by others, and a study comparing the spatial distribution of 64Cu-ATSM to pimonidazole in mice bearing HT29 tumors also found no relationship (14,25).
pO2 probe measurements are considered the gold standard for determining tissue oxygenation and are therefore an attractive method for evaluating the performance of hypoxia PET tracers. As previously mentioned, however, this approach has some limitations. We used cumulative median frequency plotting to verify a good similarity between the distributions of pO2 readings in the two tumor models before making the comparison with 64Cu-ATSM and 64CuCl2 accumulation. However, one limitation to the oxygen probe is that it cannot distinguish between necrotic and severely hypoxic tissue. Recordings performed on necrotic tumor areas are problematic for the comparison with tracer uptake because these regions consists of nonviable cells unable to accumulate 64Cu-ATSM, which could be interpreted as hypoxic. FaDu and HT29 tumors grown subcutaneously in nude mice are likely to develop central necrosis, and a significant number of the obtained pO2 values were near zero. Therefore, to include only viable tumor tissue, pO2 values below 2 times the measurement accuracy of the probe (<1.5 mm Hg) were excluded from the analysis. Also, as probe insertion is invasive, there is a possibility that it induces changes in oxygenation. Using our setup, there is a risk of inducing changes in microregional tumor oxygenation between the PET scan and the pO2 probe recordings, leading to a mismatch between corresponding measurements. Microregional changes in tumor perfusion (acute hypoxia) could also have the same effect. Moreover, the analysis is sensitive with regard to misalignment between ROIs in PET images and the corresponding pO2 measurements. Even though the tumors were fixed during needle penetration, movement could affect the coregistration, but any effect is likely limited as the ROIs placed on the PET images covered a much larger subvolume of the tumor than the microregional sample volume of the oxygen probe. However, this discrepancy in volume can also induce variation, as uptake from ROIs represents average values of tracer accumulation within larger regions, potentially comprising microregional differences in oxygenation.
Overall, despite conflicting preclinical findings, 64Cu-ATSM is a promising PET tracer because it has shown the ability to predict treatment outcome in small patient studies. However, improved understanding of the tissue-specific selectivity and temporal evolution of distribution, also with regard to in vivo stability, is important for optimal application of the tracer. Moreover, it is not clear whether the preclinical findings can be translated into patients. Therefore, further clinical studies are required on whether tumor uptake of 64Cu-ATSM can be used as a hypoxia marker or, alternatively, to provide other prognostic information.
CONCLUSION
In human head and neck xenografts, 64Cu-ATSM but not 64CuCl2 reflected pO2 measurements, indicating that 64Cu-ATSM is indeed a hypoxia marker in this tumor type. However, data from colorectal cancer xenografts indicated that 64Cu-ATSM may not be a hypoxia marker in all tumor types.
DISCLOSURE
The costs of publication of this article were defrayed in part by the payment of page charges. Therefore, and solely to indicate this fact, this article is hereby marked “advertisement” in accordance with 18 USC section 1734. This work was financially supported by the Lundbeck Foundation, the Novo Nordisk Foundation, the Svend Andersen Foundation, the Arvid Nilsson Foundation, Innovationsfonden, the Research Fund of Rigshospitalet, the Capital Region of Denmark, and the John and Birthe Meyer Foundation. No other potential conflict of interest relevant to this article was reported.
Footnotes
Published online Nov. 19, 2015.
- © 2016 by the Society of Nuclear Medicine and Molecular Imaging, Inc.
REFERENCES
- Received for publication February 17, 2015.
- Accepted for publication October 22, 2015.


