


Article Figures & Data
Figures
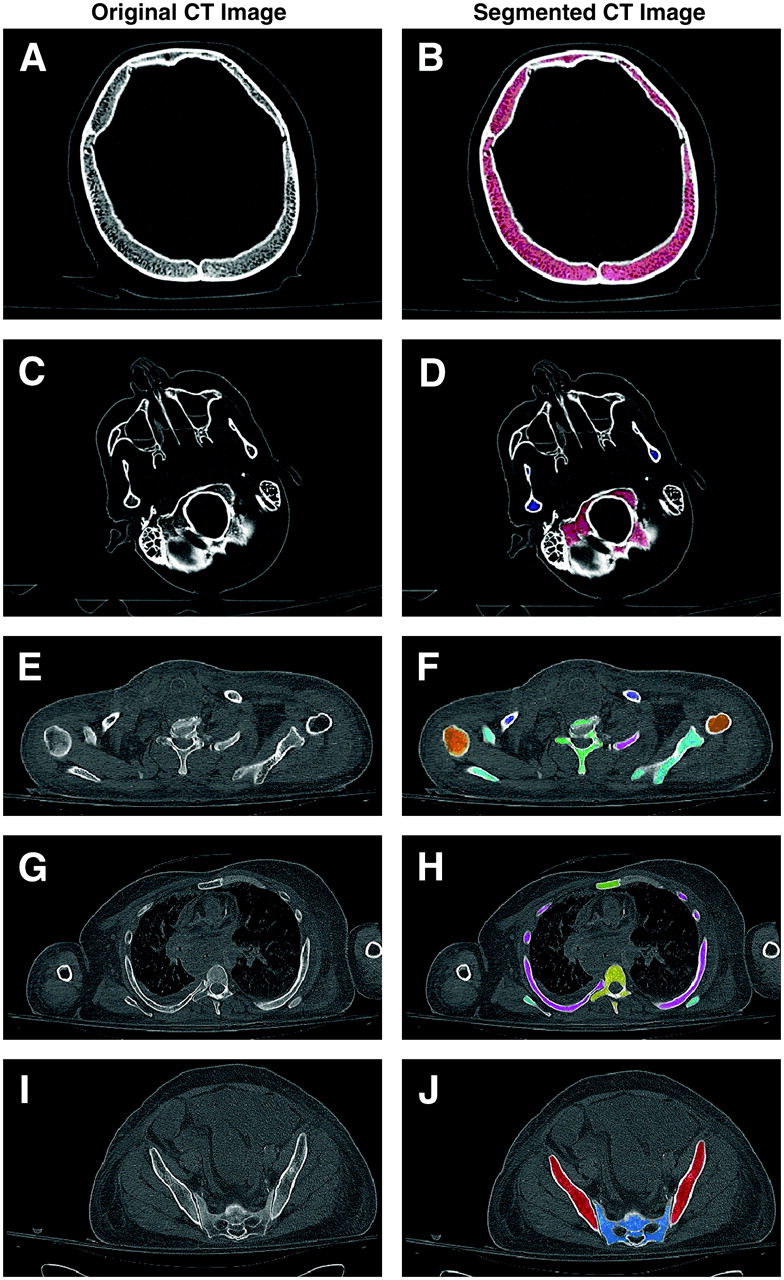
- FIGURE 1.
Comparison of original CT images and corresponding segmented images of skeletal spongiosa within 5 transverse views through 1 study cadaver. (A and B) Superior region of skull (pink: cranium). (C and D) Inferior regions of skull (pink: cranium; blue: mandible). (E and F) Upper torso region (orange: humeral heads; navy blue: clavicles; cyan: scapulae; teal: cervical vertebrae; magenta: ribs). (G and H) Midtorso region (green: sternum; yellow: thoracic vertebrae; cyan: scapulae; magenta: ribs). (I and J) Pelvic region (red: ossa coxae; light blue: sacrum).

Tables
Skeletal site (no. of bones) % of total body active marrow Cranium (1) 7.6 Mandible (1) 0.8 Humeral heads (2) 2.3 Clavicles (2) 0.8 Scapulae (2) 2.8 Sternum (1) 3.1 Ribs (12) 16.1 Cervical vertebrae (7) 3.9 Thoracic vertebrae (12) 16.1 Lumbar vertebrae (5) 12.3 Sacrum (1) 9.9 Proximal femora (2) 6.7 Ossa coxae (2) 17.5 ↵* Table 1 is adapted from Table 9-4 in International Commission on Radiological Protection. Basic Anatomical and Physiological Data for Use in Radiological Protection: Reference Values. New York, NY: International Commission on Radiological Protection; 2002. ICRP Publication 89. Copyright 2002, International Commission on Radiological Protection.
Parameter Abbreviation Measurement (cm) Height HT Total body height Os coxae width OC.W Maximum width of os coxae viewed in CT scout image (projection) Os coxae height OC.H Average of maximum heights of left and right sides of os coxae viewed in CT scout image (projection) Os coxae length OC.L Average of maximum lengths of left and right sides of os coxae viewed in transverse plane of 3D CT dataset Bitrochanteric breadth Bi.B Distance between exterior portions of greater trochanters viewed in CT scout image (projection) Anterior sacral height ASH Distance from anterior sacral promontory to apex of sacrum viewed in sagittal plane of 3D CT dataset Sacral width S.W Maximum width of sacrum viewed in transverse plane of 3D CT dataset L5 thickness L5.T Thickness of L5 vertebra viewed in sagittal plane of 3D CT dataset; measurements were made parallel to anterior surface of vertebral body and approximately 1.5 cm into vertebral body S1 breadth S1.B Distance between 2 most lateral points on superior surface of S1 viewed in transverse plane of 3D CT dataset Femoral head perimeter P Average of maximum perimeters of left and right femoral heads viewed in sagittal plane of 3D CT dataset Feret's diameter FD Measurement is based on femoral head perimeter; this measurement is referred to as caliper length, as it represents longest distance between any 2 points along selected boundary; in this study, perimeter measurement served as this boundary Maximum height of femoral head Max.H Maximum height of femoral head viewed in sagittal plane of 3D CT dataset; each measurement represented average for left and right femoral heads Maximum width of femoral head Max.W Maximum width of femoral head viewed in sagittal plane of 3D CT dataset; each measurement represented average for left and right femoral heads Humeral head breadth HH Distance between exterior portions of right and left proximal humeral heads viewed in CT scout image (projection) Femoral height FH Maximum height of femoral bones viewed in CT scout image (projection); each measurement represented average for left and right femoral bones - TABLE 3
Values for Predictor Variables Obtained from 20 Cadavers for Use in Multiple Regression Analysis*
Cadaver Age at death (y) HT OC.W OC.H OC.L Bi.B ASH S.W L5.T S1.B P FD Max.H Max.W HH FH 1 35 188.2 32.7 23.3 24.5 29.7 11.7 12.7 2.8 6.1 16.1 5.2 4.8 5.3 46.8 52.3 2 66 172.2 28.7 21.8 23.2 26.9 12.9 13.2 2.4 5.5 14.5 4.7 4.5 4.9 35.6 47.7 3 77 156.8 29.7 20.1 20.2 31.0 10.3 11.9 2.2 4.0 12.7 4.1 4.0 3.9 34.1 41.9 4 68 181.2 27.6 21.6 22.0 27.4 10.7 10.8 2.4 5.1 15.3 5.0 4.7 5.1 39.9 50.2 5 81 175.8 29.3 23.1 24.0 28.5 11.4 13.8 2.5 5.8 15.1 4.9 4.5 5.0 38.6 48.5 6 72 165.2 27.6 21.3 22.0 29.9 10.4 11.6 2.4 5.5 14.7 4.7 4.5 4.7 38.9 47.4 7 70 159.1 33.6 20.1 20.5 30.3 9.2 12.9 2.5 4.7 12.8 4.2 3.9 4.2 38.6 42.8 8 62 157.5 26.3 20.0 20.1 24.6 8.5 11.7 2.4 5.0 12.4 4.1 3.7 4.0 33.3 43.0 9 67 171.1 31.5 21.3 21.8 27.9 11.3 13.1 2.8 5.6 14.6 4.8 4.3 4.7 38.7 47.3 10 78 175.0 33.6 22.5 23.2 28.5 12.5 12.0 2.7 5.6 14.9 4.8 4.4 4.9 41.3 49.3 11 82 162.9 32.3 20.5 21.0 27.2 10.5 12.5 2.2 5.7 13.2 4.4 3.9 4.3 38.4 46.0 12 78 149.9 28.3 19.7 20.0 27.1 10.1 11.4 2.6 5.4 12.7 4.1 3.9 4.1 34.7 41.4 13 73 159.6 30.3 20.8 20.8 28.2 13.2 12.5 2.3 4.6 13.2 4.3 4.3 4.2 34.8 43.0 14 76 165.0 23.6 20.9 20.9 24.9 10.2 10.9 2.6 4.9 13.6 4.4 4.1 4.5 34.7 42.6 15 68 168.0 32.0 20.3 20.6 26.7 12.1 13.7 2.3 5.6 12.0 3.9 3.6 3.9 35.9 45.5 16 80 158.4 31.2 20.3 20.4 31.1 8.7 11.9 2.5 5.1 12.4 4.0 3.8 3.9 35.9 42.6 17 75 156.9 33.8 21.1 21.6 28.3 12.1 13.7 2.1 3.7 12.2 4.1 3.4 4.0 34.7 44.4 18 75 165.0 30.5 20.6 20.6 31.8 11.2 12.8 2.7 4.8 12.8 4.2 4.1 4.2 35.4 43.3 19 40 169.2 26.0 20.0 20.3 26.0 11.8 11.7 2.1 4.8 12.3 4.0 4.1 4.1 38.4 43.3 20 73 168.6 30.3 21.2 21.4 31.2 11.8 12.5 2.3 4.6 13.5 4.4 4.2 4.1 41.1 46.7 ↵* Abbreviations are explained in Table 2. All measurements are given in centimeters.
Selection method Multiple R2 Variable Coefficient Coefficient estimate Coefficient P Stepwise 0.88 Intercept 
−4,791.3 <0.001 OC.W −37.1 0.033 OC.H 313.9 0.002 Max.W 266.9 0.188 Adjusted R2 0.89 Intercept −4,449.7 <0.001 OC.W −41.7 0.024 OC.H 315.2 0.003 Max.W 430.0 0.110 Max.H −230.2 0.333 AICc and BIC 0.87 Intercept −5,585.5 <0.001 OC.W −46.3 0.006 OC.H 420.6 <0.001 TSSV (cm3) Prediction interval (cm3) Cadaver Segmented Predicted % Difference Lower Upper 1 2,493.20 2,829.22 12.3 2,361.11 3,238.37 2 2,151.14 2,252.10 5.4 1,865.49 2,667.37 3 1,265.24 1,498.80 19.9 1,135.63 1,898.27 4 2,380.45 2,179.13 −7.6 1,802.32 2,598.67 5 2,852.19 2,739.06 −3.9 2,288.72 3,194.71 6 2,256.33 2,054.81 −7.9 1,684.09 2,471.77 7 1,364.31 1,302.17 −4.9 864.82 1,731.79 8 1,426.07 1,604.50 15.4 1,240.51 2,051.06 9 2,300.99 1,885.72 −18.0 1,554.46 2,219.14 10 2,318.72 2,344.98 0.2 1,889.39 2,757.00 11 1,410.27 1,556.40 10.5 1,156.99 1,959.10 12 1,354.31 1,364.80 3.1 981.01 1,810.94 13 1,764.06 1,749.00 −0.2 1,364.34 2,155.29 14 2,137.16 2,035.88 −1.7 1,631.36 2,569.59 15 1,585.72 1,450.49 −8.2 1,051.16 1,859.43 16 1,661.10 1,482.29 −10.2 1,097.15 1,886.21 17 1,788.23 1,724.12 −4.2 1,296.50 2,128.45 18 1,590.72 1,661.02 5.1 1,276.67 2,066.95 19 1,716.77 1,814.37 −6.7 1,181.14 2,022.66 20 1,605.73 1,937.73 21.2 1,594.54 2,297.44 Skeletal site % Active bone marrow† % Marrow cellularity‡ % Total bone marrow (ICRP adult) Mean ± SD % TSSV (present study) Cranium 7.6 38 10.4 9.3 ± 1.55 Mandible 0.8 38 1.1 1.0 ± 0.15 Scapulae 2.8 38 3.8 3.9 ± 0.38 Clavicles 0.8 33 1.3 1.5 ± 0.14 Sternum 3.1 70 2.3 2.1 ± 0.25 Ribs 16.1 70 12.0 9.3 ± 0.77 Cervical vertebrae 3.9 70 2.9 2.5 ± 0.15 Thoracic vertebrae 16.1 70 12.0 11.9 ± 0.52 Lumbar vertebrae 12.3 70 9.1 10.1 ± 0.64 Sacrum 9.9 70 7.4 7.5 ± 0.53 Ossa coxae 17.5 48 19.0 22.5 ± 1.04 Femora (proximal) 6.7 25 14.0 12.8 ± 0.50 Humeri (proximal) 2.3 25 4.8 5.5 ± 0.24 ↵* For comparison, data on percentage distribution of total bone marrow for ICRP reference adult (male or female; age, 40 y) are shown.
↵† Data are from Table 40 in International Commission on Radiological Protection (21).
↵‡ Data are from Table 41 in International Commission on Radiological Protection (21).


