


Article Figures & Data
Figures
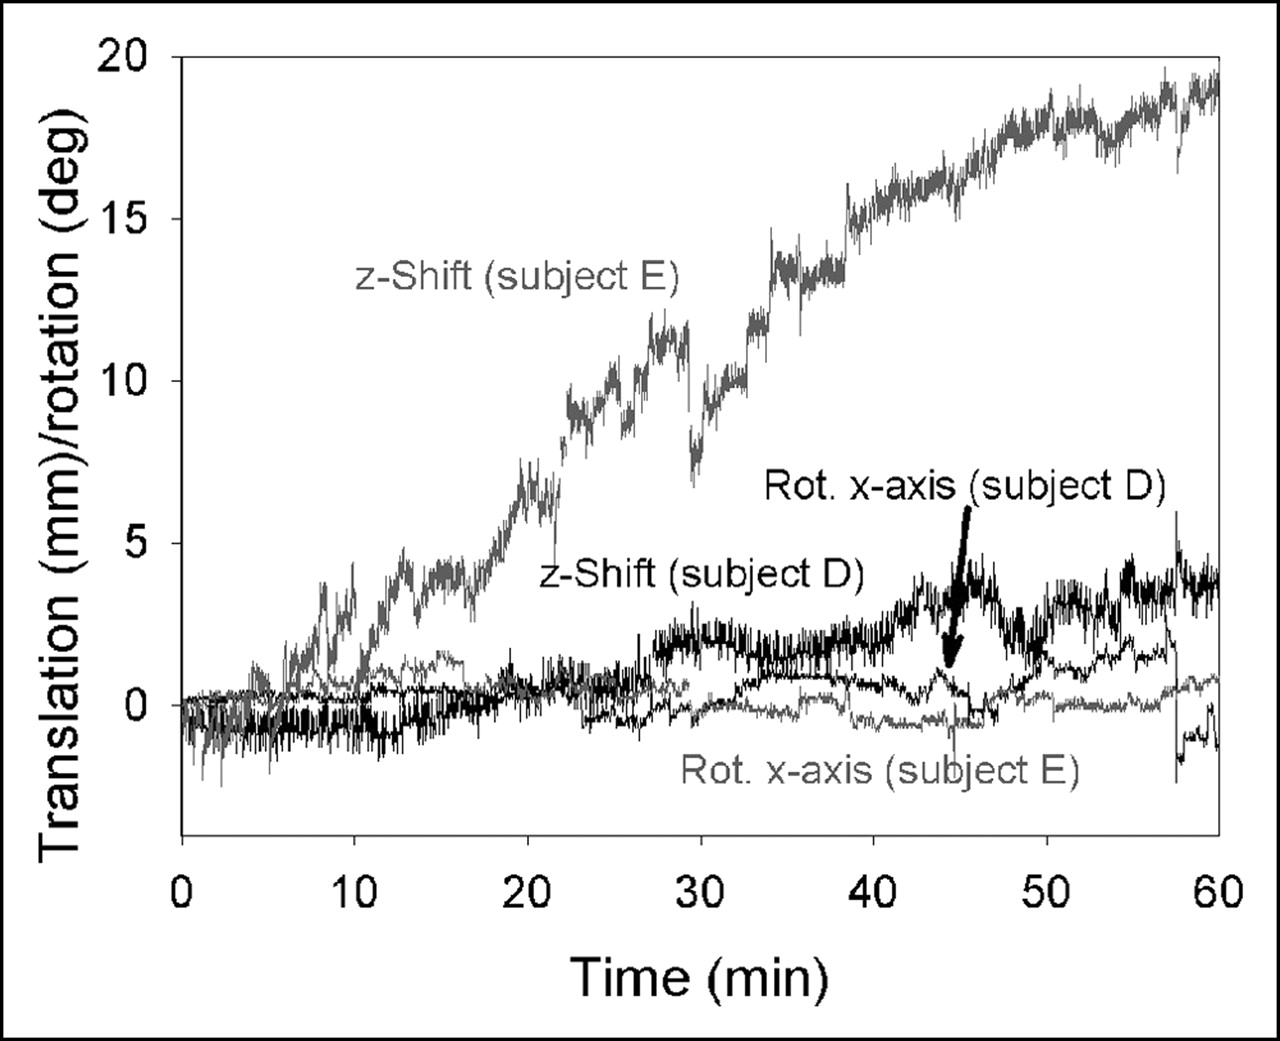
- FIGURE 1.
Motion recordings of subject D (black) and subject E (gray) with 2 different extents of z-shift. Movements become worse at end of scan. Rot. = rotation around.
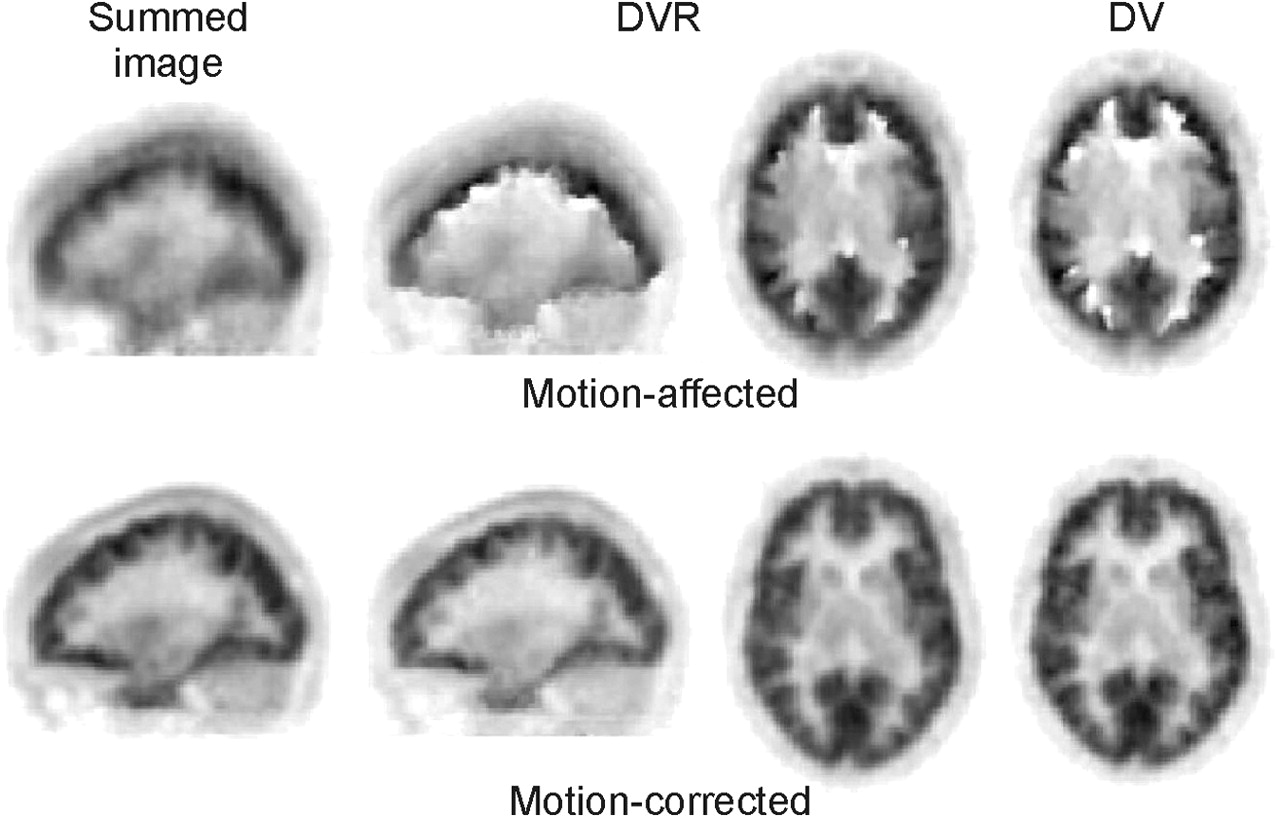
- FIGURE 2.
Summed images (sagittal view, 60 min) of cerebral distribution of 18F-altanserin in subject E before and after motion correction, corresponding DVR images in sagittal and transverse orientations, and DV images in transverse view.
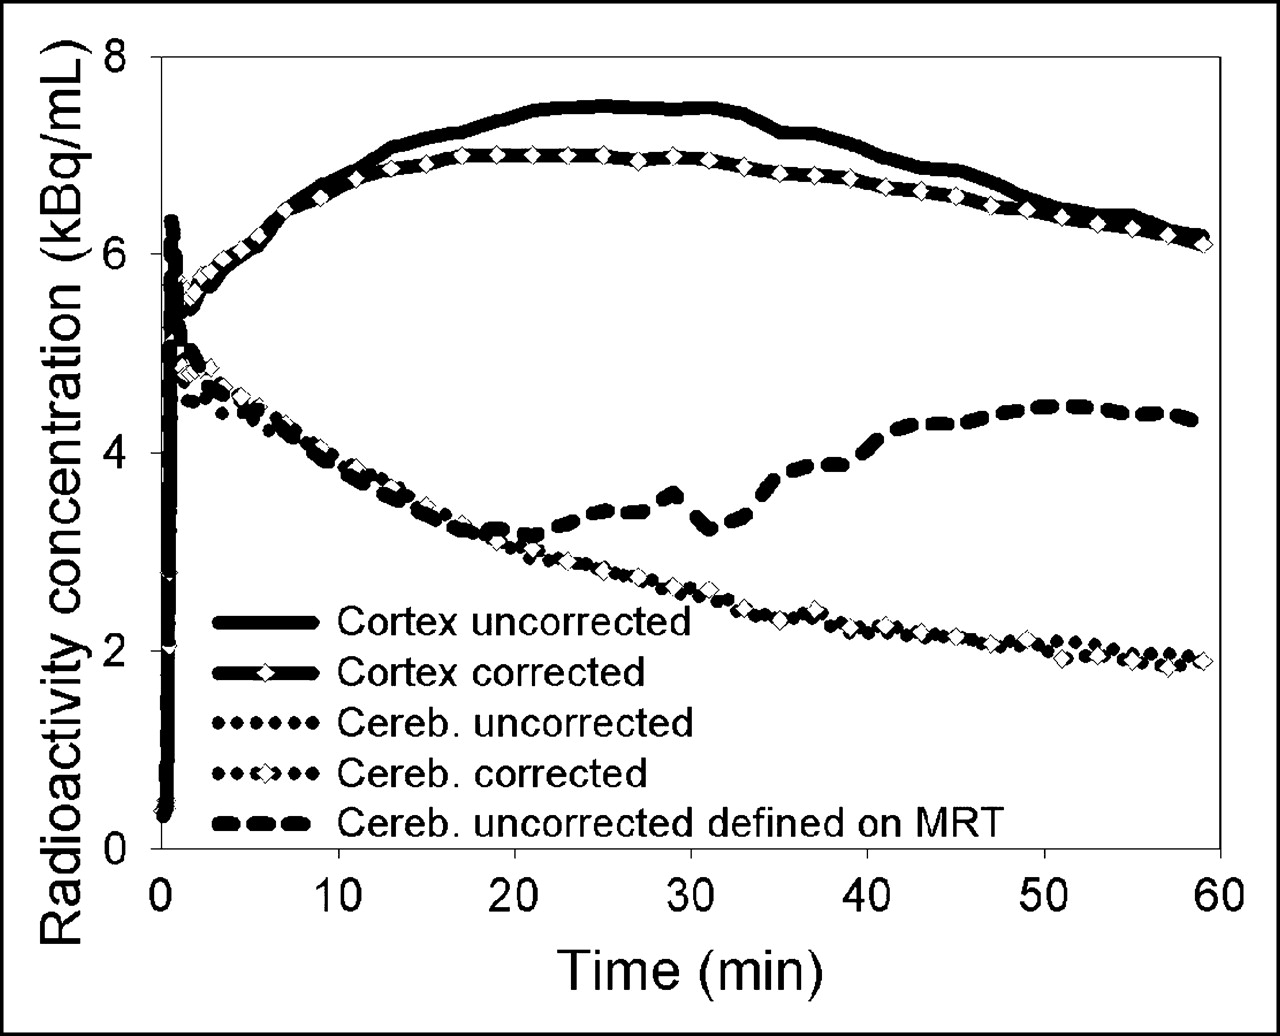
- FIGURE 3.
Cortical and cerebellar (cereb.) time–activity curves for subject E before and after motion correction. The different cerebellar time–activity curves were obtained by defining their VOIs in 2 different ways, as described in the text.
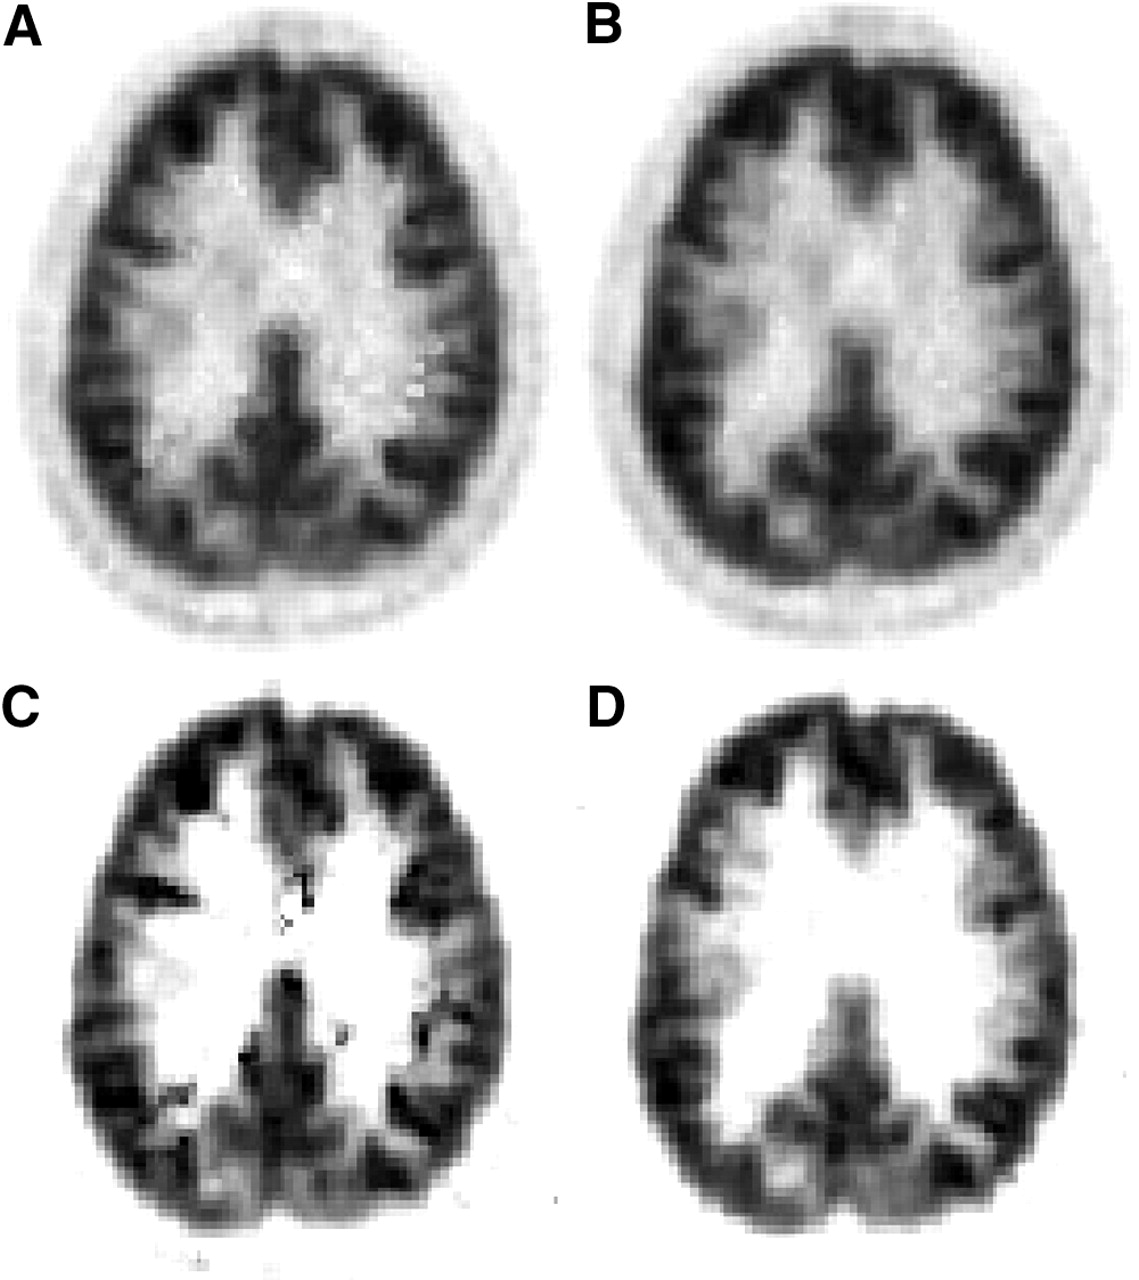
- FIGURE 4.
DVR (A and B) and BP (C and D) images obtained via noninvasive Logan plot and noninvasive Ichise-MRTM2 plot, respectively, before (A and C) and after (B and D) motion correction. These data were measured in subject D.
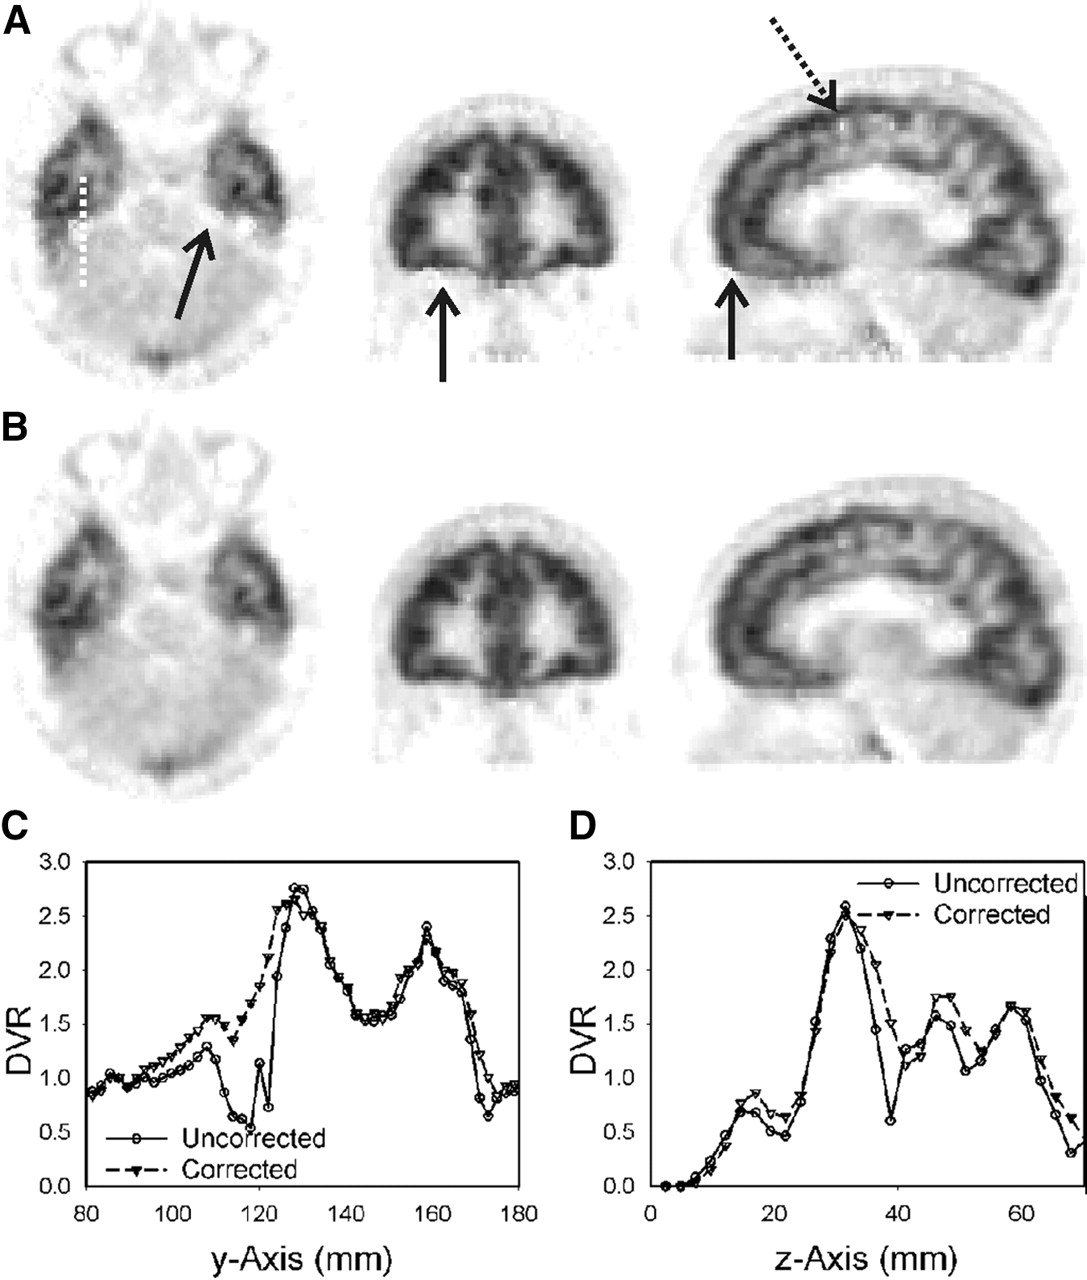
- FIGURE 5.
(A and B) Comparison of DVR images in subject A before (A) and after (B) motion correction. Discontinuities and single spots in uncorrected data are indicated by arrows. On corrected images, gradual changes are found where artifacts are visible in uncorrected data. (C) Profiles belonging to dotted white line crossing temporal lobe. (D) Profiles crossing single light spot, which is indicated by dotted arrow, in vertical direction.
- FIGURE 6.
DVR images based on simulated dynamic 18F-altanserin study free from counting-rate noise: motion-free data (A); data with motion conditions SM1 (B), SM2 (C), SM3 (D), and SM4 (E).
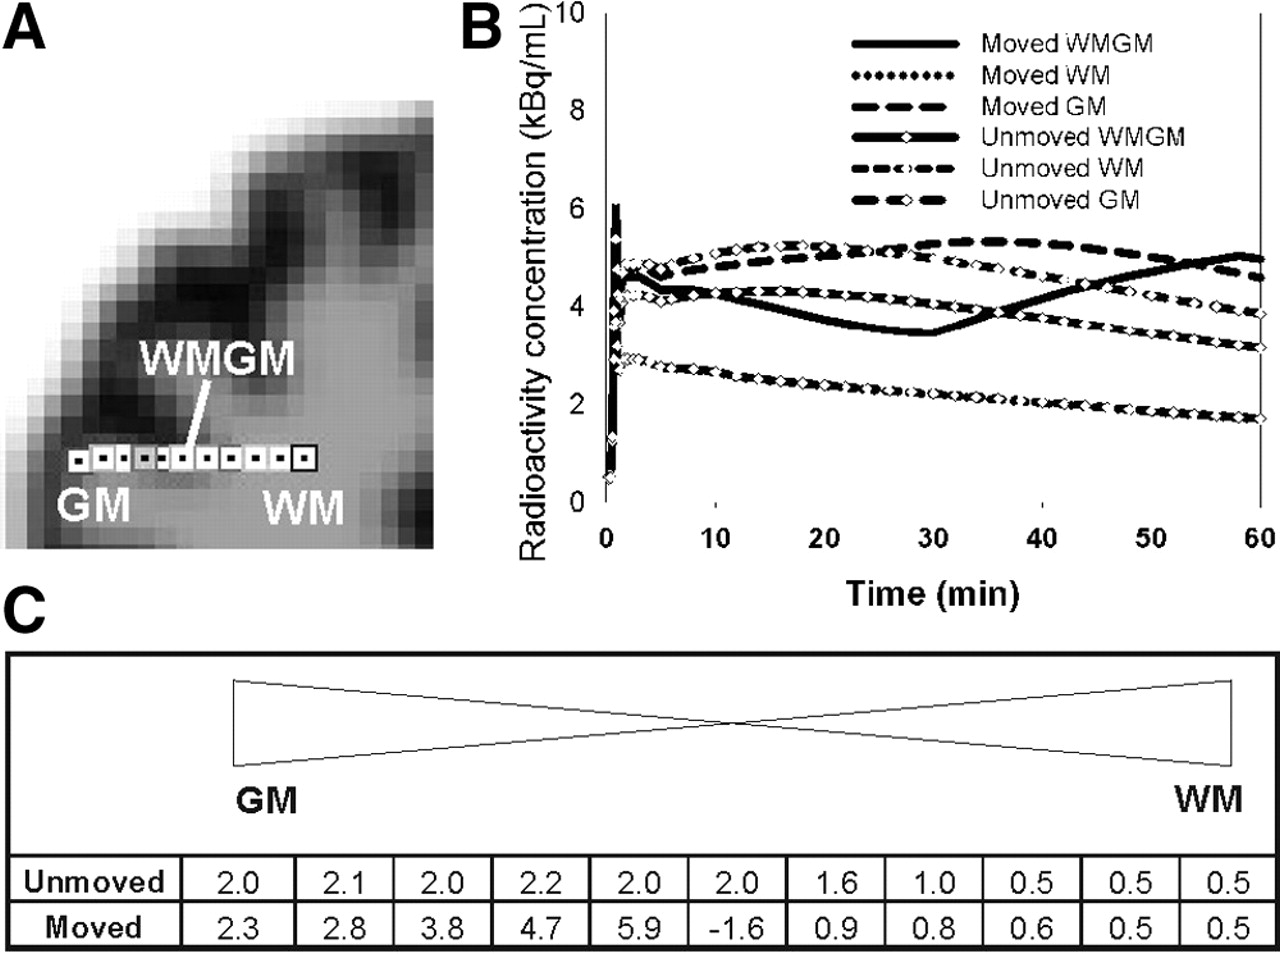
- FIGURE 7.
(A and B) Single voxels defined in brain area ranging from gray matter (GM) to white matter (WM) (A) and corresponding time–activity curves (B) of GM, WM, and mixed tissue (WMGM) voxels superimposed on simulated dynamic 18F-altanserin images with and without motion. Time–activity curves of WM for data with and without motion overlap completely. (C) DV values resulting from Logan plot analysis of time–activity curves for data with and without motion.


Tables
Subject Translation (mm) Rotation (degrees) x-axis y-axis z-axis x-axis y-axis z-axis A −2.6 −2.4 2.5 2.3 −0.7 −0.9 B 1.7 2.3 −2.0 2.7 −1.0 0.6 C 1.3 −2.0 −2.6 −1.0 0.4 0.2 D 1.2 −2.8 6.0 2.8 1.1 −0.4 E 2.3 −3.0 19.7 −2.2 −2.7 2.2 F −2.0 −2.6 2.6 −3.3 1.5 −0.4 z-axis is subject’s longitudinal axis.
In this issue


Jump to section
Related Articles
Cited By...
- Validation and Evaluation of a Vendor-Provided Head Motion Correction Algorithm on the uMI Panorama PET/CT System
- Assessment of Motion Bias on the Detection of Dopamine Response to Challenge
- An Efficient Approach to Perform MR-Assisted PET Data Optimization in Simultaneous PET/MR Neuroimaging Studies
- Test-Retest Reliability of the SERT Imaging Agent 11C-HOMADAM in Healthy Humans
- PET/MRI for Neurologic Applications
- Methods for Motion Correction Evaluation Using 18F-FDG Human Brain Scans on a High-Resolution PET Scanner
- Effect of Patient Arm Motion in Whole-Body PET/CT
- MRI-Assisted PET Motion Correction for Neurologic Studies in an Integrated MR-PET Scanner
- Establishment of In Vivo Brain Imaging Method in Conscious Mice
- Movement Correction Method for Human Brain PET Images: Application to Quantitative Analysis of Dynamic 18F-FDDNP Scans
- Correction of Head Movement on PET Studies: Comparison of Methods