

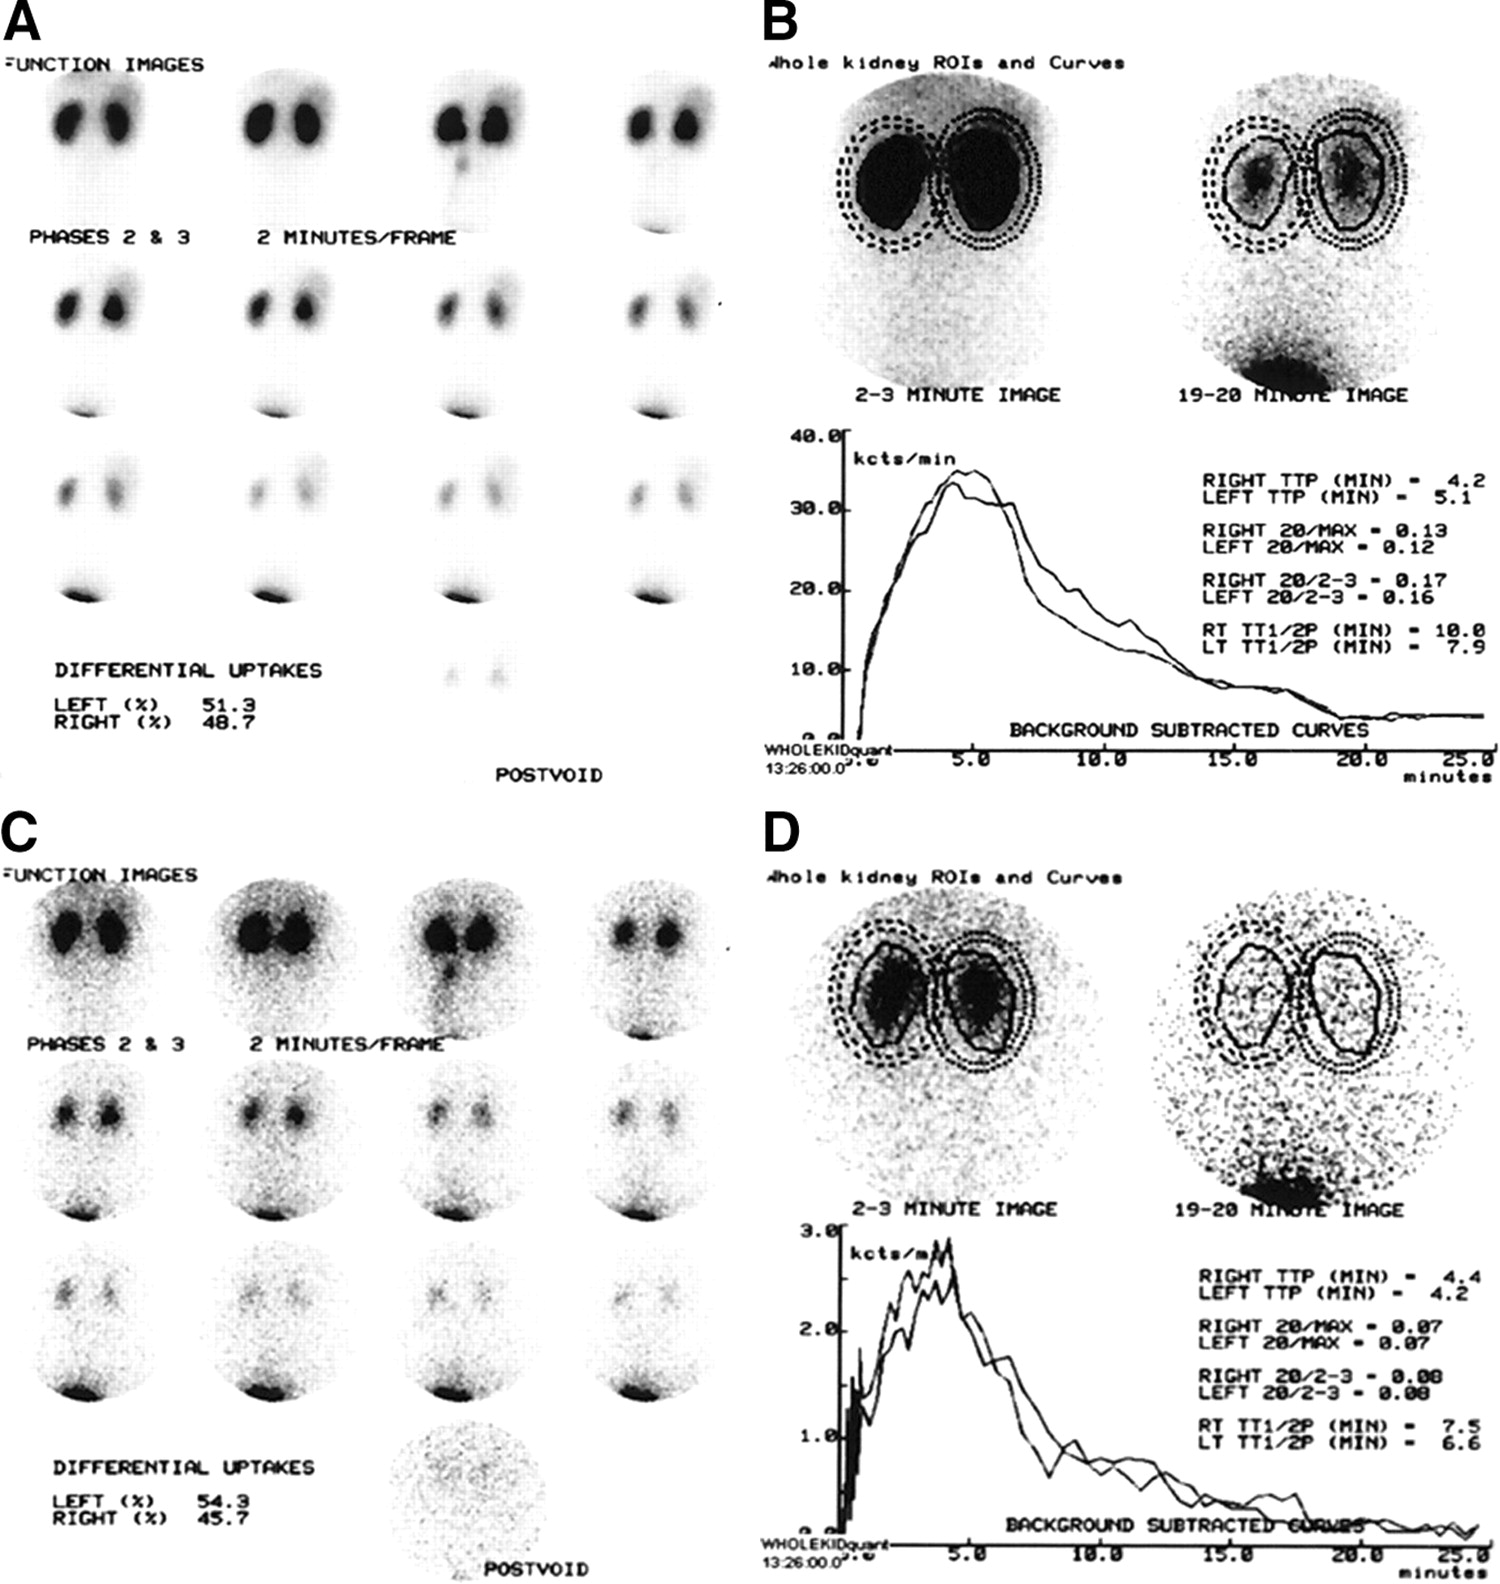
FIGURE 3.

Data were acquired in 1 volunteer after simultaneous injection of 69.93 MBq (1.89 mCi) syn-99mTc-d-MAEC and 11.47 MBq (0.31 mCi) 131I-OIH; postvoid images were acquired ∼30 min after injection. The 2-min syn-99mTc-d-MAEC images (A) and renogram curves (B) can be compared with simultaneously acquired 131I-OIH images (C) and renogram curves (D). (A) Sequential 2-min images after injection of 69.93 MBq (1.89 mCi) syn-99mTc-d-MAEC; differential (relative) uptake is 51.3% in left kidney and 48.7% in right kidney. Final image is postvoid image obtained ∼30 min after injection. (B) Renogram curves and curve parameters based on whole kidney ROIs assigned over kidneys in A. Whole kidney and background ROIs are superimposed over the 2- to 3- and 19- to 20-min images at top. TTP refers to time-to-peak height of renogram curve and values are expressed in minutes; 20/max expression refers to ratio of counts at 20 min divided by maximum counts; 20/2–3 expression refers to ratio of counts at 19–20 min divided by counts at 2–3 min; TT1/2P refers to time (minutes) for counts in renogram curve to fall to half of peak value. RT = right; LT = left. (C) Sequential 2-min images after injection of 11.47 MBq (0.31 mCi) 131I-OIH. 131I-OIH images were acquired simultaneously as syn-99mTc-d-MAEC images in A. Differential (relative) uptake is 54.3% in left kidney and 45.7% in right kidney. Final image is postvoid image obtained ∼30 min after injection. (D) Renogram curves and curve parameters based on whole kidney ROIs assigned over kidneys in A and applied to 131I-OIH image data (C). Whole kidney and background ROIs are superimposed over 2- to 3- and 19- to 20-min images at top. TTP, 20/max expression, 20/2–3 expression, and TT1/2P are as described in B.
In this issue


Related Articles
Cited By...
- Preclinical Evaluation of 99mTc(CO)3-Aspartic-N-Monoacetic Acid, a Renal Radiotracer with Pharmacokinetic Properties Comparable to 131I-o-Iodohippurate
- Synthesis and In Vivo Evaluation of p-18F-Fluorohippurate as a New Radiopharmaceutical for Assessment of Renal Function by PET
- 99mTc(CO)3(NTA): A 99mTc Renal Tracer with Pharmacokinetic Properties Comparable to Those of 131I-OIH in Healthy Volunteers
- 99mTc(CO)3-Nitrilotriacetic Acid: A New Renal Radiopharmaceutical Showing Pharmacokinetic Properties in Rats Comparable to Those of 131I-OIH
- First Evaluation of a 99mTc-Tricarbonyl Complex, 99mTc(CO)3(LAN), as a New Renal Radiopharmaceutical in Humans