


Article Figures & Data
Figures
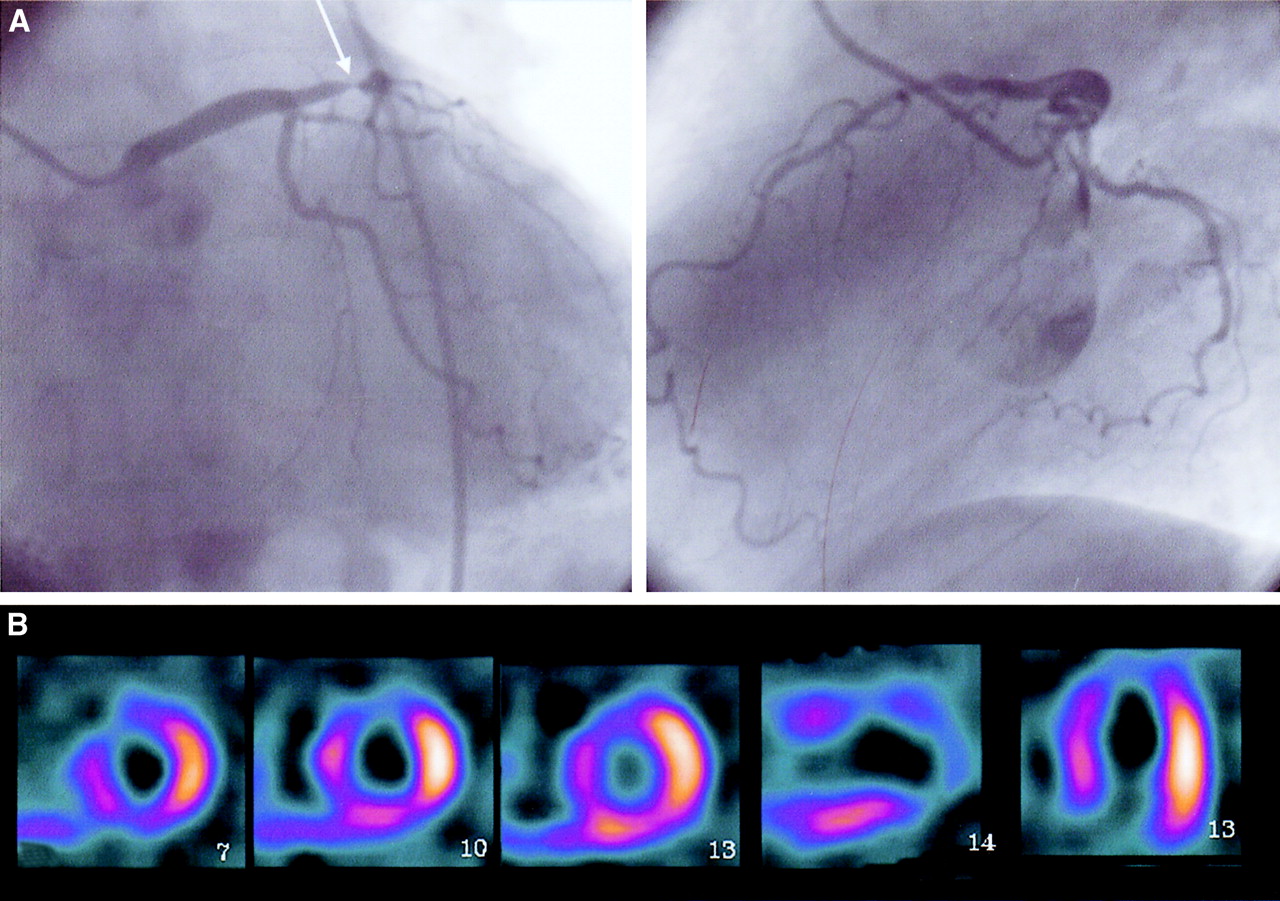
- FIGURE 1.
(A) Biplane coronary angiograms from patient with left anterior descending artery (LAD) stenosis. Location of stenosis is marked with arrow. (B) Original SPECT perfusion images of same patient as in A, with radionuclide injected during total balloon occlusion of LAD. SPECT images are serial short-axis slices taken from near the apex (left) through the basal left ventricular region (middle), vertical long-axis, and horizontal long-axis sections. A large perfusion abnormality is seen in anterior and septal walls of left ventricle.
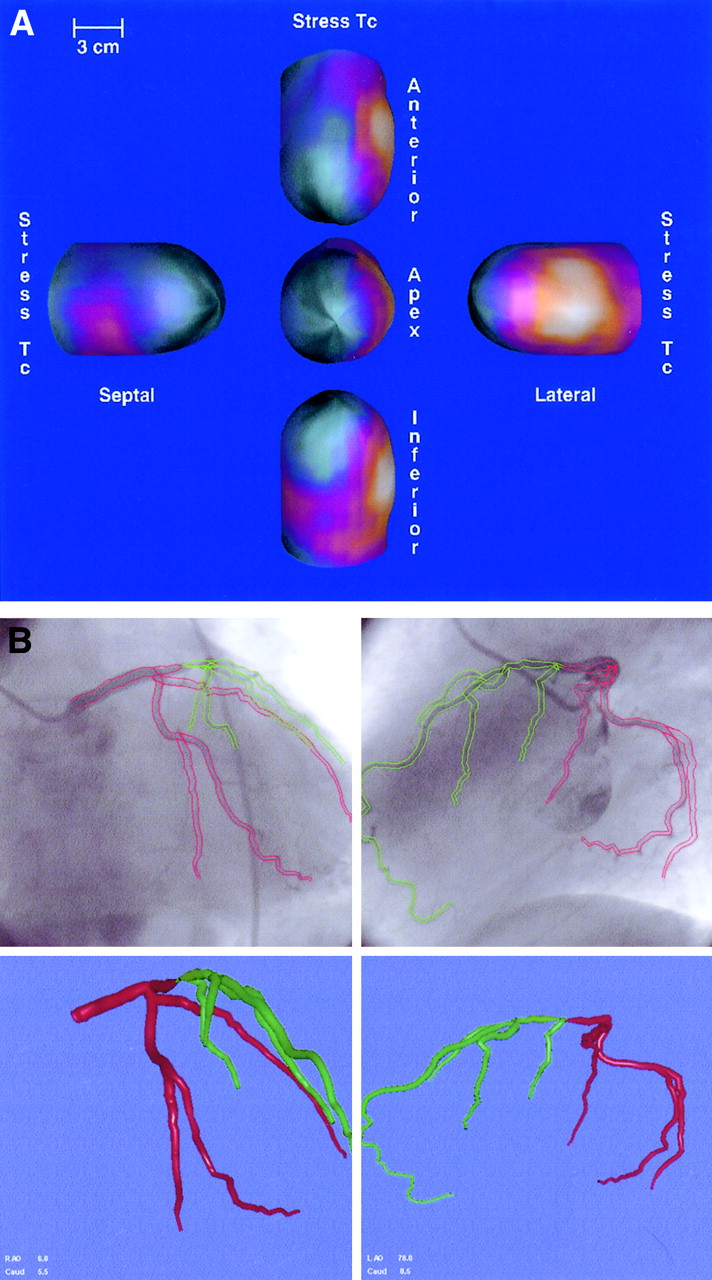
- FIGURE 2.
Three-dimensional models created from original images. (A) Five views of the 3D LV epicardial surface color coded for perfusion. These are 3D models corresponding to original images shown in Figure 1. Note perfusion defect in anteroseptal wall as represented by green and blue regions. (B) Three-dimensional left coronary artery tree (bottom right), created after boundary detection of arteries on angiograms (top left and right). Tree is color coded green distal to occlusion. This is same patient as shown in Figure 1.
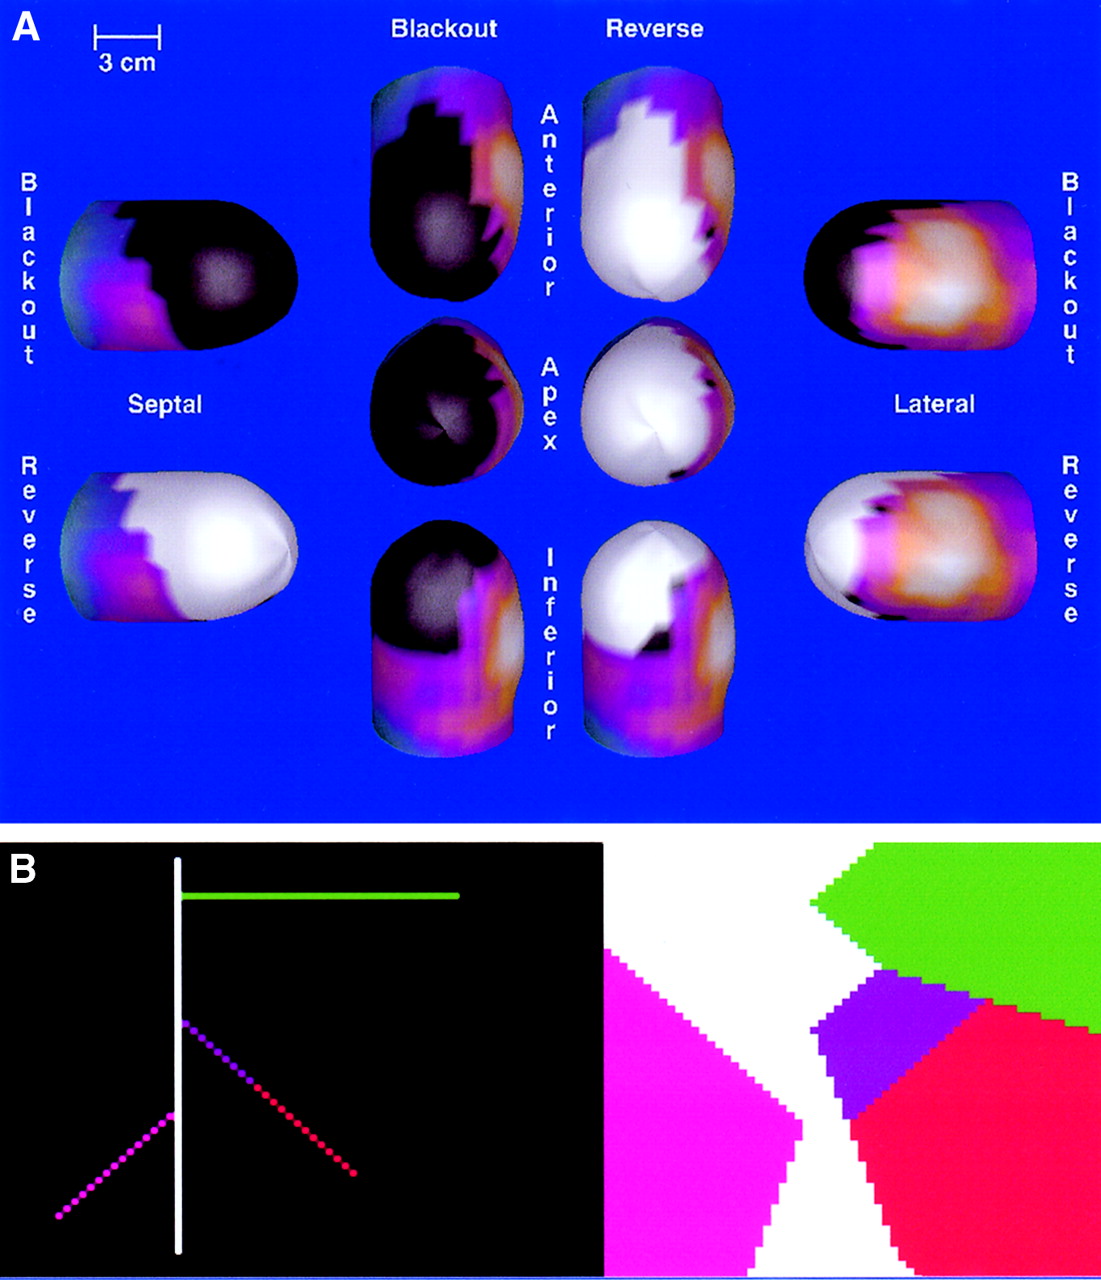
- FIGURE 3.
Physiologic and anatomic areas at risk. (A) Abnormal perfusion at stress (blacked-out regions) and areas that normalize at rest (whited-out regions). Whited-out regions are those that are at risk for myocardial infarction. In this patient population, blacked-out and whited-out areas are the same, since perfusion abnormality is in essence temporarily caused by the revascularization procedure, and revascularization then provides normal perfusion. This is same patient as shown in Figure 1. (B) Territories of left ventricle supplied by each coronary artery. Left and right pictures should be superimposed but are separated for sake of clarity. The left picture shows coronary artery as it would look if the left ventricle were flattened into 2D plane. Regions shown on the right picture are those areas that are closer to the artery of the same color than to any other artery. Thus, the green area in the right picture is supplied by the green artery in the left picture. The red area in the right picture corresponds to the portion of the artery that has had an occlusion placed in it. Thus, this is the area at risk for myocardial infarction, as determined by this model of coronary arteries and their territories. Mass of this area is then computed to obtain anatomic mass at risk.
- FIGURE 4.
Mass at risk can be measured by perfusion abnormalities alone (physiologic mass at risk) and by coronary anatomy alone (anatomic mass at risk). Because in this study, we have induced the perfusion abnormality by creating anatomic occlusion in patients with single-vessel disease, these regions should overlap. Any error in overlap may be attributed to errors in unification.
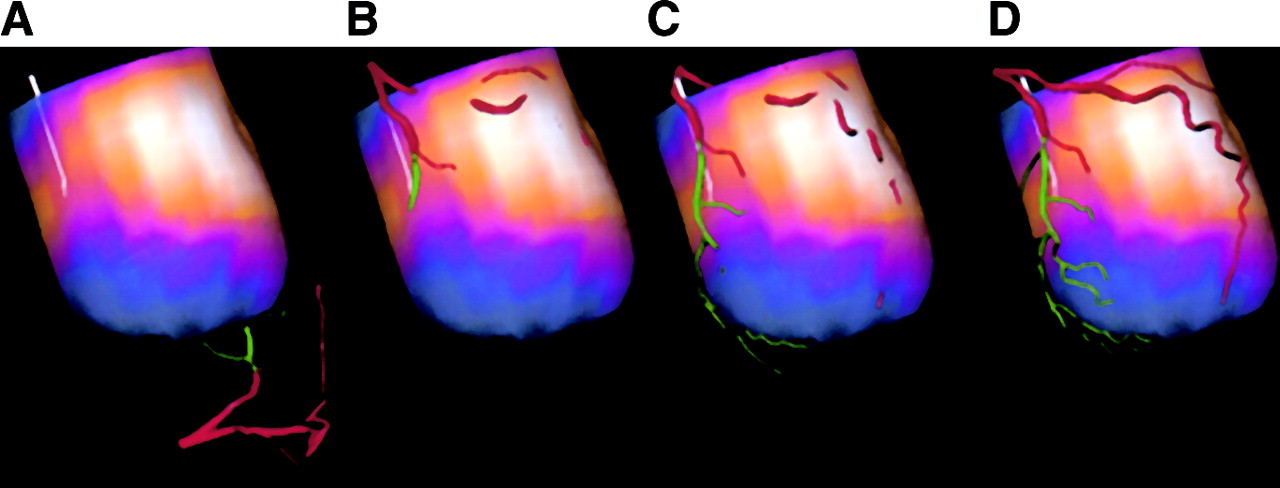
- FIGURE 5.
Successive steps of unification on patient study. Epicardial surface is color coded for perfusion. White line indicates anterior interventricular groove. (A) Original artery tree and epicardial surface positions. (B) Alignment after initial positioning. (C) Registration after ICP algorithm. (D) Final alignment after nonlinear warping.
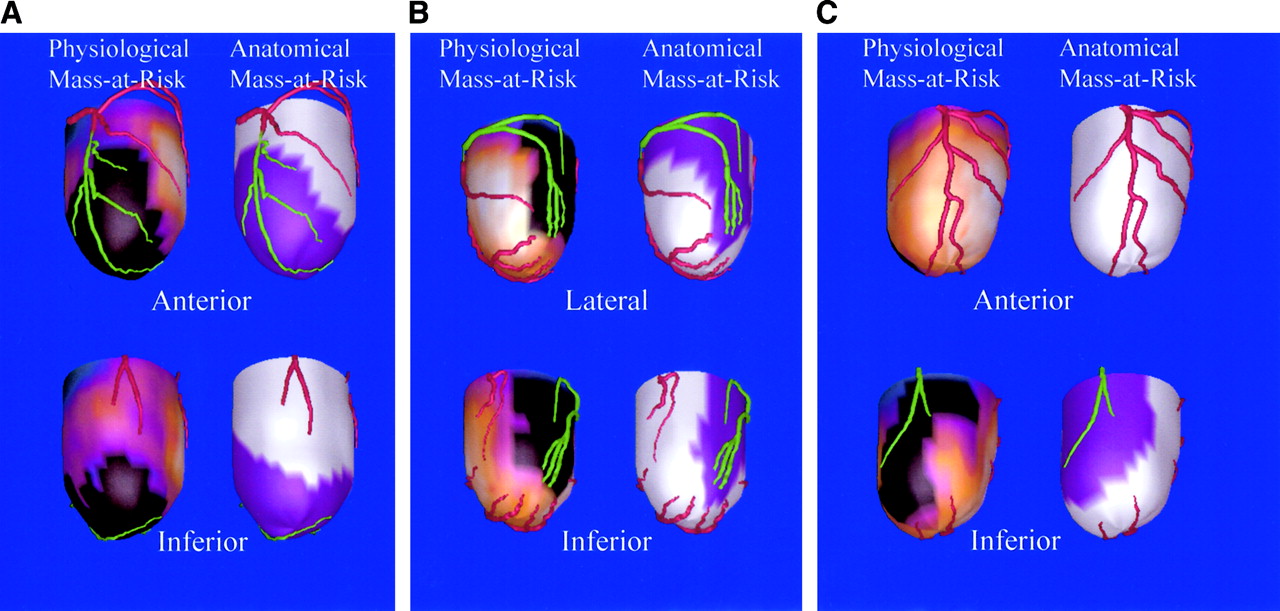
- FIGURE 6.
Unified models from patients with LAD stenosis (A), LCx stenosis (B), and RCA stenosis (C). For each example, 2 views are shown (top and bottom), and both 3D blackout maps and 3D anatomic mass-at-risk maps are shown for each view. Black regions on blacked-out model indicate those regions that are at risk based on perfusion information alone. Purple regions on at-risk models indicate those regions that are at risk based on coronary artery anatomy and its registration with epicardium. Overlap of black and purple regions indicates goodness of unification.
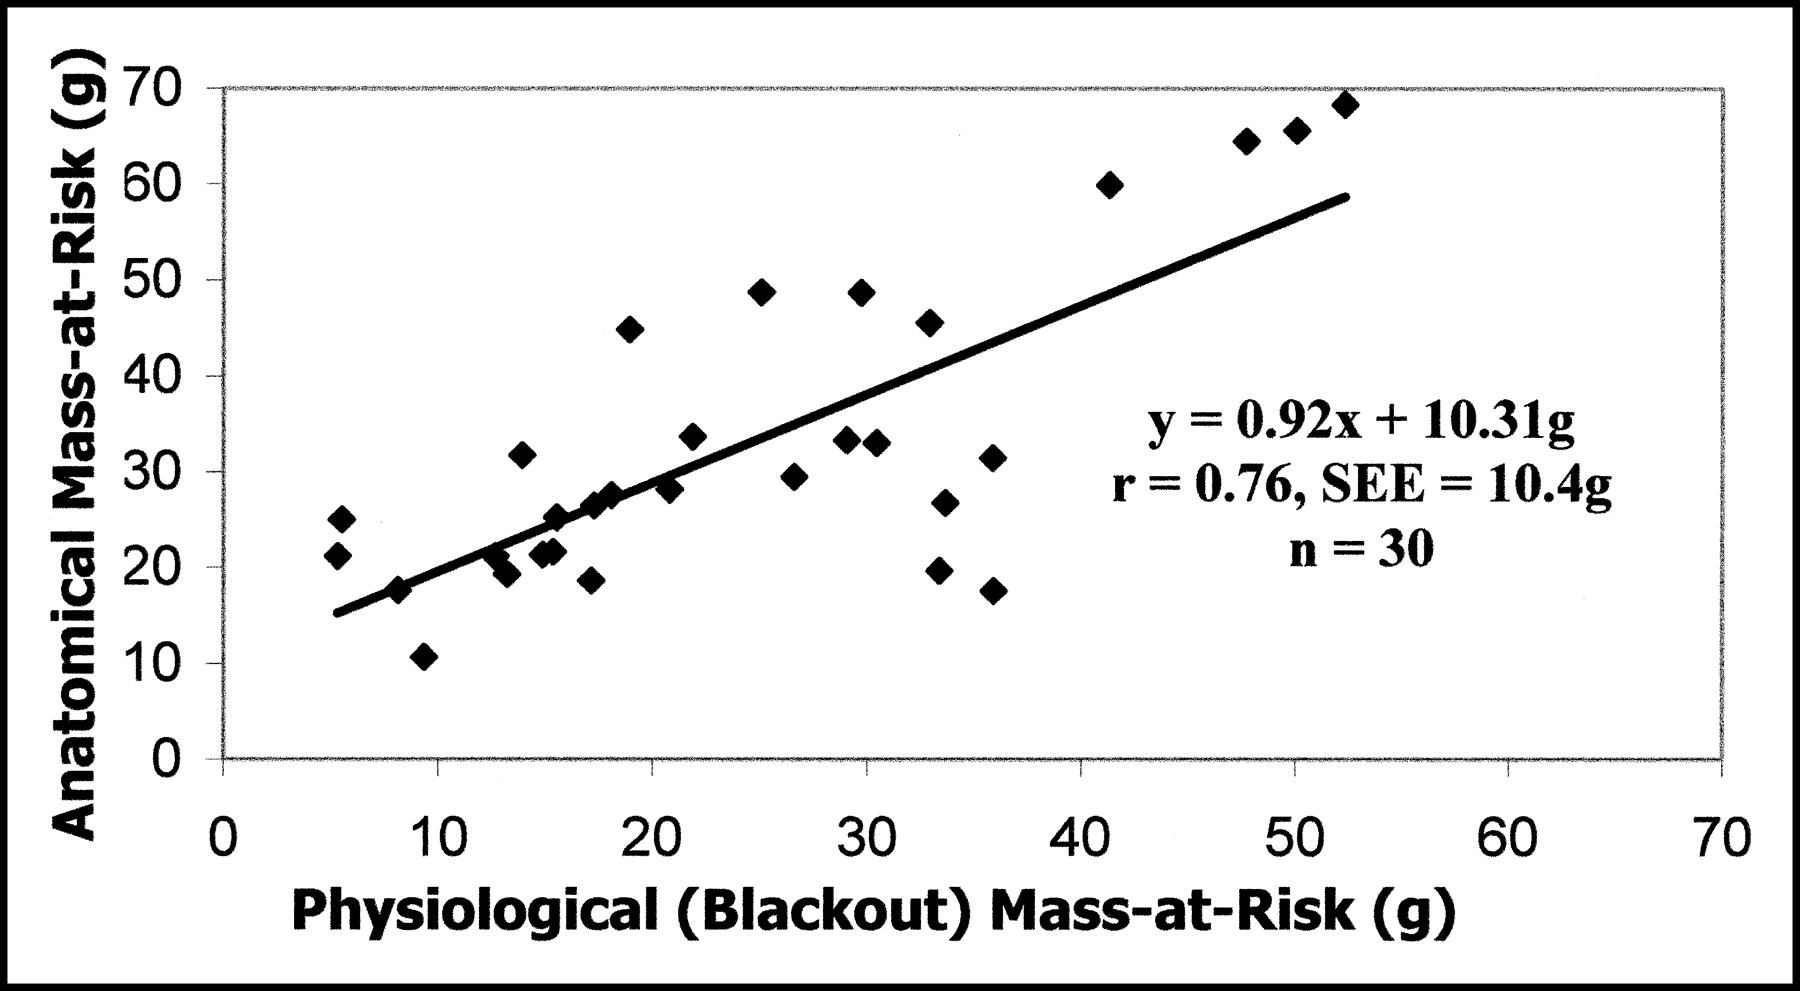
- FIGURE 7.
Anatomic mass at risk computed from coronary artery anatomy vs. physiologic mass at risk computed from perfusion quantification.


In this issue


Jump to section
Related Articles
Cited By...
- Display of 3D Multimodality Cardiac Images With 2D Polar Maps: Simplicity Can Be a Virtue
- 3D Fusion of LV Venous Anatomy on Fluoroscopy Venograms With Epicardial Surface on SPECT Myocardial Perfusion Images for Guiding CRT LV Lead Placement
- Definition of Vascular Territories on Myocardial Perfusion Images by Integration with True Coronary Anatomy: A Hybrid PET/CT Analysis
- Quantitative Analysis of Myocardial Perfusion SPECT Anatomically Guided by Coregistered 64-Slice Coronary CT Angiography
- Dual-phase multi-detector computed tomography assesses jeopardised and infarcted myocardium subtending infarct-related artery early after acute myocardial infarction
- Correspondence Between the 17-Segment Model and Coronary Arterial Anatomy Using Contrast-Enhanced Cardiac Magnetic Resonance Imaging
- Cardiac Image Fusion from Stand-Alone SPECT and CT: Clinical Experience
- Integrated Single-Photon Emission Computed Tomography and Computed Tomography Coronary Angiography for the Assessment of Hemodynamically Significant Coronary Artery Lesions
- PET/CT: Challenge for Nuclear Cardiology