


Abstract
This study was implemented to compare the value of PET, CT, and dual-modality PET/CT imaging for assessing gastrointestinal stromal tumor (GIST) response to imatinib therapy. Methods: Twenty patients with histologically proven GIST underwent 18F-FDG PET/CT imaging before and 1, 3, and 6 mo after the start of imatinib therapy. Separate PET and CT datasets, side-by-side PET and CT datasets, and fused PET/CT images were evaluated according to World Health Organization, Response Evaluation Criteria in Solid Tumors, and European Organisation for Research and Treatment of Cancer criteria for therapy response. Hounsfield units (HU) were assessed on CT images. A mean follow-up period of 381 ± 134 d served as the standard of reference. Results: The numbers of lesions detected in all patients were 135 with PET, 249 with CT, 279 on side-by-side evaluation, and 282 on fused PET/CT images. Tumor response was correctly characterized in 95% of patients after 1 mo and 100% after 3 and 6 mo with PET/CT. PET and CT images viewed side by side were correct in 90% of patients at 1 mo and 100% at 3 and 6 mo. PET accurately diagnosed tumor response in 85% of patients at 1 mo and 100% at 3 and 6 mo. CT was found to be accurate in 44% of patients at 1 mo, 60% at 3 mo, and 57% at 6 mo. HU were found to decrease by at least 25% in 12 of 14 responders after 1 mo. Conclusion: Tumor response to imatinib should be assessed with a combination of morphologic and functional imaging. Image fusion with combined PET/CT can provide additional information in individual cases when compared with side-by-side PET and CT.
Gastrointestinal stromal tumors (GISTs) are the most common mesenchymal tumors of the gastrointestinal tract. Approximately 70% of all GISTs are found in the stomach, 20% originate from the small intestine, and only 10% are found elsewhere (1). GISTs are known to be chemoresistant and insensitive to irradiation (2). In the past, the lack of therapeutic options in inoperable and metastatic disease caused a generally poor prognosis in patients with GISTs. Recent studies, however, showed promising results when treating GIST tumors with imatinib (STI 571, Glivec, Gleevec; Novartis Pharmaceuticals), a newly developed tyrosine kinase inhibitor (3–6). Gain-of-function mutations, usually found in exons 11 and 9 of c-kit, a tyrosine kinase receptor uniformly expressed in GIST, lead to ligand-independent receptor activation (7,8). This mutant receptor is found in approximately 90% of all patients with GIST and is thought to be the main reason for malignant transformation as well as tumor growth in these patients (8,9). Imatinib can inhibit tumor growth in GIST patients by competitive interaction at the adenosine triphosphate (ATP)–binding site of the c-kit receptor (10). Initial clinical studies described clinical responses and long-lasting disease stabilization in the vast majority of patients (3,4).
For optimal clinical outcome, the effect of imatinib on tumor morphology and function needs to be defined as soon as possible after the start of therapy. Early detection of tumor response ensures effective therapy, whereas stable disease or even tumor progression may require an increase in dosage. Initial studies have shown high 18F-FDG uptake of untreated GIST on PET imaging (5,11). PET was shown to be superior to CT in detection of the earliest functional parameters indicative of tumor response induced by imatinib therapy (5,11,12). Other studies have documented tumor response to be associated with a significant decrease in CT attenuation values (13,14). Assessment of Hounsfield unit (HU) morphology, therefore, may improve the accuracy of assessing GIST tumor response.
Fusing the morphologic and functional datasets may provide further diagnostic confidence (15–17). Faulty coregistration as a result of motion-induced misalignment in the abdomen and chest has, so far, limited all software-based image fusion tools (15). This limitation can be overcome by an inline PET/CT imaging system, which provides coregistered morphologic and functional datasets as part of a single examination (15,18). Combined PET/CT imaging, thus, may provide a valuable tool for the assessment of therapy response to imatinib.
The aims of the current analysis were (1) to assess typical alterations on PET and CT images after initiation of imatinib therapy in patients with GIST, (2) to compare the value of PET and CT imaging in early detection of tumor response to imatinib therapy, and (3) to determine the benefit of fused PET/CT imaging compared with PET or CT alone as well as with PET and CT viewed side by side.
MATERIALS AND METHODS
Twenty patients (mean age, 60 y; range, 39–77 y) diagnosed with GIST were referred for whole-body dual-modality PET/CT imaging (Table 1). The primary tumor was located in the stomach in 12 patients, in the small intestine in 7 patients, and in the mesentery in 1 patient. Patient referral was based on histopathologic verification of GIST, either from primary tumor or biopsy of a metastasis. Imaging procedures were performed before initiation of imatinib therapy and at 1, 3, and 6 mo afterward. A follow-up of 381 ± 134 d served as the standard of reference. Data analysis was performed retrospectively in 20 consecutive patients who had all undergone initial PET/CT before the start of imatinib therapy. Imaging procedures were not available from all patients at all time points. The total number of examinations was 20 at baseline, 20 at 1 mo, 10 at 3 mo, 9 at 6 mo, and 20 for the long-term follow-up used as a standard of reference in conjunction with the clinical data. Thus, analysis was based on 79 examinations performed as part of this study.
Clinical Data from 20 Patients with GIST Undergoing Imatinib Therapy
The study was conducted in full accordance with guidelines issued by the local institutional review board. Written informed consent was obtained from all patients for the imaging procedures with simultaneous administration of oral and intravenous CT contrast agents as well as 18F-FDG for PET.
Treatment Protocol
Patients were treated with 400 mg imatinib daily. Those patients with obvious shrinkage of tumor load or significant loss of 18F-FDG utilization were continued on the treatment with the same dose. In accordance with international recommendations, imatinib dosage was increased in steps to 600 and 800 mg/d in 4 patients with stable or enlarging tumor volumes (19). The remaining 16 patients were treated with the standard dose of 400 mg imatinib daily.
PET/CT Imaging
Dual-modality PET/CT imaging was performed on a biograph (Siemens Medical Solutions), which includes a dual-slice helical CT scanner (Somatom Emotion; Siemens) and a full-ring PET scanner (ECAT HR+; Siemens). The biograph provides 2 separate datasets for CT and PET that can be accurately coregistered on a workstation featuring syngo software (Siemens). PET and CT datasets were viewed separately, side by side, and in fused mode for comparison when assessing tumor response to imatinib.
The CT component provided a minimum gantry rotation time of 800 ms and a maximum scan time of 100 s. CT images were acquired with 130 mAs, 130 kV, a slice width of 5 mm, and a table feed of 8 mm/rotation. For vascular and parenchymal delineation, 140 mL of an iodinated contrast agent (Xenetix 300, 300 mg iodine/mL; Guerbet GmbH) were administered intravenously at 3 mL/s (start delay, 30 s) with an automated injector (XD 5500; Ulrich Medical Systems). Sufficient small-bowel delineation was accomplished by administration of either 1,000 mL barium at a concentration of 1.5 g barium sulfate/100 mL (Micropaque CT; Guerbet GmbH) or by ingestion of a solution containing 0.2% locust bean gum and 2.5% mannitol diluted in 1.5 L water. A respiration protocol providing a limited breath-hold was used to avoid motion-induced artifacts in the area of the diaphragm (20). All patients were instructed to breath shallowly during CT acquisition of the head and neck and upper thorax. To avoid motion-induced misregistration around the diaphragm, all patients were instructed to breathe out at the level of the lower thorax and hold their breath in expiration during image acquisition in the lower thorax and the liver. Patients were then allowed to continue breathing shallowly. After acquisition of the CT data, the patient table automatically moved farther into the gantry for the PET examination.
PET imaging was conducted 60 min after the administration of a mean dose of 358 MBq 18F-FDG (±42 MBq). Patients had been instructed to fast for a minimum of 4 h before the examinations. To document normal blood glucose levels, blood samples were obtained before the tracer injection. The PET component of the combined imaging system represented a full-ring tomograph with an inplane spatial resolution of 4.6 mm and an axial field of view of 15.5 cm for 1 bed position. The acquisition time for PET was adapted according to the patients’ weight. Emission time was 3 min in patients weighing <65 kg, 4 min in patients weighing 65–85 kg, and 5 min in patients weighing >85 kg. PET images were corrected for attenuation on the basis of the CT data (21), and iterative reconstruction algorithms with 2 iterations and 8 subsets were performed. Data were filtered and scatter corrected.
To ensure accurate staging of GIST, the first PET/CT examinations extended from the head to the upper thighs (whole body) in all patients. The scanning range of follow-up examinations was limited to areas of known tumor manifestations. To detect potentially developing new distant metastases, a whole-body scan was repeated every 3 mo. Every patient underwent whole-body PET/CT for the long-term follow-up study.
Data Analysis
PET images were read by 2 nuclear medicine physicians, and CT datasets were evaluated by 2 general radiologists in consensus. Evaluating physicians were unaware of results in the other imaging modality. After separate image evaluation, PET and CT datasets were read side by side without image fusion on 2 separate screens by a radiologist and a nuclear medicine physician in consensus. PET and CT images were viewed side by side after the images had been misregistered manually along the x-, y-, and z-axes. Furthermore, CT and PET image sizes were altered to match the typical clinical sizes in which CT and PET are usually supplied. (The misregistration procedure was performed by a physician not involved in image evaluation.) Finally, fused PET/CT datasets were viewed by the same physicians in consensus.
PET images were evaluated for regions of increased tracer uptake. Up to 5 target lesions were defined. If more than 5 lesions were detected on the baseline scan, the evaluating physician selected 5 lesions with the highest 18F-FDG uptake on visual image evaluation as target lesions. Maximum standard uptake values (SUVs) were determined for tracer uptake quantification. SUVs were calculated in the usual fashion:
 .
.
The region of interest to measure the maximal SUV was drawn to include the whole lesion. The sum of all SUVs from target lesions was determined, and comparison of PET examinations was performed based on these SUV sums. After the baseline study in each of the PET/CT scans, the same target lesions were measured for assessment of tumor response. The longest diameters of target lesions also were measured and documented for follow-up evaluation. Lesion sizes were determined using a threshold of 50% of the maximum SUV for background subtraction. All other lesions were defined to be nontarget lesions, and their number was documented. The treatment effect of imatinib therapy was characterized according to the recommendations of the European Organisation for Research and Treatment of Cancer (EORTC) PET study group (22). Complete metabolic response was said to be achieved when SUVs of all lesions were decreased to or below normal values of surrounding tissue. Partial metabolic response was defined as an SUV reduction of >25%, whereas SUV measurements within ±25% of the initial value were considered to represent stable disease. Disease progression was manifest if SUV increases in target lesions exceeded 25%, 18F-FDG uptake increased by more than 20% in the longest diameter, or new lesions were detected.
Responses to therapy on CT images were classified according to the World Health Organization (WHO) guidelines and the Response Evaluation Criteria in Solid Tumors (RECIST) (23,24). Up to 5 target lesions were defined for each patient on the baseline scan. Lesion size was documented as either the sum of the longest diameter of all target lesions (RECIST) or the sum of the square products of all target lesions (WHO). Sums of target lesions of all examinations were compared with the baseline study. Criteria for evaluating target lesions for tumor treatment response are shown in Table 2. The number of nontarget lesions was determined on every examination, and tumor response was evaluated as follows: complete response = no lesion detectable; partial response = decreased number of nontarget lesions; stable disease = no change in number of nontarget lesions; and progression = increased number of nontarget lesions. In cases of diffuse pulmonary or mesenteric metastases with nodules <10 mm in size, lesions were defined as “nonmeasurable,” and qualitative evaluation was conducted on every follow-up examination. A complete response was defined as nondetectable disease, and a partial response was defined as a decrease in the number of lesions. Absence of change was defined as stable disease, and an increase in metastatic lesions characterized tumor progression. In addition to WHO- and RECIST-based lesion size assessments, HU measurements were performed on all target lesions in all examinations. Patients were considered responders if HU decreased by >25%. The threshold of 25% was determined based on previously published data (13,14).
Assessment of GIST Response to Imatinib Based on WHO and RECIST Criteria
When evaluating PET and CT images side by side and on fused PET/CT images, the effect of imatinib therapy was determined on the basis of CT and PET criteria described previously. In instances in which morphologic and functional data resulted in different classifications of tumor response, a consensus was found using the following criteria. If either morphologic or functional data indicated progressive disease, response was classified as progressive disease. When one reading was no change and the other was complete response, the consensus was called partial response. If CT or PET rated no change but the other imaging modality indicated partial response, the final decision was based on CT HU. Decreasing HU indicated response, whereas unchanged HU characterized no change (14).
In addition to evaluation of the different imaging procedures, the following items were correlated separately with the standard of reference to assess their individual value in determining tumor response to therapy: SUV on PET images, lesion size on PET and CT (for CT evaluation by WHO and RECIST criteria), the number of lesions on PET and CT, and HU on CT. After evaluation of all images, a follow-up reading was performed to verify the detected metastases on a lesion-by-lesion basis using all available radiologic procedures.
Standard of Reference
A mean follow-up time of 381 ± 134 d after completion of the 6-mo period served as the standard of reference. This follow-up encompassed all available clinical data, including physical examinations, laboratory tests, and radiologic imaging procedures (CT, MRI, PET/CT). A PET/CT examination with a whole-body field of view was available in all patients at long-term follow-up. For definition of the standard of reference, all patients were rated as responders or nonresponders by a tumor board consisting of a nuclear medicine physician, a radiologist, and an oncologist. The tumor board was supplied with all clinical and radiologic data. Members of the tumor board were not involved in image evaluation for the study. Patients were characterized as responders or nonresponders according to WHO and RECIST criteria on morphologic imaging as well as EORTC criteria on functional data by comparing the radiologic study performed at the end of the follow-up period with the initial study at baseline (before the start of the therapy).
Statistical Analysis
To compare the effectiveness of the different imaging combinations, data were divided into categories of responders (partial response and complete response) and nonresponders (no change and progressive disease). κ values for determination of agreement of the different imaging procedures at different time points with the gold standard were calculated with SPSS software (SPSS, Inc.). McNemar’s test was used to compare differences between the imaging procedures in determination of therapy response.
RESULTS
Primary Staging
PET/CT revealed more metastases from GISTs when compared with other imaging procedures. The number of lesions detected with PET/CT on the baseline scan in the 20 patients was 282. Side-by-side image evaluation detected 279, whereas PET alone revealed only 135 lesions. CT imaging revealed 249 lesions. Hence, CT proved superior to PET (P < 0.001), whereas side-by-side PET and CT and fused PET/CT datasets were superior to CT alone (P < 0.001). Finally, the difference between PET/CT viewed side by side versus fused PET/CT datasets was not significant. In 1 patient, however, the primary tumor could be detected only on fused PET/CT datasets (Fig. 1). Twenty-nine lesions in the lung and 118 lesions in the abdomen were missed with PET alone. Of those missed by PET alone in the abdomen, 21 were mistaken for physiologic bowel uptake and, thus, were misdiagnosed. The remaining 97 abdominal metastases not detected with PET did not demonstrate pathologically increased tracer uptake. Twenty-two lesions detected on PET had been missed on CT alone. At baseline, CT did not detect any lesions in 2 patients (patients 2 and 16 in Table 1). Thus, assessment of tumor response by CT was limited to the 18 CT-positive patients.
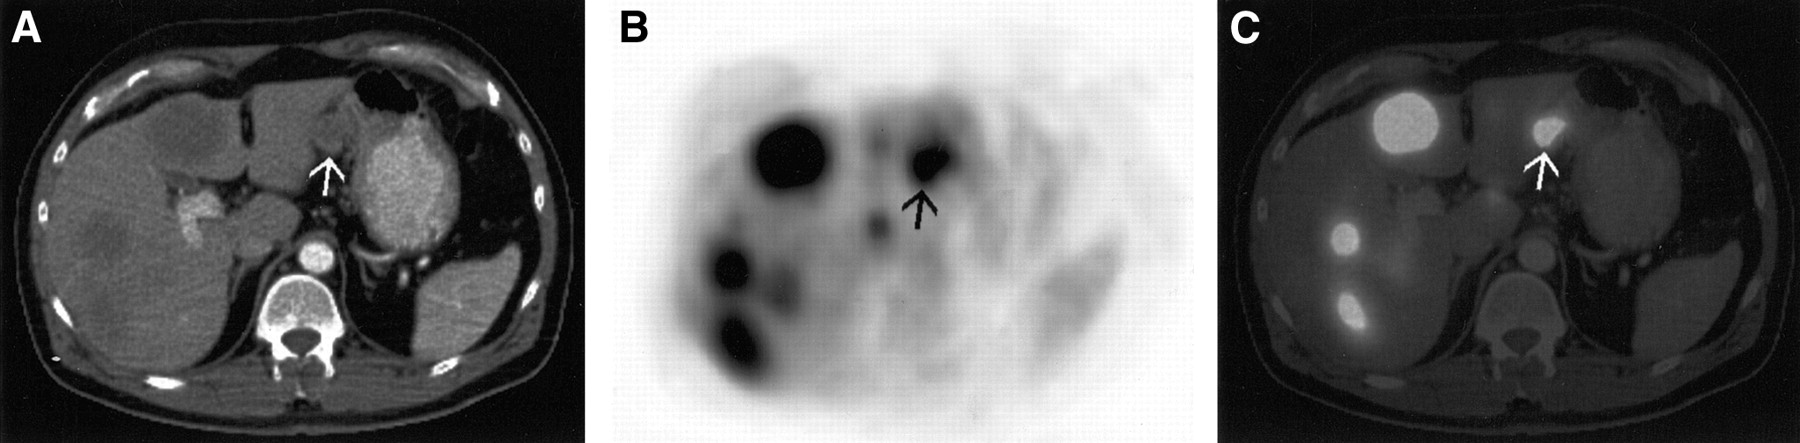
Patient (49 y old; patient 1 in Table 1) with hepatic metastases from GIST and unknown site of the primary tumor. (A) On transverse CT images, the primary tumor at the lesser curvature of the stomach (arrow) was mistaken for a bowel loop. (B) When evaluating PET data separately, focally increased glucose metabolism of the primary lesion was thought to be a hepatic metastasis in the left liver lobe. (C) Diagnosis was accomplished by image fusion (PET/CT) and later confirmed on biopsy.
Evaluation of Tumor Response
Overall Tumor Response.
Dual-modality PET/CT imaging correctly characterized response to imatinib therapy in more patients than the other imaging modalities. Combined PET/CT was correct in 95% of patients after 1 mo and in 100% of patients after 3 and 6 mo. Side-by-side evaluation of PET and CT images accurately characterized tumor response in 90% of patients after 1 mo and 100% of patients after 3 and 6 mo. One patient falsely characterized as a responder by side-by-side PET and CT was correctly identified as a nonresponder by fused PET/CT datasets. Correct assessment of tumor response with fused PET/CT was based on accurate image fusion of an area of increased 18F-FDG uptake in a lymph node. 18F-FDG uptake had been misdiagnosed as physiologic bowel activity on both PET and side-by-side PET and CT, and the lymph node had not been diagnosed as a metastasis because of its small size on CT and side-by-side PET and CT. PET imaging correctly characterized response to imatinib in 85%, 100%, and 100%, whereas CT imaging viewed on its own was found to be correct in 44%, 60% and 57% of patients at 1, 3, and 6 mo, respectively (Fig. 2). κ values and levels of significance comparing the different imaging procedures with the gold standard are shown in Table 3. Although differences between CT and PET (P < 0.001), CT and side-by-side evaluation (P < 0.001), and CT and PET/CT (P = 0.001) were shown to be significant after 1 mo, no statistically significant difference could be found between CT and the other imaging procedures after 3 or 6 mo. Differences between PET, side-by-side evaluation, and PET/CT were not statistically significant on all examination days.
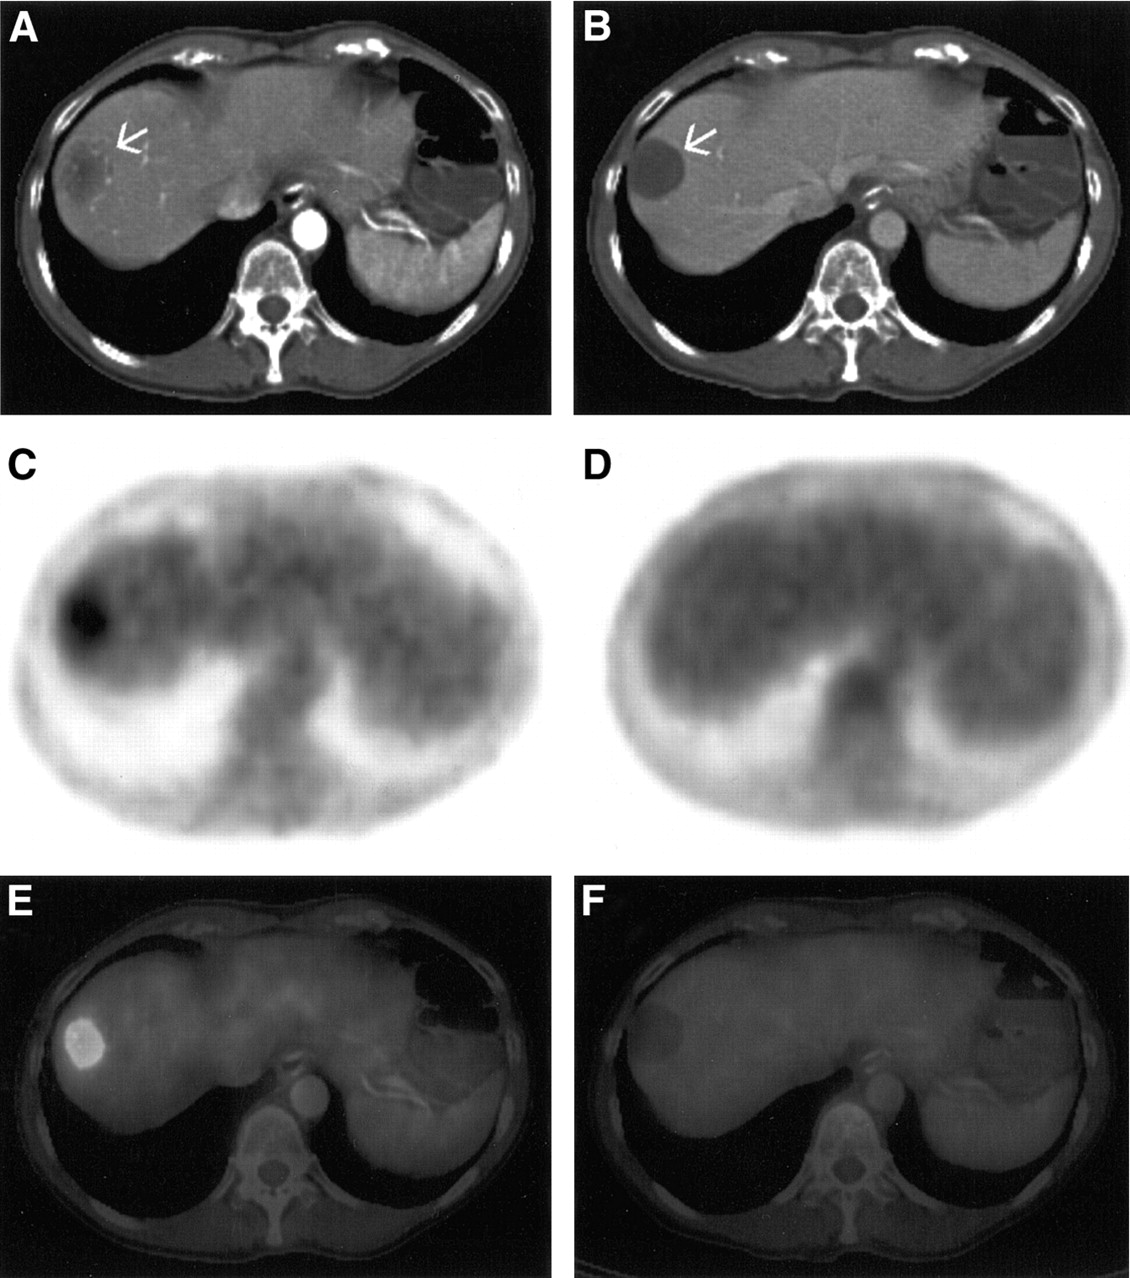
Transverse CT, PET, and fused PET/CT images of 67-y-old woman (patient 17 in Table 1) with hepatic metastasis (arrows in A and B) from GIST before and 1 mo after the start of imatinib therapy. (A and B) On CT images, size-based response evaluation rated no change, whereas the decrease in intralesional attenuation indicated response to treatment. (C and D) Based on PET images, response was rated as complete. (E and F) On combined PET/CT, response was classified as partial (no change on CT and complete response on PET). The standard of reference characterized this patient as a responder.
Agreement of Imaging Procedures with the Standard of Reference
Standard Uptake Value.
Although evaluation of both lesion size and the number of lesions on PET images showed good agreement with the overall tumor response on PET, determination of only the sum of SUVs from all target lesions led to 3 false-positives after 1 mo and 1 false-positive after 3 mo. False-positive interpretation was based on decreasing SUVs after the start of the therapy in patients later diagnosed as nonresponders by the standard of reference (Fig. 3). This affected the overall PET assessment after 1 mo, thus decreasing the κ value (Tables 3 and 4). At 3 mo, however, patients were correctly diagnosed as nonresponders on overall PET evaluation as a result of the detection of additional lesions.

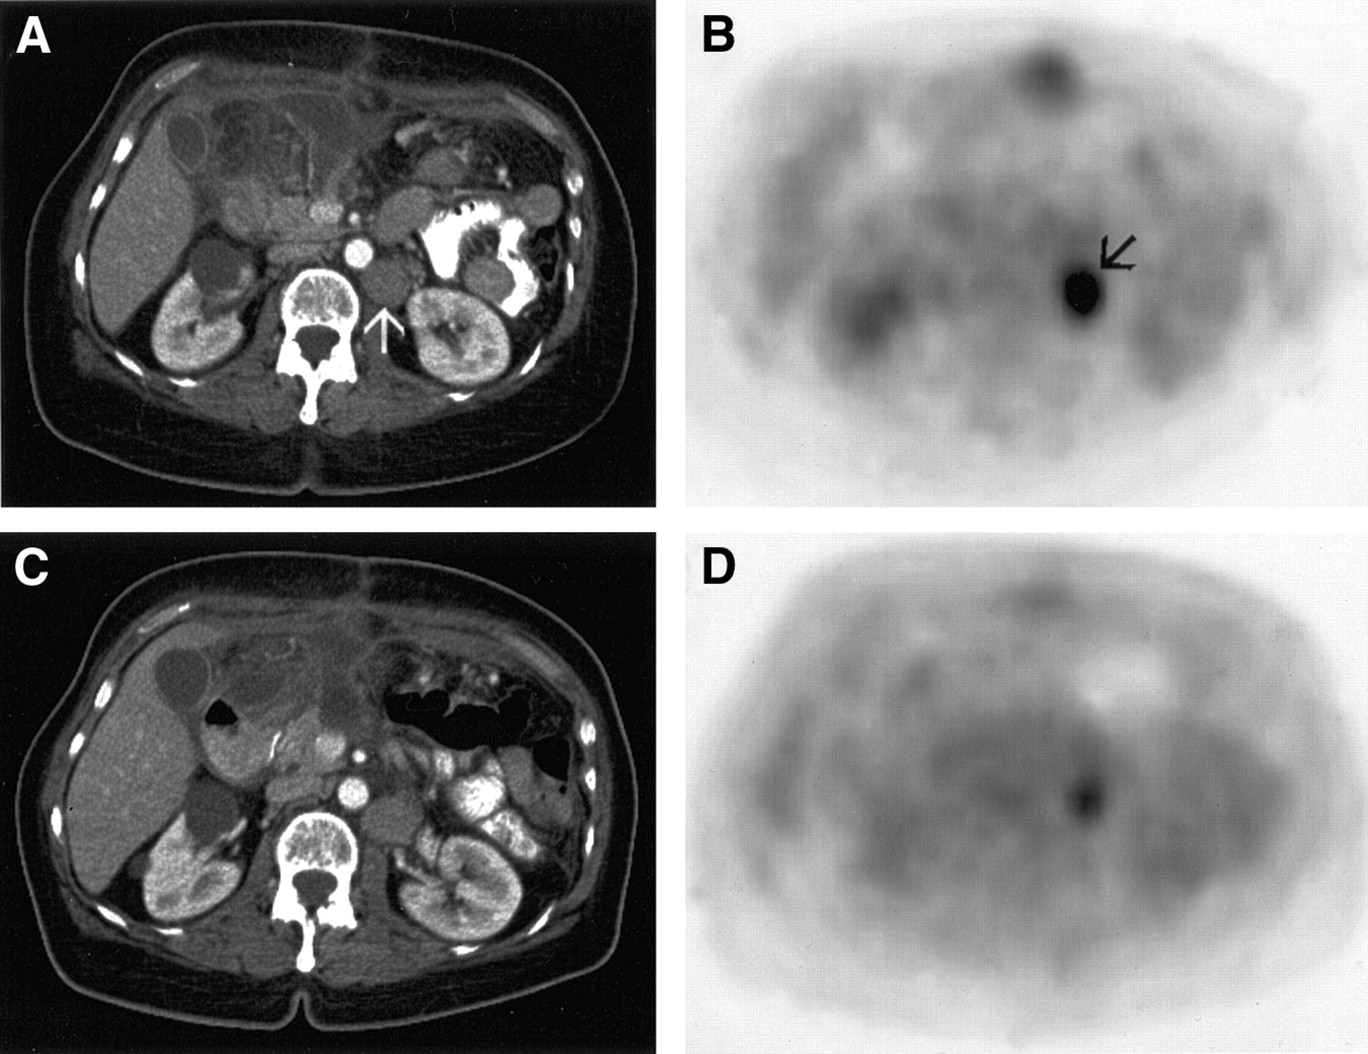
Retroperitoneal lymph node metastasis before initiation of imatinib therapy (arrows in A and B) in 65-y-old woman (patient 7 in Table 1). Pathologic glucose metabolism decreased 1 mo after the start of imatinib therapy (D) when compared with the pretreatment scan (B). The SUV of the lesion dropped by 27%, thus indicating therapy response. (C) On CT images, no change was diagnosed, with an insignificant increase in lesion size. On further follow-up, this patient proved to be a nonresponder.
Agreement of Characteristics on PET and CT with the Standard of Reference
Lesion Size and Number of Lesions.
On PET imaging, determination of lesion size as well as evaluation of the number of lesions proved to be reliable tools for assessing tumor response to imatinib (Table 4). On CT images, however, lesion-size–based response assessment indicated only poor agreement with the standard of reference without statistical significance on all examination days (Table 4). When comparing WHO and RECIST criteria for determination of tumor response on CT images, WHO correctly determined response to therapy as partial response in 1 patient graded as no change with RECIST after 1 mo. On further comparison, WHO and RECIST led to equal assessment of tumor response. Differentiation of no change into minor response and stable disease, as is performed when assessing tumor response according to WHO criteria, however, did correctly predict response to treatment in 5 patients graded as minor response after 1 mo. Two patients characterized as minor response after 1 mo proved to be nonresponders on further follow-up. Unmasking of formerly isodense lesions by therapy-induced decreasing attenuation rendered assessment of tumor response with CT difficult in 6 patients after 1 mo (Fig. 4). By reevaluation of the baseline studies, however, false interpretation as tumor progression could be avoided.
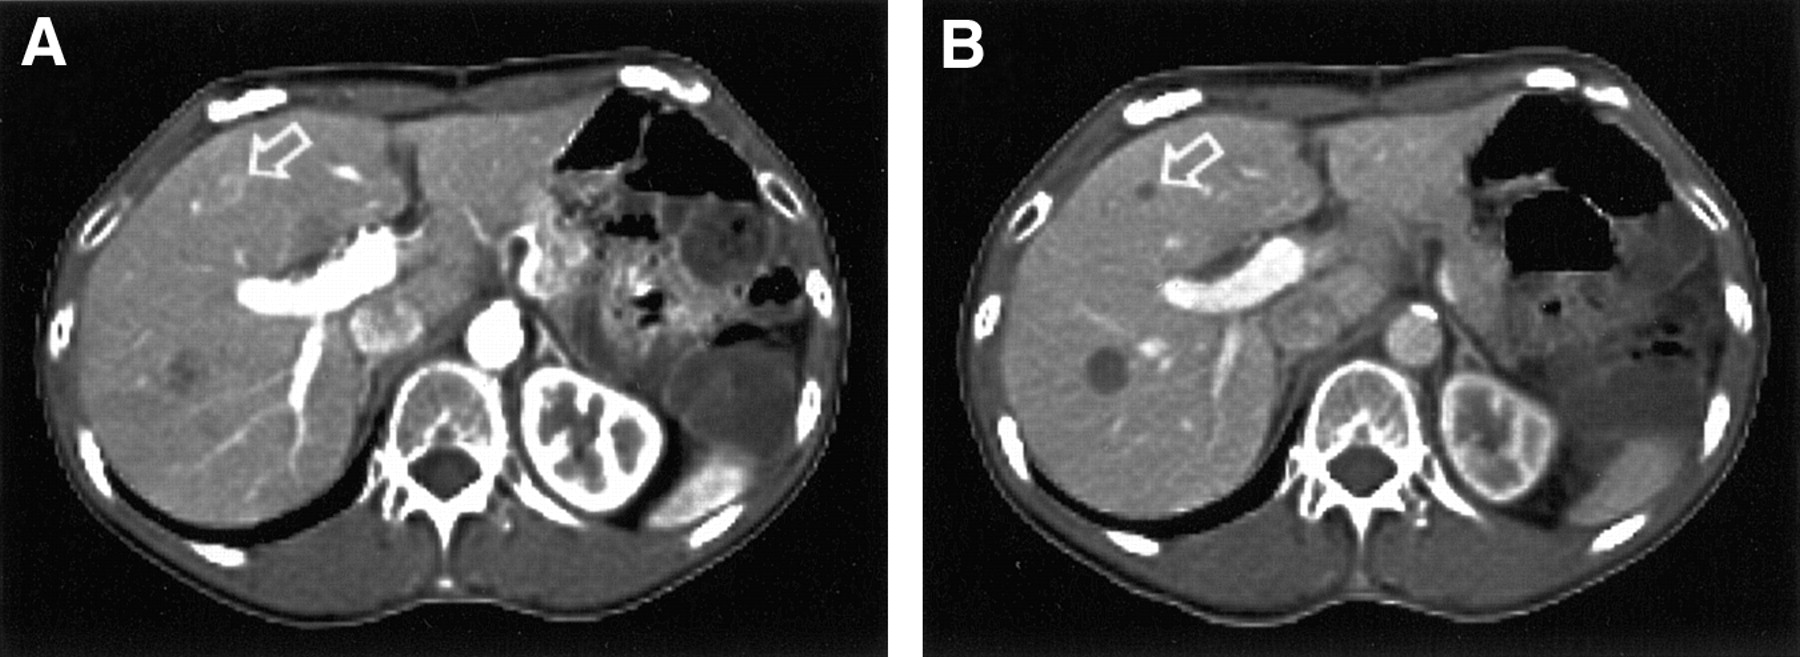
Transverse CT images of 39-y-old man (patient 8 in Table 1) before (A) and 1 mo after (B) the start of imatinib therapy. Unmasking of a formerly isodense hepatic metastasis (arrow in A) by decreasing attenuation resulted from therapy-induced liquefaction (arrow in B). This finding must not be misinterpreted as a newly developed lesion, thus characterizing tumor progression.
Hounsfield Units.
Assessment of HU on CT images demonstrated a reduction of attenuation of at least 25% within metastatic lesions 1 mo after initiation of therapy in 12 of 14 patients responding to treatment, compared with unchanged or increasing HU in nonresponders (Table 4). Low attenuation was distributed homogeneously in all lesions in 11 patients, demonstrating complete necrosis, whereas 1 patient had mainly central necrosis. Low attenuation values within the lesions persisted for the duration of the follow-up examinations. Two patients rated as responders showed unchanged HU after 1 mo. In one of these patients, HU eventually decreased on follow-up, whereas HU remained in steady state in the other patient. Mean HU decreased from 53 ± 14 on the baseline scan to 30 ± 13 (1 mo), 24 ± 18 (3 mo), and 24 ± 9 (6 mo) in responding patients. In the nonresponding group, mean HU were 51 ± 18 at baseline, followed by 61 ± 18 (1 mo), 68 ± 14 (3 mo), and 57 ± 20 (6 mo).
DISCUSSION
Functional imaging proved significantly more accurate than CT alone when assessing GIST response to imatinib on all examination days. Compared with PET alone and side-by-side PET and CT, dual-modality PET/CT imaging detected more lesions on the baseline scans and demonstrated higher accuracy in determining tumor response after 1 mo of treatment. PET/CT imaging can be considered a reliable tool for assessment of GIST response to imatinib and, where available, should be used for evaluation of tumor response.
PET imaging was a sensitive tool for early characterization of GIST response to imatinib. As noted in previous reports, responding patients were found to have decreasing or missing pathologic 18F-FDG utilization within metastases or the primary tumor 1 mo after the start of the therapy (11–13). PET imaging, therefore, must be regarded as an essential component when assessing tumor response to imatinib. However, evaluation of tumor response with PET imaging alone led to 3 false-positive ratings after 1 mo and 1 false-positive rating after 3 mo. In these patients, a decrease in the sum of SUVs from target lesions was found, falsely indicating response to therapy. A mismatch of CT and PET images in the area of the diaphragm may affect PET tracer quantification when CT-based PET attenuation correction is used. In all of these patients, however, CT and PET images were accurately aligned without detection of motion artifacts. Thus, an image mismatch resulting from a difference of respiration states during CT and PET does not serve as an explanation for the decrease in 18F-FDG uptake. In 1 of these patients, side-by-side evaluation of PET with CT images correctly characterized this patient as a nonresponder by revealing newly developing PET-negative lesions. Fused PET/CT images were able to correctly characterize 2 of these patients as nonresponders. Although these differences did not prove to be statistically significant, they illustrate that the combined availability of functional PET and morphologic CT data enhances the ability to determine tumor response compared with PET alone. Adding CT data to PET increases the diagnostic accuracy by detecting additional lesions.
The main limitation of PET imaging alone is related to respiratory motion. A considerable number of pulmonary lesions as well as lesions in the upper abdomen were missed on PET alone. It has been shown that respiratory motion leads to smearing of 18F-FDG uptake, rendering detection of smaller pulmonary lesions difficult (25). The same effect must be considered in the upper abdomen, where respiratory motion of parenchymal organs may limit detectability of small lesions on PET alone. Simultaneous availability of morphologic data acquired in breath-hold technique increases lesion detectability over PET imaging alone. The minimum standard for assessment of GIST response to imatinib, therefore, should be side-by-side evaluation of CT and PET images. However, the number of lesions detected on the baseline scan must be interpreted with caution, because histopathologic verification was not available in all metastases. Based on ethical limitations, not all small lesions can be verified histopathologically in patients with multiple metastases. Furthermore, biopsy of small lesions may be technically difficult to perform. Therefore, lesion verification was based on radiologic follow-up.
When assessing the value of CT imaging in determining tumor response to imatinib, κ values indicated only low agreement when compared with the standard of reference. Thus, evaluation of tumor response to imatinib should not be based solely on morphologic CT criteria. This finding is in agreement with other reports that demonstrated only poor correlation between CT imaging and tumor response (11,26). Comparing response assessments based on WHO and RECIST criteria demonstrated similar results when characterizing tumor response. There may, however, be a benefit to adding a subcategory of minor response for early assessment of tumor response, as is part of the WHO criteria. Minor response was indicative of tumor response in 5 patients, and in 2 patients it proved falsely positive (nonresponders). Larger patient cohorts are required to assess the value of this subcategory when determining tumor response to imatinib.
A decrease in attenuation values of metastases was found in most responding patients 1 mo after initiation of imatinib therapy. These data are in good agreement with findings by Chen et al. (14), who demonstrated cystic changes within hepatic lesions in 4 patients undergoing imatinib therapy. These cystic alterations reflect liquefaction of hepatic metastases. Liquefaction of metastases, however, may impose interpretation problems, because previously inapparent isodense metastases may be unmasked and impress the observer as newly developed lesions. This interpretation problem was manifest at 1 mo in 6 patients. In these patients, baseline studies had to be reevaluated closely to avoid characterization of tumor response as progression.
Assessment of HU proved reliable when evaluating tumor response. An attenuation decrease of more than 25% was found within target lesions at 1 mo in 12 of 14 patients responding to therapy. All patients rated as nonresponders showed unchanged or even increasing HU values. Similar results have been reported by Choi et al. (13). Without discriminating responders from nonresponders, a mean HU decrease of 16.5% was documented. Determination of HU, therefore, seems to be a valuable indicator for tumor response to treatment as early as 1 mo after therapy. Based on the results of this study, a reduction of HU greater than 25% indicates tumor response to therapy. Neither WHO nor RECIST criteria include assessment of HU. Integration of HU into CT evaluation, therefore, is recommended when determining the effect of imatinib on GIST.
An important issue when assessing HU is contrast agents, which were applied in all patients. Contrast is desirable for CT evaluation, because it may show more metastases than are detected on unenhanced CT. Differing amounts of contrast agents, however, may lead to misinterpretation of HU when comparing CT studies. An additional nonenhanced CT scan may be performed before applying intravenous contrast agents, but this incurs additional radiation exposure to the patient. The evaluating physician, therefore, should ensure that a similar dosage of intravenous contrast agent is administered at every examination. Preliminary evaluations of intravenous contrast agents in PET/CT imaging have revealed PET artifacts in areas of contrast agent bolus passage in thoracic veins, whereas no artifacts could be detected in other parts of the body (27). Thus, a significant effect of intravenous contrast agents on PET images when assessing metastases from GIST is not to be expected.
Comparison of dual-modality PET/CT imaging with side-by-side PET and CT image evaluation did not reveal a statistically significant difference when assessing tumor response to imatinib. Of course, this comparison was subject to a minor bias based on the way images were acquired and evaluated. The acquisition of separate CT and PET datasets is usually performed on 2 imaging systems. The resulting datasets will differ in field of view, respiration state, and location of movable organs. These differences may render side-by-side evaluation difficult. Images viewed side by side in our study were acquired on the same imaging system. The field of view was the same for PET and CT, and a special PET-adapted respiration protocol was performed during acquisition of the CT (19). Moreover, organ shift was minimized by immediate acquisition of PET after CT. Despite the fact that PET and CT images were manually misregistered before performing side-by-side evaluation, differences in diagnostic accuracy may be more enhanced when PET/CT fusion images are compared with separately acquired CT and PET images. Even in the setting of the more optimal circumstances present in this study, image fusion detected additional lesions at 1 mo in 1 patient in whom side-by-side image evaluation failed to do so.
CONCLUSION
Assessment of tumor response based on morphologic imaging alone may not reveal a response to imatinib until several months after the start of the therapy. A combination of functional and morphologic imaging, therefore, must be recommended for assessment of GIST response to imatinib. Image fusion by combined PET/CT can provide additional information in individual cases when compared with side-by-side PET and CT. Thus, dual-modality PET/CT, when available, may be preferable for evaluation of tumor response to imatinib.
Footnotes
Received May 16, 2003; revision accepted Oct. 29, 2003.
For correspondence or reprints contact: Gerald Antoch, MD, Department of Diagnostic and Interventional Radiology, University Hospital Essen, Hufelandstrasse 55, 45122 Essen, Germany.
E-mail: gerald.antoch{at}uni-essen.de
REFERENCES
In this issue


Jump to section
Related Articles
Cited By...
- Detection of Mutant Free Circulating Tumor DNA in the Plasma of Patients with Gastrointestinal Stromal Tumor Harboring Activating Mutations of CKIT or PDGFRA
- Utility of positron emission tomography/CT in the evaluation of small bowel pathology
- ACRIN 6665/RTOG 0132 Phase II Trial of Neoadjuvant Imatinib Mesylate for Operable Malignant Gastrointestinal Stromal Tumor: Monitoring with 18F-FDG PET and Correlation with Genotype and GLUT4 Expression
- Early [18F]Fluorodeoxyglucose Positron Emission Tomography at Two Days of Gefitinib Treatment Predicts Clinical Outcome in Patients with Adenocarcinoma of the Lung
- Imaging in Sarcoma
- Noninvasive measurement of androgen receptor signaling with a positron-emitting radiopharmaceutical that targets prostate-specific membrane antigen
- Diagnostic accuracy of fused positron emission tomography/magnetic resonance mammography: initial results
- 68Ga-DOTATATE PET/CT for the Early Prediction of Response to Somatostatin Receptor-Mediated Radionuclide Therapy in Patients with Well-Differentiated Neuroendocrine Tumors
- Assessment of the In vivo Antitumor Effects of ENMD-2076, a Novel Multitargeted Kinase Inhibitor, against Primary and Cell Line-Derived Human Colorectal Cancer Xenograft Models
- Metastatic Renal Cell Carcinoma Treated with Sunitinib: Early Evaluation of Treatment Response Using Dynamic Contrast-Enhanced Ultrasonography
- Absence of Progression As Assessed by Response Evaluation Criteria in Solid Tumors Predicts Survival in Advanced GI Stromal Tumors Treated With Imatinib Mesylate: The Intergroup EORTC-ISG-AGITG Phase III Trial
- NCCN Task Force: Clinical Utility of PET in a Variety of Tumor Types
- Monitoring Predominantly Cytostatic Treatment Response with 18F-FDG PET
- Early Prediction of Response to Sunitinib After Imatinib Failure by 18F-Fluorodeoxyglucose Positron Emission Tomography in Patients With Gastrointestinal Stromal Tumor
- 18F-FDG PET and PET/CT in the Evaluation of Cancer Treatment Response
- Sorafenib in Hepatocellular Carcinoma: Separating the Hype From the Hope
- The Lessons of GIST--PET and PET/CT: A New Paradigm for Imaging
- Efficacy and Safety of Single-Agent Pertuzumab, a Human Epidermal Receptor Dimerization Inhibitor, in Patients with Non Small Cell Lung Cancer
- Clonal Evolution of Resistance to Imatinib in Patients with Metastatic Gastrointestinal Stromal Tumors
- Correlation of Computed Tomography and Positron Emission Tomography in Patients With Metastatic Gastrointestinal Stromal Tumor Treated at a Single Institution With Imatinib Mesylate: Proposal of New Computed Tomography Response Criteria
- We Should Desist Using RECIST, at Least in GIST
- Sunitinib: From Rational Design to Clinical Efficacy
- Monitoring Cancer Treatment with PET/CT: Does It Make a Difference?
- Improvements in Cancer Staging with PET/CT: Literature-Based Evidence as of September 2006
- Can PET/CT Replace Separate Diagnostic CT for Cancer Imaging? Optimizing CT Protocols for Imaging Cancers of the Chest and Abdomen
- Response evaluation in gastrointestinal stromal tumours treated with imatinib: misdiagnosis of disease progression on CT due to cystic change in liver metastases
- Positron Emission Tomography As an Imaging Biomarker
- Management of Gastrointestinal Stromal Tumors in the Imatinib Era: Selected Case Studies
- Use of PET for Monitoring Cancer Therapy and for Predicting Outcome
- Progress and Promise of FDG-PET Imaging for Cancer Patient Management and Oncologic Drug Development