


Article Figures & Data
Figures
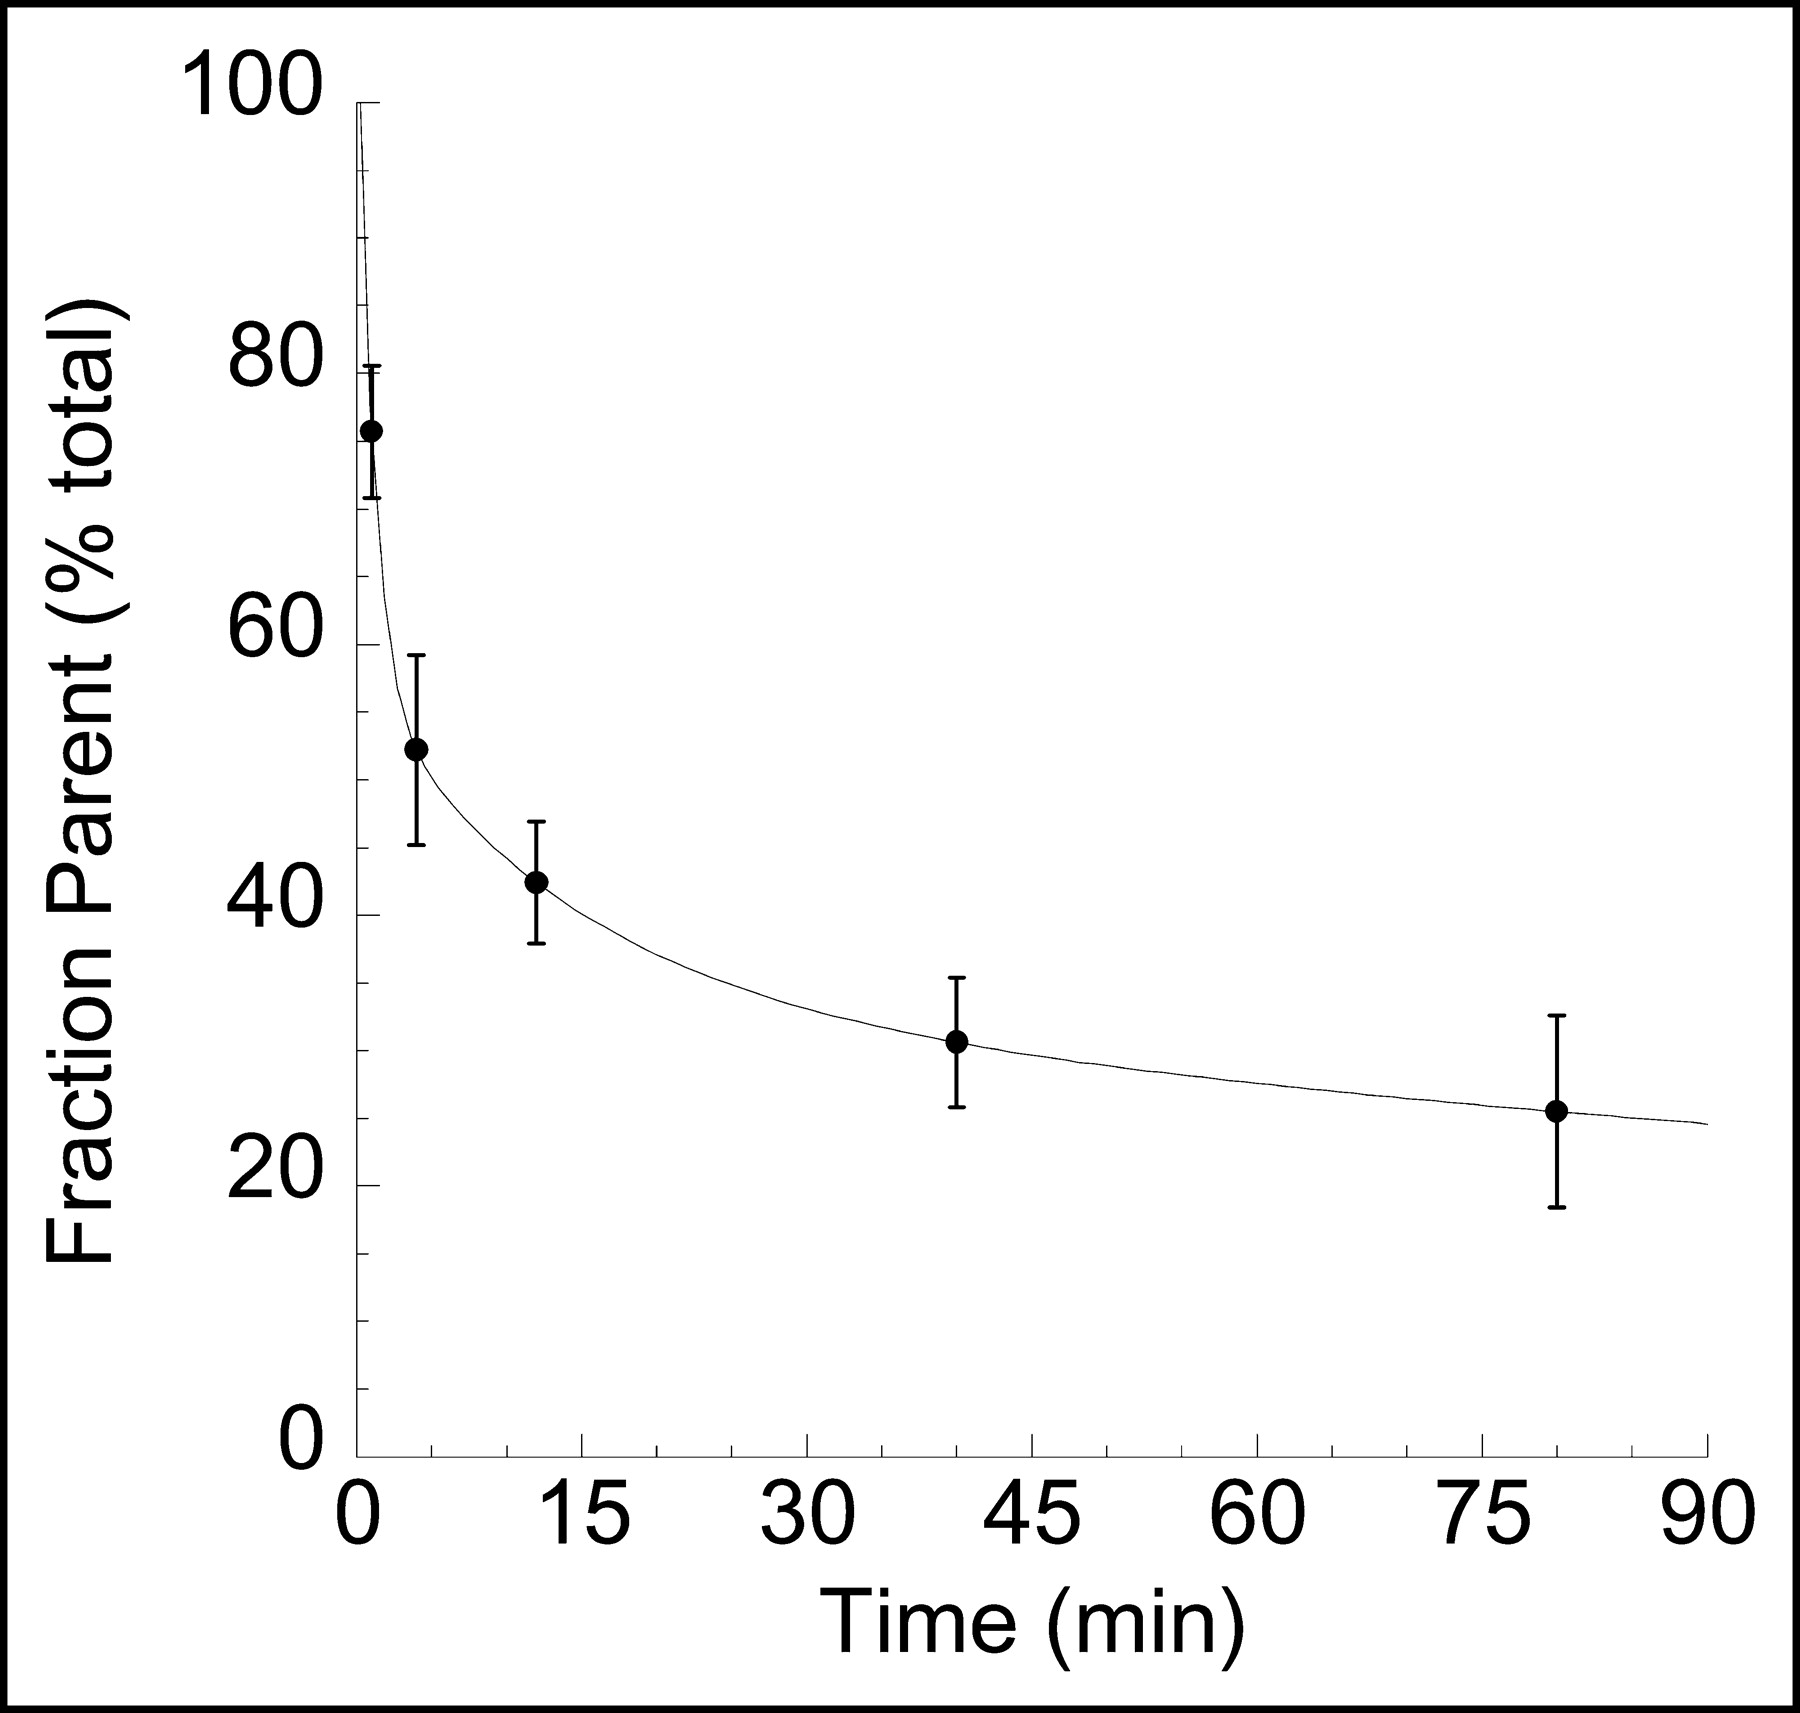
- FIGURE 1.
Mean ± SD fraction of plasma activity corresponding to the parent compound over time, after injection of 11C-NPA in baboons (n = 8).
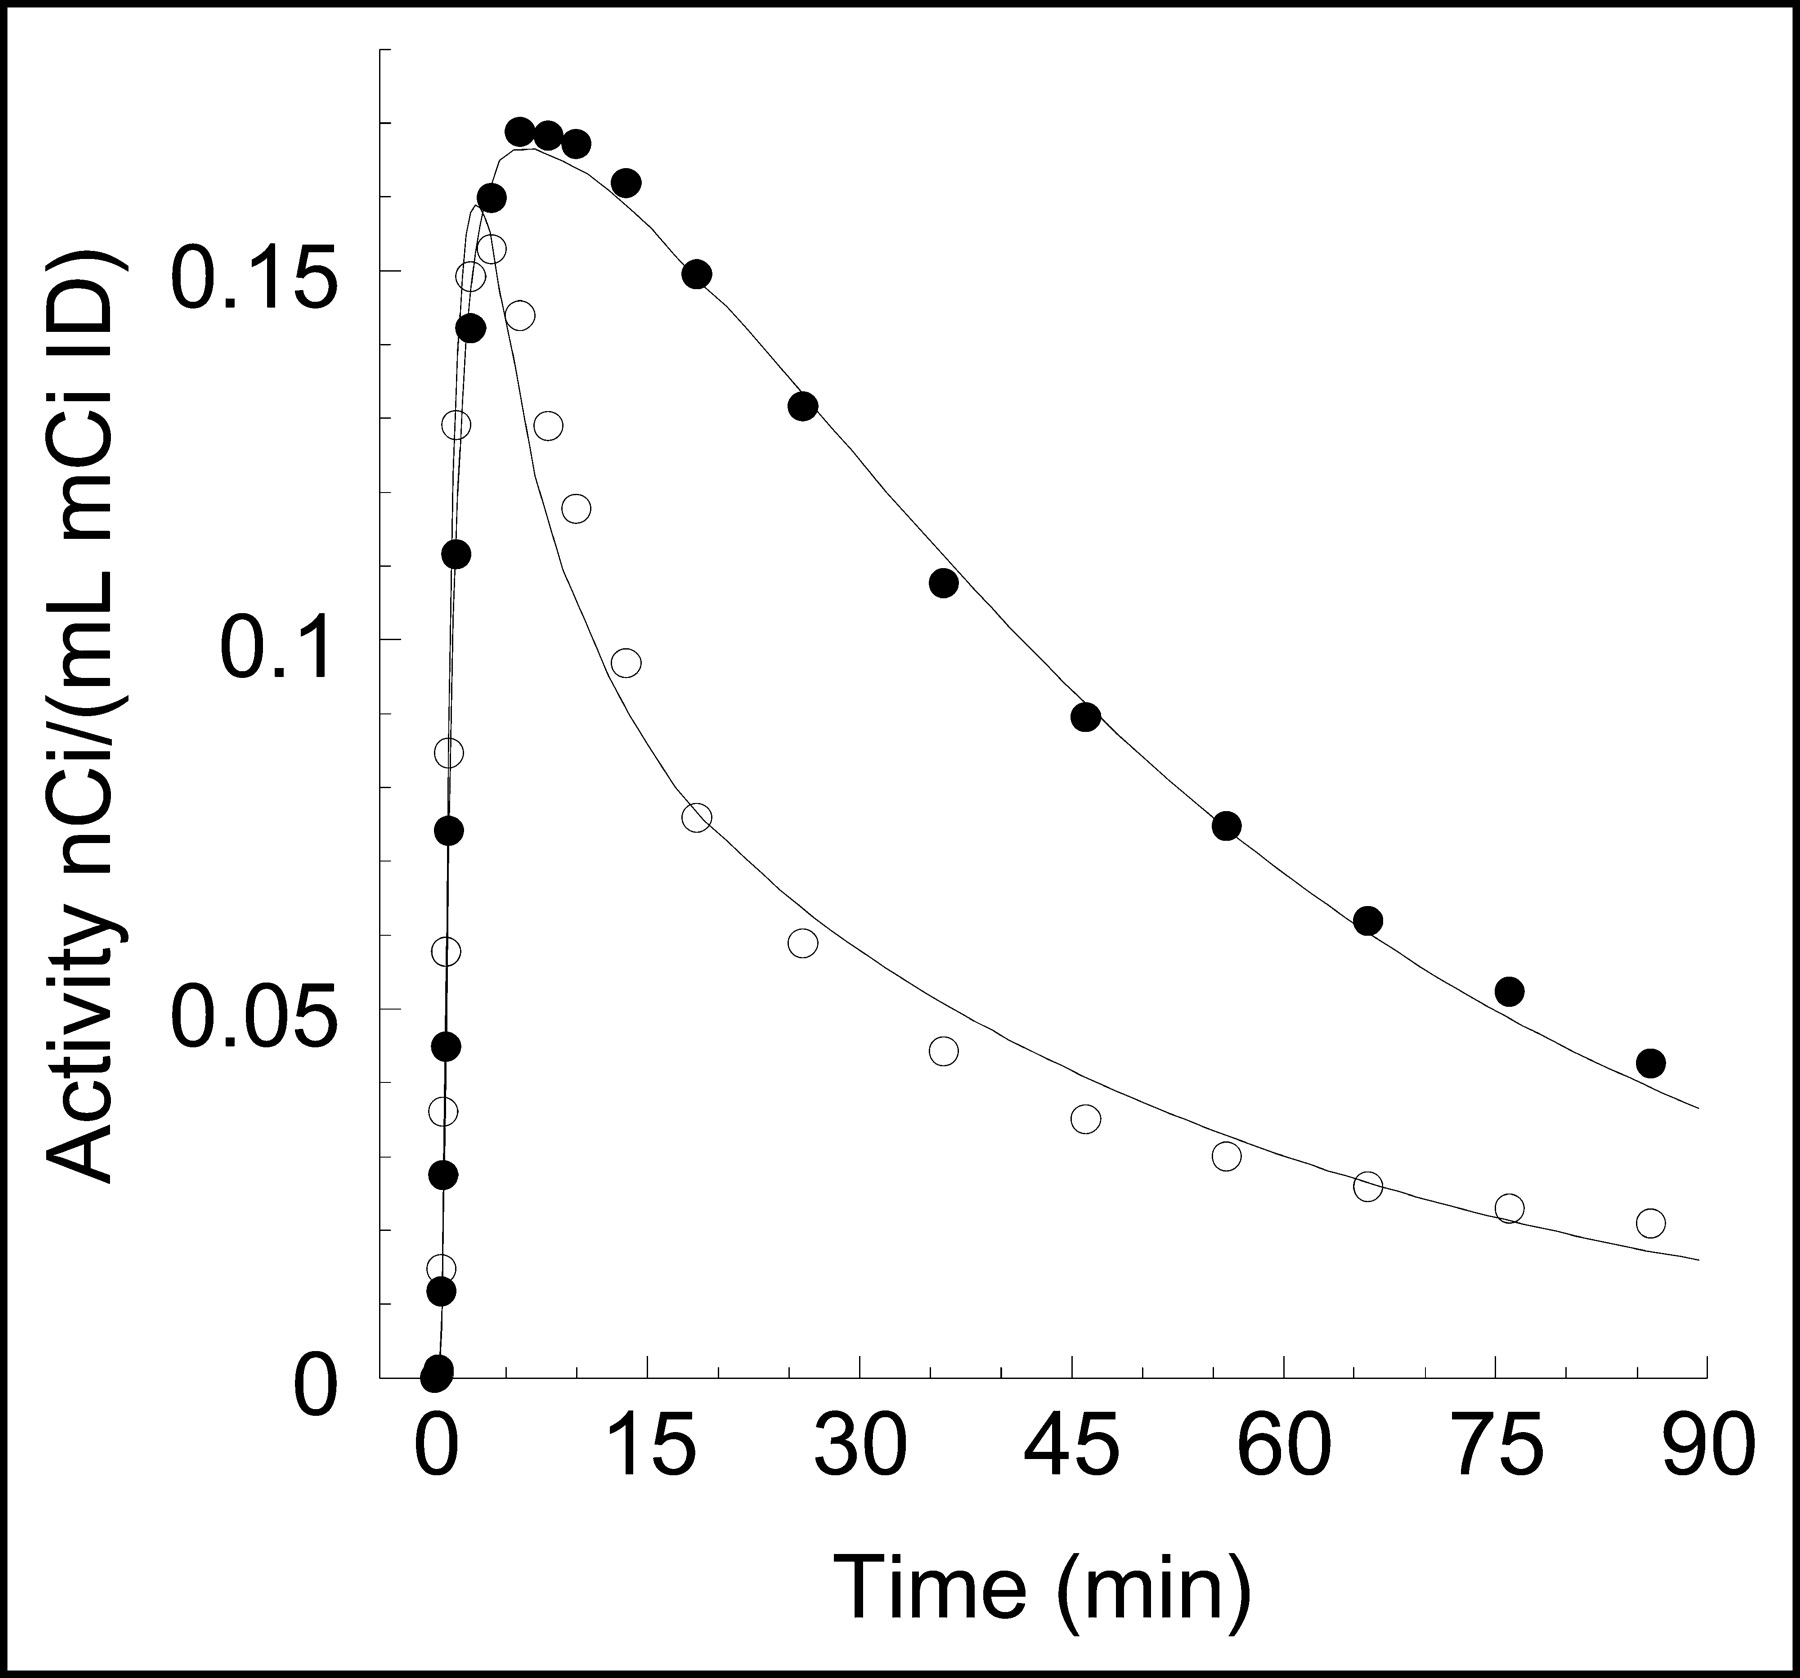
- FIGURE 2.
Plasma 11C-NPA measurements in a typical experiment. ○ = total plasma activities; • = activities corresponding to unmetabolized 11C-NPA. Lines are values fitted to a sum of 3 exponentials.
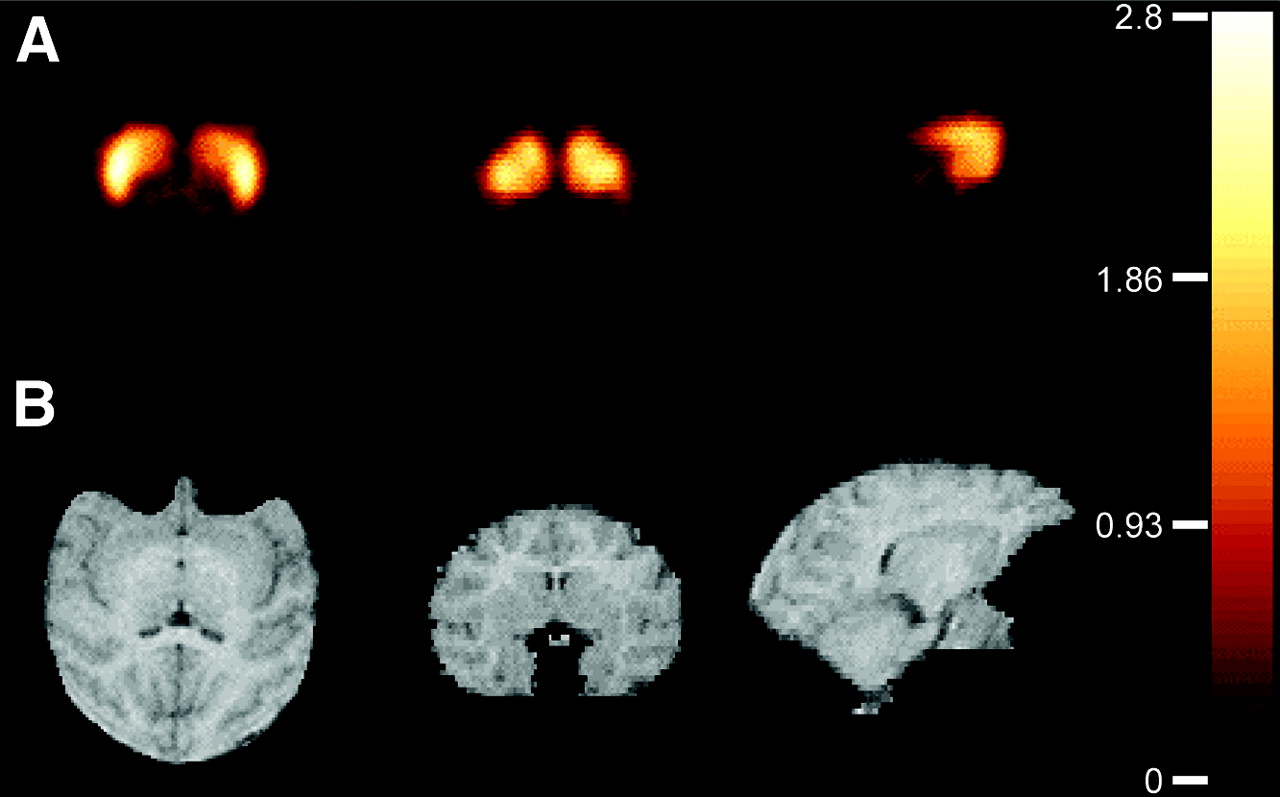
- FIGURE 3.
Voxelwise V3″ map from a study (A) with coregistered MRI (B) of corresponding slices. Transaxial, coronal, and sagittal views are shown (left to right), all at the level of the striatum. These images were created by deriving VT in each voxel with kinetic analysis (1TCM) and applying Equation 3 on each voxel. Colors were scaled to V3″ values (0–2.8). Kinetic analysis was performed using a basis function approach (27) in the MATLAB environment on a 1.2-GHz personal computer running the Linux operating system and completed in approximately 15 min per brain.
- FIGURE 4.
Time-activity curves in cerebellum (○) and striatum (•) after injection of 11C-NPA. Points are measured values. Lines are values fitted to a 1TCM.
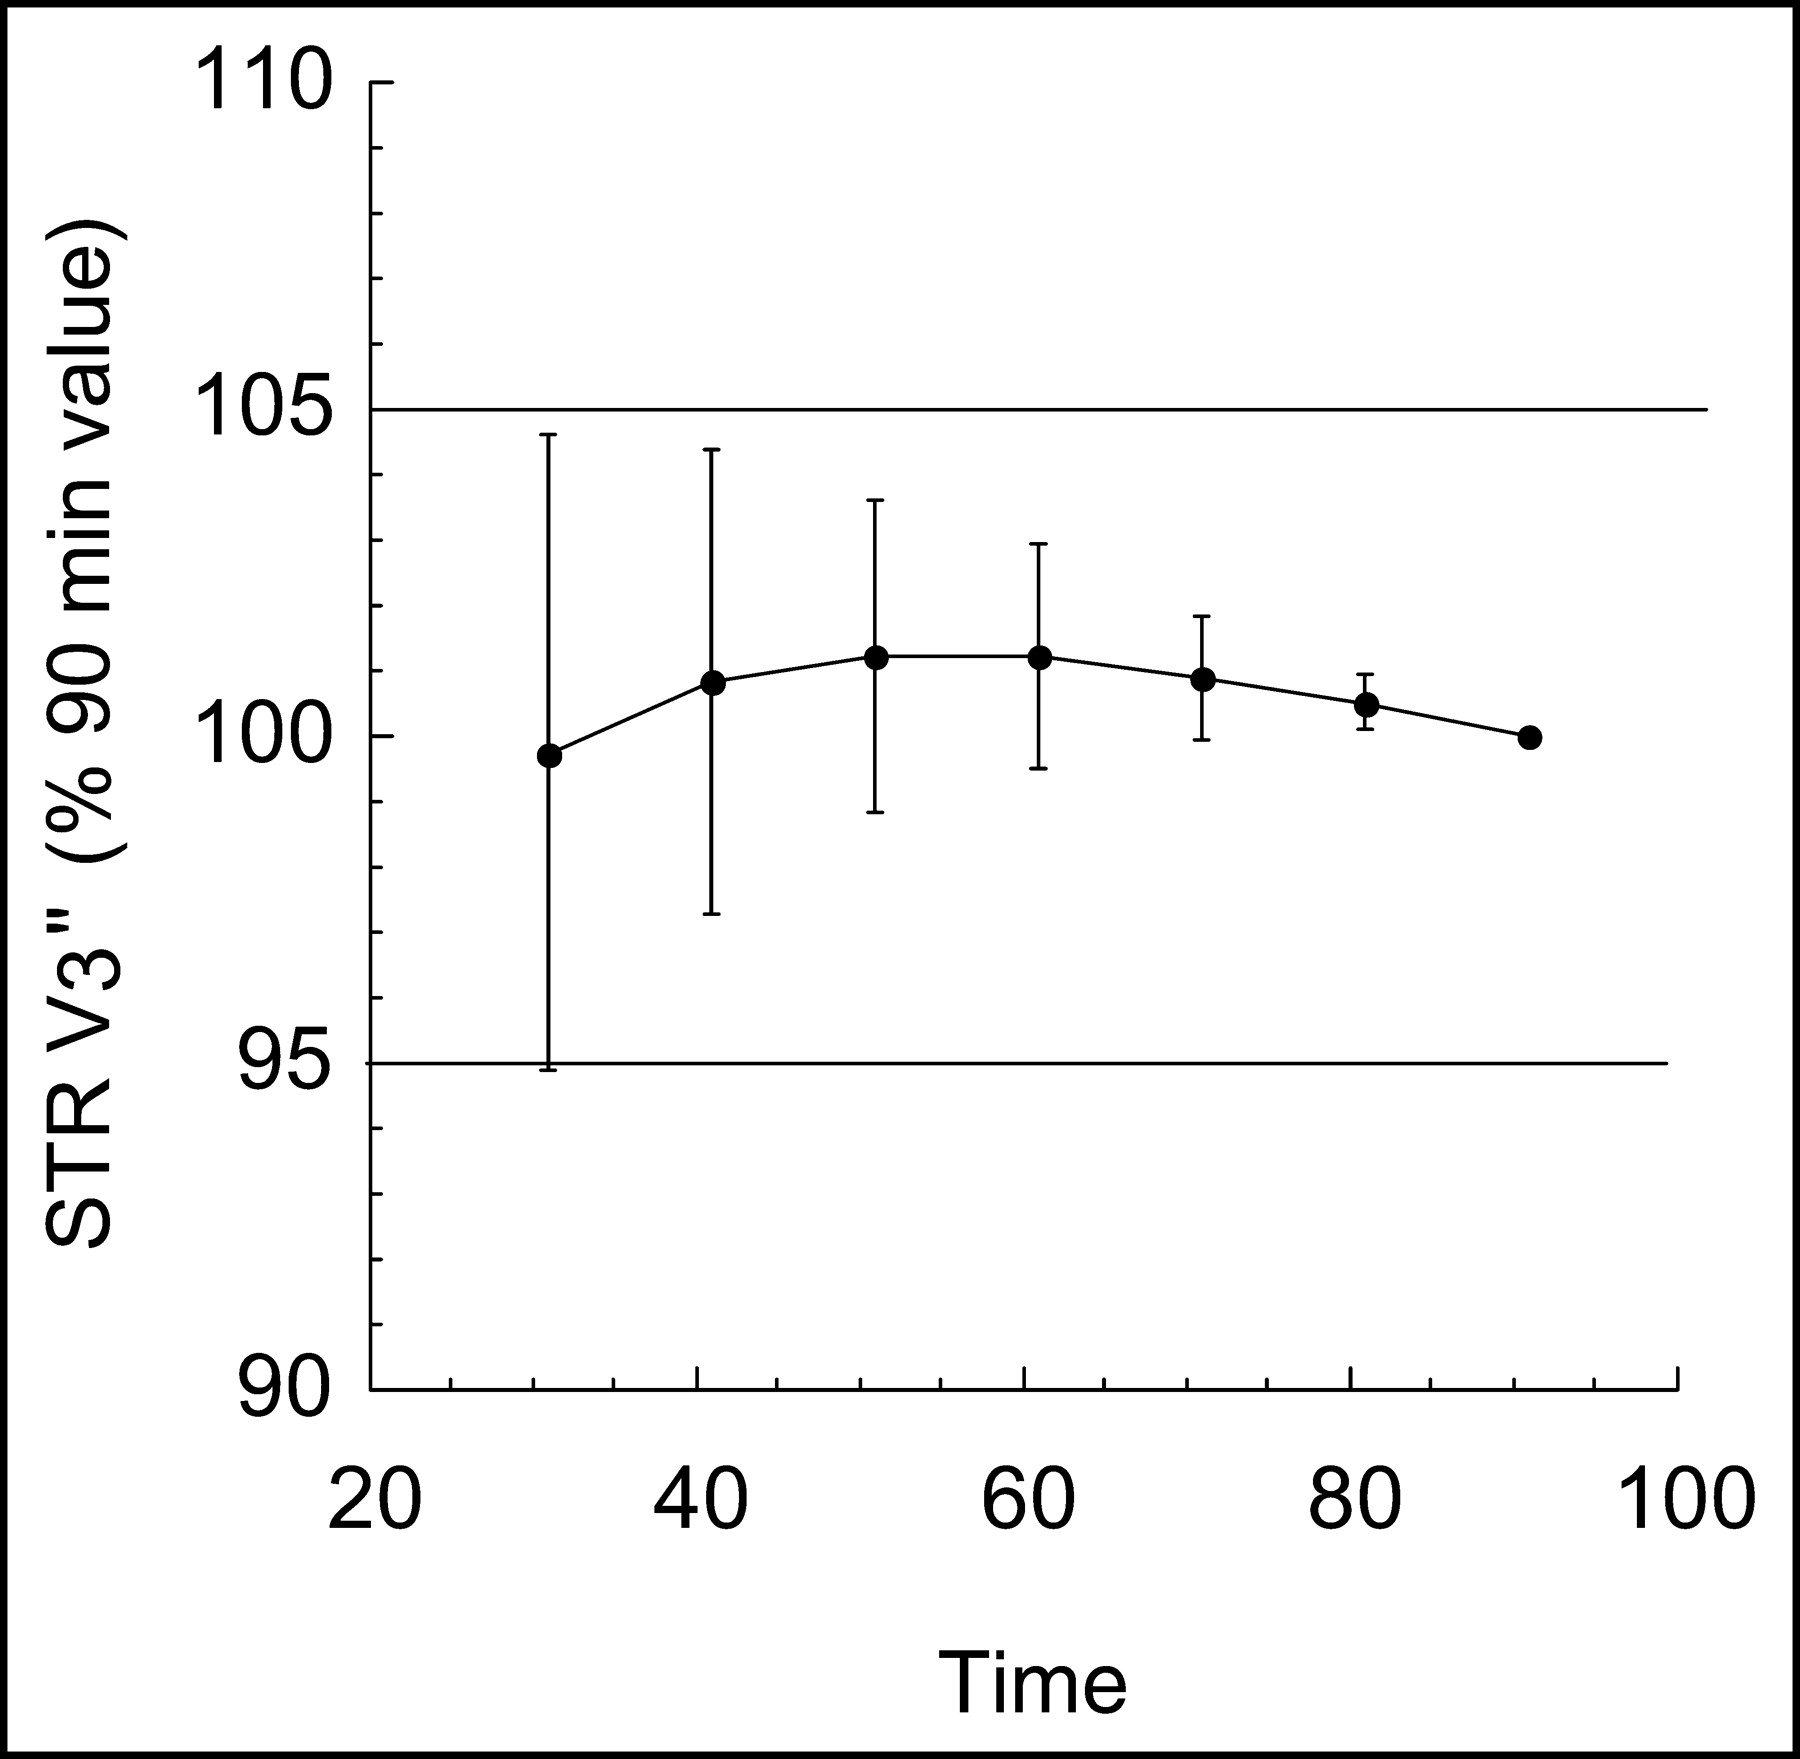
- FIGURE 5.
Relationship between scan duration and estimates of striatum V3″ by kinetic analysis. For each scan duration, estimated V3″ values were expressed in percentages of the value derived with the complete dataset (90 min). Each point is the average and SD of the 8 datasets. Decreasing the duration of scanning time from 90 to 30 min would induce only small biases and errors (<10%) on the estimates of V3″.


Tables
Baboon f1 Vbol (L) CL (L/h) A 5.0% ± 0.9% 3.5 ± 0.5 30 ± 7 B 4.8% ± 0.6% 3.1 ± 0.1 29 ± 5 Average 4.9% ± 0.1% 3.3 ± 0.3 29 ± 1 ↵* Values are mean ± SD; n = 4 per baboon.
Baboon Cerebellum Striatum Kinetic analysis Graphical analysis with arterial input Kinetic analysis Graphical analysis with arterial input K1 (mL/g/min) k2 (min) VT (mL/g) (VT [mL/g]) K1 (mL/g/min) k2 (min) VT (mL/g) (VT [mL/g]) A 1.06 ± 0.21 0.29 ± 0.05 3.72 ± 0.53 3.39 ± 0.45 1.11 ± 0.28 0.13 ± 0.03 8.50 ± 1.51 8.02 ± 1.40 B 0.76 ± 0.11† 0.24 ± 0.04 3.17 ± 0.31 2.90 ± 0.26 0.67 ± 0.13† 0.10 ± 0.02 6.47 ± 0.97† 6.07 ± 0.71† Mean 0.91 ± 0.21 0.27 ± 0.03 3.44 ± 0.39 3.15 ± 0.35‡ 0.89 ± 0.31 0.12 ± 0.02 7.48 ± 1.44 7.05 ± 1.38‡ Baboon BP (mL/g) V3″ (unitless) Kinetic analysis Graphical with arterial input Kinetic analysis Graphical with arterial input Graphical with reference region input SRTM analysis A 4.78 ± 1.02 4.63 ± 0.98 1.29 ± 0.17 1.36 ± 0.17 1.35 ± 0.17 1.41 ± 0.18 B 3.30 ± 0.67† 3.17 ± 0.50† 1.03 ± 0.12† 1.09 ± 0.11† 1.08 ± 0.11† 1.13 ± 0.13† Mean 4.04 ± 1.05 3.90 ± 1.03‡ 1.16 ± 0.18 1.23 ± 0.19‡ 1.22 ± 0.17‡ 1.27 ± 0.19§ ↵* Values are mean ± SD; n = 4 per animal.
↵† Significantly different between the 2 baboons (unpaired t test; P < 0.05).
↵‡ Significantly different from values derived with kinetic analysis (paired t test; P < 0.05).
↵§ Significantly different from values derived with kinetic analysis (paired t test; P < 0.001).
Comparison Outcome Difference Regression equation y = mx + c r2 Graphical with arterial input versus kinetic VT CER −9.4% ± 4.7%† 0.80x + 0.36 0.93 VT STR −6.2% ± 3.7%† 0.91x + 0.20 0.97 BP −3.5% ± 4.2%* 0.95x + 0.04 0.97 V3″ −5.3% ± 4.0%* 0.98x + 0.08 0.89 Graphical with reference region input versus kinetic V3″ −4.5% ± 3.7%* 0.99x + 0.05 0.91 SRTM versus kinetic V3″ −8.5% ± 2.5%† 1.04x + 0.05 0.95
In this issue


Jump to section
Related Articles
Cited By...
- 18F-MCL-524, an 18F-Labeled Dopamine D2 and D3 Receptor Agonist Sensitive to Dopamine: A Preliminary PET Study
- Human Biodistribution and Dosimetry of the D2/3 Agonist 11C-N-Propylnorapomorphine (11C-NPA) Determined from PET
- Measurement of the Proportion of D2 Receptors Configured in State of High Affinity for Agonists in Vivo: A Positron Emission Tomography Study Using [11C]N-Propyl-norapomorphine and [11C]Raclopride in Baboons