


Abstract
Our aim was to assess the feasibility of using PET for quantifying metabolic response after intraarterial 90Y-glass microspheres for metastatic colorectal cancer to the liver by comparing visual estimates with hepatic standardized uptake values (SUVs). Methods: Twenty-seven patients (15 men, 12 women; age, 68 ± 12 y [±SD]) with metastatic colorectal cancer to the liver, and tumor progression despite polychemotherapy, were included. All patients had baseline CT or MRI, 18F-FDG PET, hepatic angiography, and intraarterial 99mTc-labeled macroaggregated albumin scanning. Patients were treated with 90Y-glass microspheres and were monitored for 3 mo using PET and serum carcinoembryonic antigen. The average absorbed dose was 139 ± 22 Gy. All treatments were performed on a lobar basis. For each case analyzed, regions of interest were drawn along the liver edge to measure SUVs on maximum-intensity-projection (MIP) and resliced axial images. Concomitantly, the visual estimate was graded as +1, 0, −1, −2, or −3 for progression, no change, and mild, moderate, and dramatic improvement at posttreatment PET. Results: Visual estimates placed 20 patients in the response category (−3 to −1) and 7 patients in the nonresponse category (0 to +1). There was a significant drop in the median SUV on the resliced axial images from 10,455 at baseline to 9,075 after treatment (P = 0.011) for the entire group. The percentage of metabolic response was significantly greater in the response group compared with that of the nonresponse group (−26% ± 25% vs. +6% ± 15%, P = 0.004). This correlated significantly with the respective visual estimates (r = 0.75, P < 0.0001). Furthermore, the direction of change agreed in 85% of patients using both methods. There was no significant correlation when the SUV from the simplified MIP images were used in the coronal or sagittal manner. Conclusion: It is feasible to quantify reduction of hepatic tumor metabolism objectively after 90Y treatment for unresectable metastatic disease to the liver. SUVs of the entire axial slices of liver agree well with subjective visual evaluations. Quantitative PET is a useful technique in the treatment response evaluation of patients after 90Y-glass microspheres.
Metastases from colorectal cancer occur frequently in the liver. PET has become an integral tool in the initial diagnosis, staging, and evaluation of response to chemotherapy (1,2). Preliminary studies have suggested the effectiveness of intraheptic arterial 90Y therapy of unresectable colorectal liver metastases (3). 90Y-Glass microspheres (90Y2O3-Al2O3-SiO2), where 90Y is an integral constituent of the glass matrix, have been shown to be chemically durable for in vivo delivery of β-radiation (4). The glass microspheres (TheraSphere; MDS Nordion) are introduced via the hepatic artery that supplies the majority of blood flow to the tumors. Microspheres are trapped in the tumor capillary bed and exert a local radiotherapeutic effect. A preliminary report (3) compared different methods of evaluating liver lesions after 90Y treatment and suggested the use of 18F-FDG PET to evaluate for treatment response. To our knowledge, there are no objective methods available to evaluate the treatment response in the entire liver by this mode of therapy for liver metastasis from colorectal cancer. The objectives of this study were to assess the feasibility of quantifying reduction of tumor metabolism after intraarterial 90Y-glass microspheres (TheraSphere) for metastatic colorectal cancer to the liver by comparing visual estimates of liver treatment response by PET scans with standardized uptake values (SUVs) of the liver. Part of the investigation has been reported in an abstract form (5).
MATERIALS AND METHODS
Twenty-seven consecutive patients (15 men, 12 women; age, 68 ± 12 y [±SD]) with previously resected colorectal cancer who were refractory to at least 2 polychemotherapy regimens (5-fluorouracil, leucovorin, ± irinotecan hydrochloride) and eligible for 90Y-glass microsphere treatment were included. None of the patients were surgical candidates. Some patients also had tried capecitabine (a 5-fluorouracil precursor). Most of the patients had acceptable Eastern Cooperative Oncology Group (ECOG) (5) performance status (ECOG 2, n = 1; ECOG 1, n = 7; ECOG 0, n = 19). Eligibility for 90Y treatment was based on the following inclusion criteria (6): age, ≥18 y; ECOG performance status, ≤2; and confirmed diagnosis of surgically unresectable metastatic colorectal cancer. Patients were excluded from treatment if they were pregnant or had significantly abnormal pretreatment laboratory findings (absolute granulocyte count, <1,500/mL; platelet count, <75,000/mL; serum creatinine, >2.0 mg/dL; or serum bilirubin, >3.0 mg/dL), any contraindications to angiography or selective visceral catheterization, significant extrahepatic disease representing an imminent life-threatening outcome, pulmonary insufficiency, active uncontrolled infection, or any other significant underlying medical or psychiatric illness.
All patients had baseline CT or MRI, 18F-FDG PET, hepatic angiography, 99mTc-labeled macroaggregated albumin (99mTc-MAA) scanning, and serum serum carcinoembryonic antigen (CEA). Patients were monitored at 3 mo after the last treatment using 18F-FDG PET and CEA. None of the patients received chemotherapy during the course of the treatment regimen. The treatment protocol was approved by the Institutional Review Board of William Beaumont Hospital. All patients signed informed consents authorizing the use of the data for research purposes.
All treated patients were evaluated to confirm an acceptable risk of shunting of 90Y microspheres to the lungs (<30 Gy) and nondetectable flow to the gastrointestinal organs. Lung shunting was assessed using intrahepatic arterial 99mTc-MAA scanning (F = 100% × lungs/[lungs + liver + stomach]). In patients with hepatic tumors, a portion of the arterial supply may bypass the capillary bed and drain directly into the venous system. Those microspheres that are not trapped in the liver will be shunted via the heart and deposited in the lungs. Thus, a lung shunting measurement is essential before the treatment to obtain a unique shunting fraction (F) for the given physiology and anatomy of the hepatic tumors. Before treatment, planar anterior 99mTc-MAA scans were obtained within 30 min after intrahepatic arterial injection of 150 MBq 99mTc-MAA during angiography to include the lungs, liver, and stomach. Lung activity of <10% was considered insignificant shunting. Otherwise, the treatment dose was adjusted to optimize the radiation dose given to each lobe of liver at 135–150 Gy as previously outlined, but still under the upper limit of toxicity to the lungs (3). This method of lobar treatment was different than the whole-liver approach previously reported for hepatocellular carcinoma (7).
Treatment planning and administration of 90Y microspheres was performed according to previously published guidelines (2,7). Liver CT images were reviewed with special attention to the volume of the liver and the degree and distribution of tumor infiltration. Once a patient was deemed a suitable candidate for 90Y microsphere treatment based on available information, a visceral arteriogram with intrahepatic arterial 99mTc-MAA scanning was performed to define the arterial anatomy and to evaluate the amount of pulmonary and gastrointestinal flow. A treatment plan, following a lobar treatment strategy, was constructed for each patient. The amount of activity required for the target dose of 90Y microspheres was calculated using the following formula:
 The mass of the targeted lobe was determined using CT images for volume calculation with a conversion factor of 1.03g/cm3. After calculating the required activity to be injected, 90Y was allowed to physically decay to the appropriate activity before injection. 90Y-Glass microspheres were injected into a percutaneous catheter inserted via the femoral artery and directed to the targeted liver lobe. The dose delivered to the liver was calculated using the following formula (3):
 where the lung shunt fraction (F) was obtained as the ratio of counts in the lungs to the total counts in the abdomen and lungs, as measured by intrahepatic arterial 99mTc-MAA scanning. The radiation dose to the lungs was estimated assuming a uniform microsphere distribution using the formula of Berger (8):
 where the total lung mass, including blood, was assumed to be 1 kg according to Synder et al. (9).
Patients were considered eligible for 90Y microsphere treatment if the lung shunt fraction would result in a cumulative estimated dose of <30 Gy to the lungs. If there was no observable uncorrectable gastrointestinal flow and if the liver reserve and tumor vascular anatomy were judged to be suitable for treatment, the calculated activity of 90Y microspheres was administered to the target hepatic lobe by intraarterial infusion at low pressure (20–40 psi) under strict aseptic conditions, following institutional radiation safety guidelines and the manufacturer’s instructions. Treatment was delivered on an outpatient basis. Patients were observed in recovery for 4–6 h for stability of vital signs, bleeding complications, or signs or symptoms of acute radiation injury and were discharged home when they were clinically stable and without complaints.
Patients with bilobar disease or those undergoing prophylactic contralateral lobar therapy were scheduled for treatment of the opposite lobe within 30–60 d after initial treatment. To determine eligibility for retreatment, patients had repeated laboratory tests, including a hepatic function panel and cross-sectional imaging. At the time of retreatment evaluation, consideration of the total dose to the lungs was based on the cumulative dose over all prior treatments so as not to exceed a total estimated cumulative dose of 30 Gy to the lungs. In patients with complex tumor presentations who required >2 treatments to achieve tumor coverage, or in patients being retreated for the second (contralateral) lobe, the safety reevaluation was repeated before each treatment and the calculation of cumulative lung dose included all prior treatments. Usually, patients required one or more treatments, depending on the severity and location of the hepatic disease.
Dedicated whole-body PET scans (Advance; General Electric Medical Systems) from chest to pelvis were performed 1 h after intravenous injection of 370 MBq 18F-FDG. All patients had fasted for at least 4 h to minimize competitive inhibition of 18F-FDG uptake by serum glucose. The serum glucose was normal in all patients. Tomographic images were generated by iterative reconstruction with segmented attenuation correction. Pre- and posttreatment PET images were compared visually in a digital display system and categorized into 5 grades with respect to the entire liver based on the patterns of response by PET described previously (3). To match the quantitative assessment of tumor metabolism, 5 grades of visual analyses (+1, 0, −1, −2, and −3) were defined, respectively, as progression (+1); no significant change (0); mild improvement, including the complete resolution of a single lesion (−1); moderate improvement, which included the complete resolution of 2 lesions (−2); and dramatic improvement, which included the complete resolution of multiple lesions (−3). Extrahepatic lesions were categorized by lesion and based in 5 groups: (i) negative 18F-FDG uptake in both pre- and posttreatment PET (N), (ii) significant regression with a decrease in 18F-FDG uptake in all lesions (D), (iii) partial regression with a decrease in 18F-FDG uptake in major lesions but no obvious improvement in smaller lesions (D/E), (iv) no significant change when there was equally abnormal 18F-FDG uptake in the pre- and posttreatment PET scans (E), and (v) progression with an increase in the abnormal 18F-FDG uptake or presence of new lesions (I). Since the natural history of the hepatic metastases is to progress without any treatment, significant reduction of metabolic activity of the tumor anywhere in the liver after 90Y-glass microsphere injection was considered to be a response. Thus, the visual categories of −1, −2, and −3 defined the treatment response group, whereas that of 0 and +1 defined the nonresponse group. For extrahepatic lesions, N, D, and D/E represented no progression, whereas E and I represented no improvement or progression. Regions of interest (ROIs) were drawn along the liver edge to measure SUVs on maximum intensity projection (MIP) in the coronal and sagittal (MIPc and MIPs, respectively) views and on 4–8 resliced axial images. The total SUV values were summed to include the entire liver for the total liver uptake (TLU). The percentage SUV changes in MIPc, MIPs, and TLU were calculated before and after treatment. The Wilcoxon matched signed rank test was performed for comparing the percentage changes with visual estimates. A 1-tailed paired t test was used to detect the change in CEA level. A proportional test was used to compare the different response groups. P < 0.05 was considered to be significant.
RESULTS
The average administrated dose of 90Y was 2.50 ± 1.58 GBq for an average absorbed dose of 139 ± 22 Gy. The wide SDs in the 90Y activity (in GBq) but relatively uniform treatment absorbed dose (in Gy) reflected the adjustment in dosimetry to the fact that the left lobe is smaller than the right. The average shunting fraction (F) was 2.95% ± 1.90%. None of the patients had significant lung shunting (>10%) by intrahepatic arterial 99mTc-MAA scanning. Six patients required only 1 treatment for unilobar disease, whereas 21 patients required 2 treatments for bilobar treatments. Three of 21 patients received prophylactic contralateral lobe treatment without anatomic and metabolic evidence of metastases at the time of treatment (3). Nine of the 27 patients showed no evidence of extrahepatic disease at the time of treatment. The results of treatment follow-up by PET are summarized in Table 1. Visual estimates placed 5, 3, 12, 3, and 4 patients in the response categories of −3, −2, −1, 0, and +1, respectively. There was significant response as a whole group in the median SUV on the resliced axial images from 10,455 to 9,075 after treatment (P = 0.011), reflecting a significant reduction in tumor metabolism (Figs. 1 and 2). Twenty patients (74%) showed response after 90Y treatment in the liver by visual analysis (Figs. 1 and 2), whereas 7 of 27 patients (26%) showed no response in the liver by PET (Fig. 3, P = 0.0002). The mean percentage reduction in tumor metabolism measured by TLU was significantly larger in the response group (−26% ± 25%) than that of the nonresponse group (+6% ± 15%, P = 0.004). The percentage changes before and after treatment for each patient (ranging from −76% to +24%) were also correlated significantly with respective visual estimates (ranging from −3 to +1) (r = 0.75, P < 0.0001). These 2 methods agreed in the direction of change in 85% patients. However, there was no significant correlation when the SUV from the simplified MIP images were used in both coronal and sagittal planes.
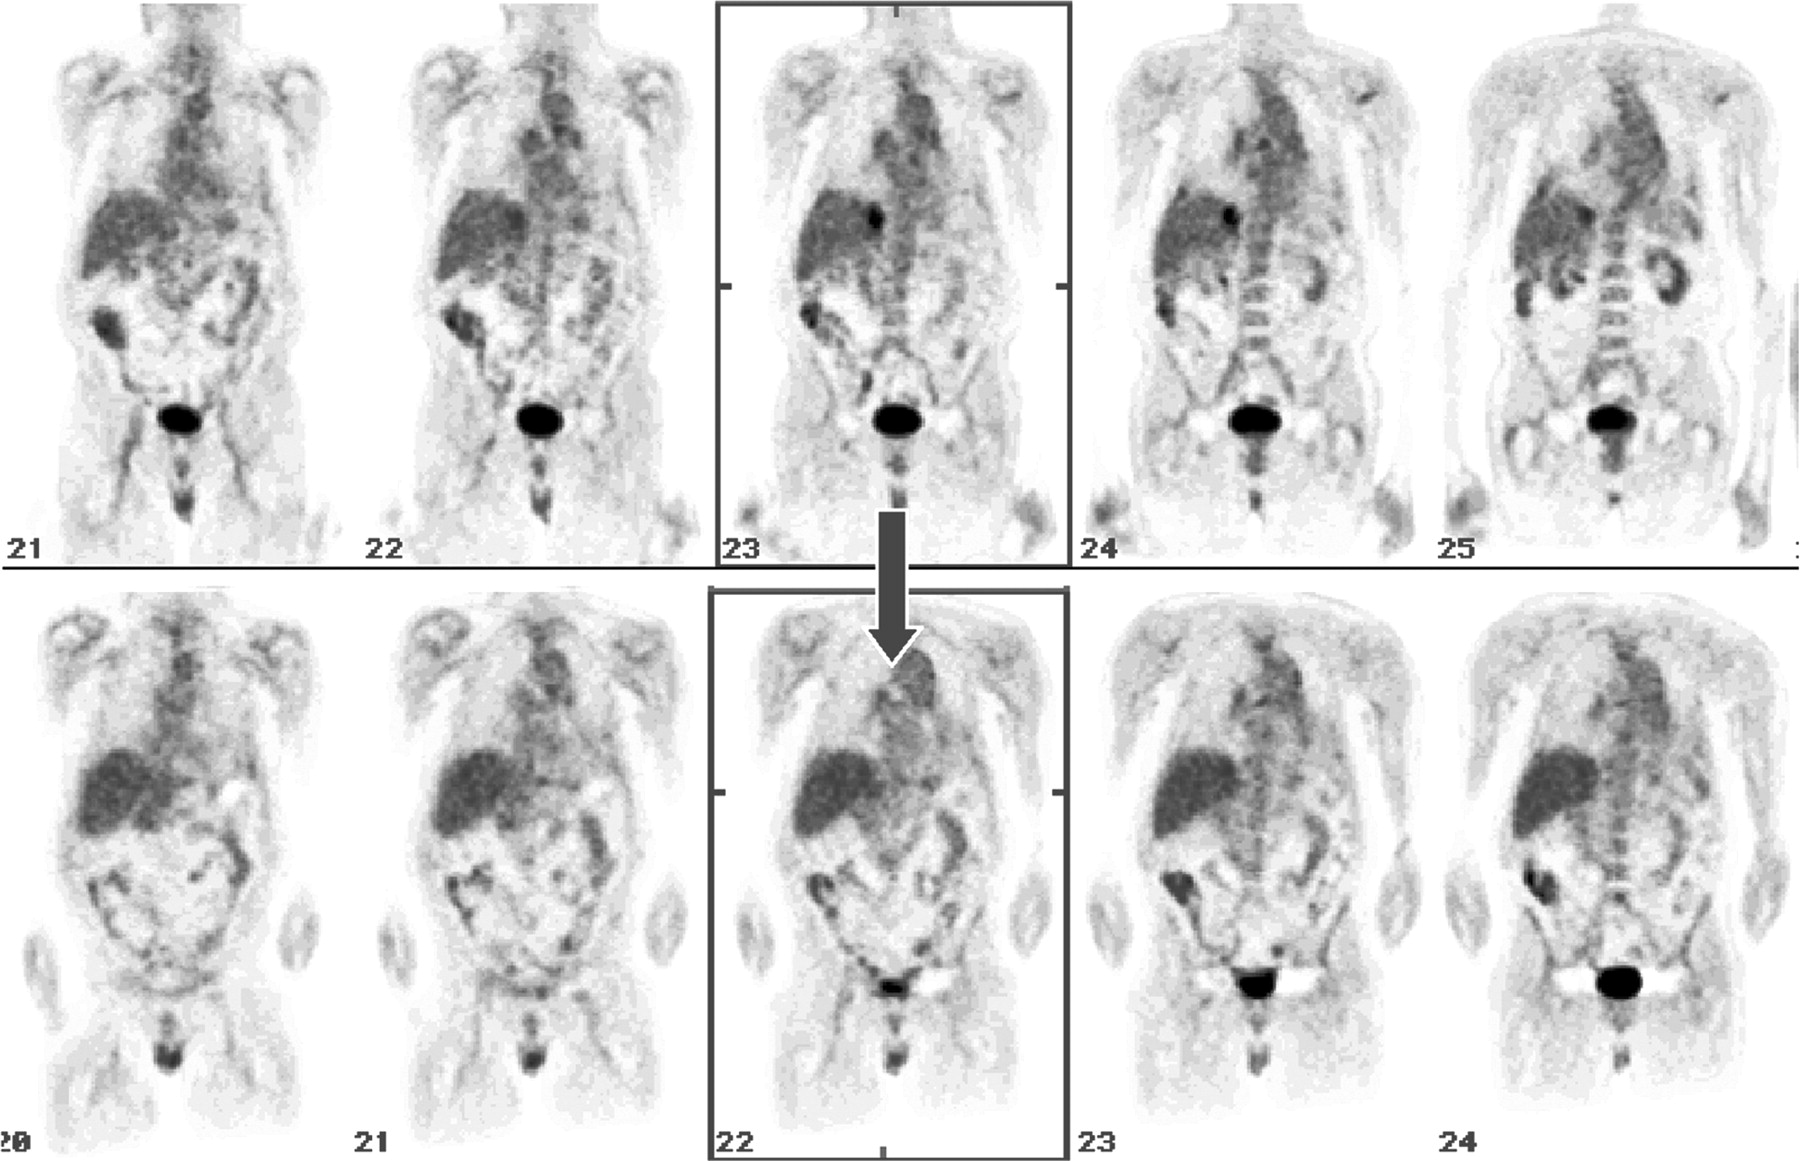
Coronal 18F-FDG PET images from scanning before treatment (top) show solitary liver metastasis and extrahepatic disease. Corresponding images from scanning after treatment (bottom) reveal complete resolution of hepatic lesion by visual analysis (score = −1). SUV of total liver uptake was reduced by −4%, reflecting significant reduction but overall small change in tumor metabolism when compared with entire mass of liver that was included in quantitative analysis. Given the presence of extrahepatic disease, CEA level did not change significantly, from 14 to 19 ng/mL. Corresponding CT scan (not shown) revealed minimal decrease in size of hepatic lesion.

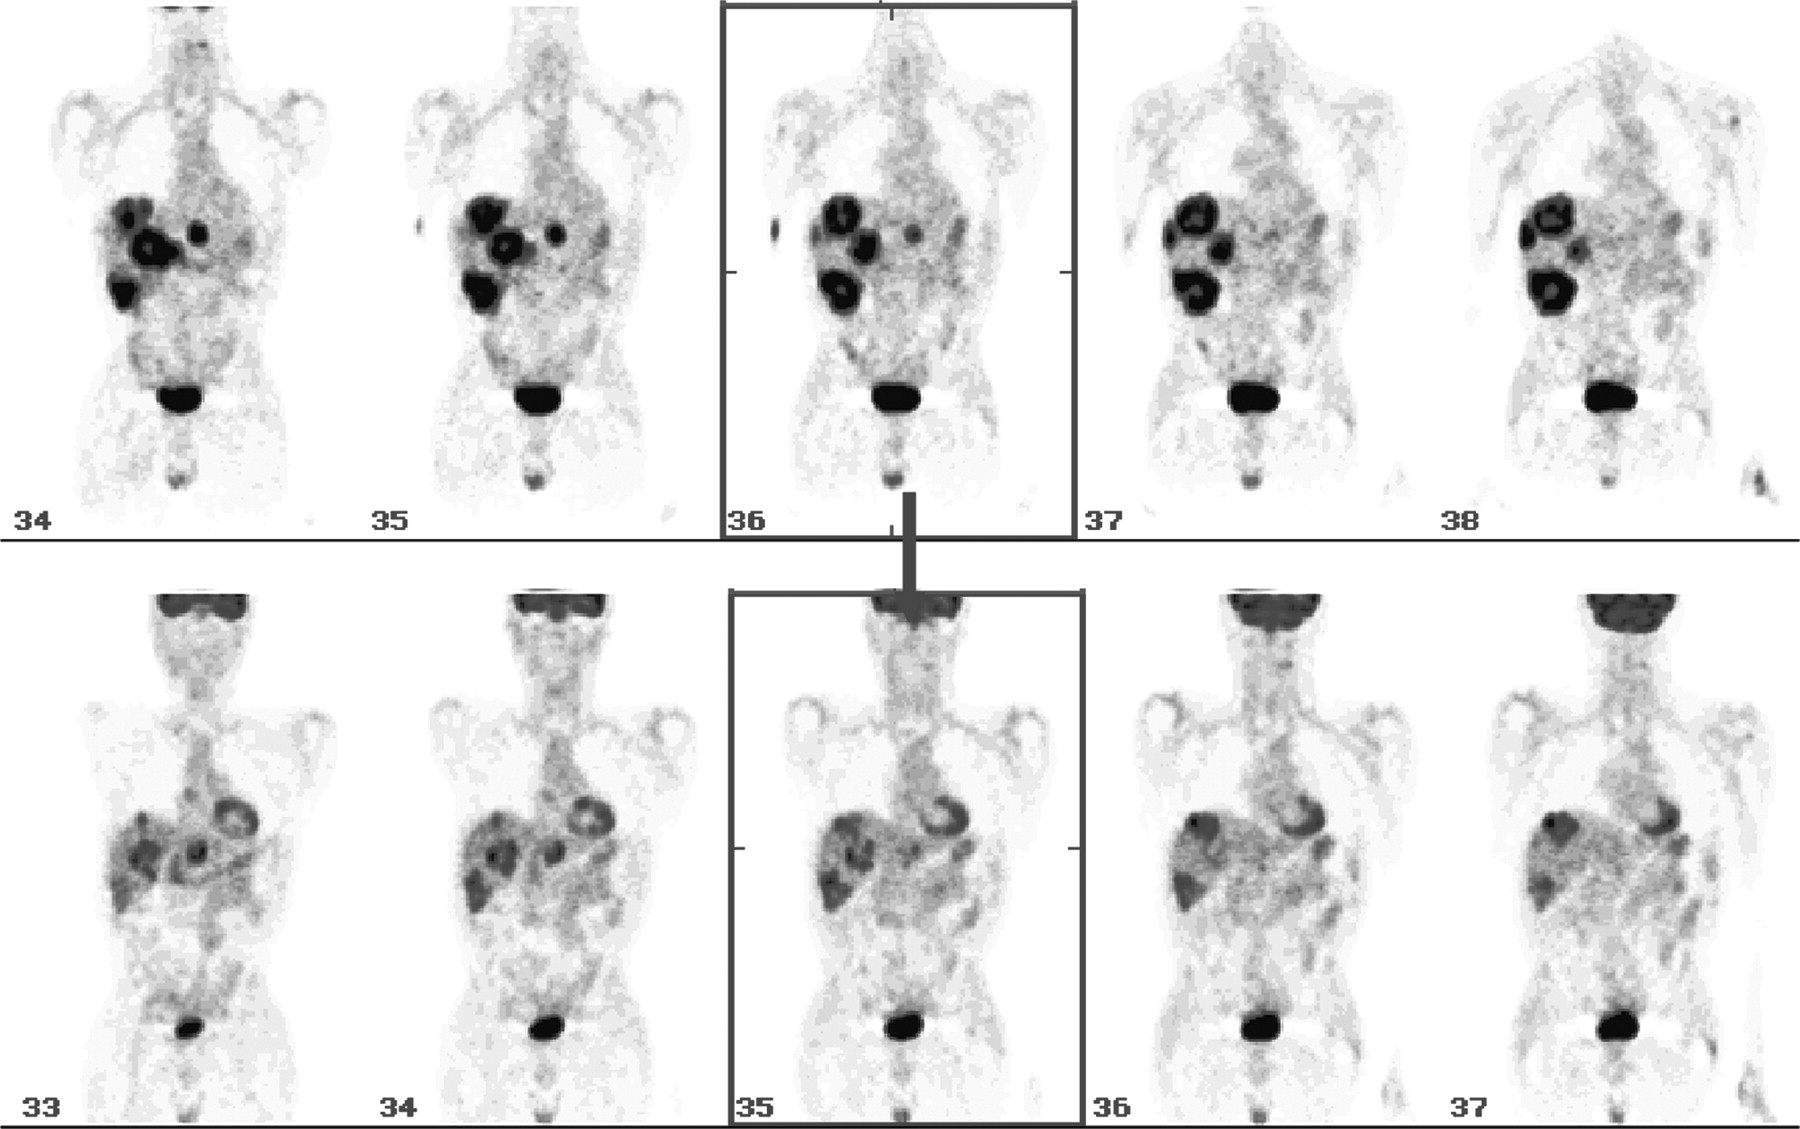
Coronal 18F-FDG PET images from scanning before treatment (top) show extensive liver metastases with central necrosis. Images from scanning after treatment (bottom) reveal significant visual resolution (score = −3) of hepatic lesions. SUV of total liver uptake (TLU) was reduced significantly by −22%, reflecting large reduction in tumor metabolism. CEA level also decreased dramatically from 187 to 17 ng/mL.

Bar chart shows response in liver lesions by 18F-FDG PET after 90Y-glass microsphere treatment (P = 0.0002) compared with overall deterioration of untreated extrahepatic lesions (P = 0.007). y-Axis represents number of patients; x-axis shows response categories. R = response in hepatic (H) lesions; Non-R = nonresponse in hepatic (H) lesions; Non-P = nonprogression in extrahepatic (extra-H) lesions; Non-I = nonimprovement or progression in extrahepatic (extra-H) lesions.
Results of Visual and Quantitative Analyses for Hepatic Lesions in 27 Patients
Six of 9 patients without extrahepatic disease at baseline PET remained negative after intrahepatic 90Y treatment. On the other hand, after excluding these 6 patients without extrahepatic disease, 18 of the remaining 21 patients (86%) showed either no improvement or progression of the extrahepatic disease (P < 0.0001) (Table 2). This is not surprising, as this type of treatment represents liver-directed therapy and does not address extrahepatic sites. Three patients showed mild improvement on PET in the lymph node region draining the liver, such as the periportal lymph node plexus. This is most likely due to the regression of the primary hepatic lesions draining into that nodal plexus. Twenty-three patients had elevated CEA before treatment. The other 4 patients were CEA nonproducers (<5 ng/mL). Although serum CEA showed a decreasing trend in the entire patient cohort, this finding did not reach statistical significance. The most likely explanation for this is tumor marker production by extrahepatic sites (CEA: baseline = 1,249 ± 3,438 ng/mL, after treatment = 654 ± 1,146 ng/mL, P = 0.13). However, there was a significant reduction in CEA levels in the 4 patients who were CEA producers who had no extrahepatic disease (baseline = 93.4 ± 64.0 ng/mL, after treatment = 13.3 ± 8.9 ng/mL, P = 0.038). None of the patients had any significant complications and all felt subjectively better after treatment. The performance status did not change for all but 4 patients. The reason for deterioration was extrahepatic progression in 2 and unrelated medical illness in the other 2 patients.
Response Categories for Extrahepatic Metastases in 27 Patients
DISCUSSION
Recent studies suggest that PET has changed the conventional management of patients with colorectal cancer. PET has greater sensitivity in detecting recurrence or metastases when compared with CT (1,10–12). Our prior preliminary study suggested a large discrepancy in the anatomic and metabolic response after 90Y-glass microsphere therapy (3). In keeping with previous reports, this prospective study was designed to include only PET for assessing the final response after 90Y-glass microsphere treatment (11,12). A quantitative method for evaluating the therapeutic effect of 90Y-glass microspheres has not been described. In the present study, PET showed overwhelming evidence of a metabolic response for colorectal metastatic cancer to the liver after 90Y-glass microsphere treatment by both quantitative and visual analyses. Nonetheless, visual analysis of PET was important as it could assess small or minimally active residual intra- and extrahepatic disease. These types of observations are not possible using liver-only TLU analyses. A previous study (3) used traditional, but tedious, target lesion-by-lesion visual analysis. The same study also addressed the possibility of prophylactic treatment to the lobe of the liver unaffected by tumor for micrometastases that might exist beyond the detection limits of both anatomic and functional imaging (3). Three of the 27 patients in the present study received prophylactic treatment to a lobe unaffected by tumor. Given the high likelihood of tumor recurrence, prophylactic treatment to unaffected hepatic lobes might be better reserved for a later date when disease progression is documented.
The metabolic response corresponded to the reduction in tumor load as approximated by measurement of CEA. The trend of CEA reduction did not reach significant levels likely secondary to the presence of extrahepatic disease. Therefore, in patients with extrahepatic disease, CEA appears to have limitations when used for follow-up assessments. PET evaluation of the entire liver with quantification appears to be the optimal method of assessing response to this form of local brachytherapy. PET becomes even more crucial for patients whose cross-sectional imaging findings might not substantially change or for patients who are serum CEA negative (<5 ng/mL).
It appears feasible to quantify PET changes objectively after 90Y-glass microsphere therapy. Measured changes in total liver 18F-FDG uptake agree well with those of visual estimates in the majority of cases. It appears that the objective and quantitative measurement of global liver uptake is a very useful approach when multiple large metastatic foci are present. In such circumstances, visual estimates might be misleading. Although the quantitative method offers an objective evaluation, the method is limited by several factors. The SUV is invalid if there is infiltration of tracer. This quantitative approach may not be sensitive in cases where there are multiple small foci or a relatively small amount of metabolically active tumor compared with the mass of the liver. As such, the PET signal of the metastatic lesions may be diluted by the surrounding normal hepatic uptake. In such cases, the visual estimate may be superior, subject to the clinical experience and threshold of the interpreting physician. The measured liver uptake obtained from the single-slice MIP image was easy to obtain but proved to be statistically noisy and did not agree with the visual estimate. Hence, it should not be used as a shortcut to evaluate the changes after the therapy.
Overall the results of quantitative and visual PET evaluation suggest that 90Y-glass microsphere therapy reduces hepatic tumor metabolism significantly and appears to be palliative in patients with unresectable liver metastases.
CONCLUSION
To our knowledge, this is the first report describing objective PET measurement to assess the therapeutic effect of 90Y-glass microsphere therapy for liver metastasis from colorectal cancer. Intraarterial 90Y-glass microsphere therapy results in the significant reduction of tumor metabolism in patients with colorectal liver metastases, as evaluated visually and quantitatively by 18F-FDG PET but only marginally overall by serum CEA due to the presence of extrahepatic metastasis. The SUV of total TLU, and not that obtained from simple MIP, agrees well with visual estimates. This information is useful in the clinical interpretation of the therapeutic effect of 90Y-glass microspheres. PET plays an integral role in the follow-up of patients with unresectable liver disease treated with 90Y-glass microspheres.
Acknowledgments
The authors express much gratitude to Marianne Gaskill, CNMT, Ann Marie Spaulding, CNMT, and David Kondas, CNMT, for their work on PET; and to Dr. Darlene Fink-Bennett for triage of patients, Ram Sharma, PhD, for production of 18F-FDG, and the radiology technologists for their various roles in the study. Dr. Riad Salem is a consultant for MDS Nordion (Ottawa, Ontario, Canada).
Footnotes
Received Feb. 10, 2004; revision accepted May 21, 2004.
For correspondence or reprints contact: Ching-yee Oliver Wong, MD, PhD, Positron Diagnostic Center and Cyclotron, Department of Nuclear Medicine, William Beaumont Hospital, 3601 W. Thirteen Mile Rd., Royal Oak, MI 48073-6769.
E-mail: owong{at}beaumont.edu
In this issue


Jump to section
Related Articles
Cited By...
- Validation of Several SUV-Based Parameters Derived from 18F-FDG PET for Prediction of Survival After SIRT of Hepatic Metastases from Colorectal Cancer
- 18F-FDG PET/CT Predicts Survival After Radioembolization of Hepatic Metastases from Breast Cancer
- Phase III Trial Comparing Protracted Intravenous Fluorouracil Infusion Alone or With Yttrium-90 Resin Microspheres Radioembolization for Liver-Limited Metastatic Colorectal Cancer Refractory to Standard Chemotherapy
- JNM Supplement on Molecular Radiotherapy
- Advantage of 188Re-Radiopharmaceuticals in Hepatocellular Cancer and Liver Metastases