


Abstract
Because limited resection could yield an equally good surgical outcome as standard anterior resection in temporal lobe epilepsy (TLE), the differentiation of medial from lateral TLE is important. We tried to find the differential features in metabolic abnormalities between medial and lateral TLE groups using quantitative analysis including statistical parametric mapping (SPM). Methods: We examined 113 18F-FDG PET scans of TLE patients who had surgically and pathologically proven lesions and a good surgical outcome (78 medial TLE, 35 lateral TLE). Each scan was compared with those of 22 healthy control subjects to detect hypometabolic regions using a t test of the SPM method and interhemispheric asymmetry using 2-group, 2-condition analysis on SPM. Group analysis was performed between medial and lateral TLE using mirrored PET images. The sensitivity was defined as the detection rate of hypometabolism in the ipsilateral temporal lobes, and the specificity was defined as the nondetection rate in the contralateral lobes. The extent of the hypometabolism was calculated as the number of significant voxels, and the severity was calculated by the asymmetry index (ASI), in the medial or lateral temporal lobes on Statistical Probabilistic Anatomical Map template images. Results: The hypometabolism in the temporal lobes was detected ipsilateral to the seizure focus in 76% of the TLE patients (76% in medial TLE, 77% in lateral TLE) but on the contralateral temporal lobes in 32% of the patients. After considering interhemispheric temporal asymmetry, the sensitivity was found to be 89%, and the specificity was 91% without differences between the medial and lateral TLE groups. In both medial and the lateral TLE, the hypometabolism was more prominent in the lateral cortical structures than in the medial structures. The hypometabolism in the medial temporal structures was found less frequently in the lateral TLE group, and the extent of the hypometabolism was significantly larger in the medial TLE group. ASIs of the medial temporal structure and superior temproral gyrus of lateral temporal structure were significantly higher in the medial TLE. Conclusion: SPM analysis of 18F-FDG PET in TLE patients could localize accurately the seizure focus and helped in the discrimination of the medial TLE from the lateral TLE. We suggest the lateral TLE, rather than the medial TLE, should be considered when glucose metabolism is relatively preserved in the medial temporal structures.
Temporal lobe epilepsy (TLE) is the most common type of epilepsy; however, medial TLE and lateral TLE are considered different entities because their pathologic findings, semiologies, and electroencephalographic (EEG) propagations differ between these 2 diseases. When surgical excision is considered in medically intractible TLE, the differentiation between medial and lateral TLE is important in determining the excision extent. Whereas the extent should be wider in patients with lateral TLE, surgery could be limited in patients with medial TLE to the amygdala and the hippocampus as an alternative to standard anterior temporal lobectomy (1–3). In lateral TLE, tailored temporal lobectomy saving medial structures is feasible and desirable. On the other hand, if the epileptogenic zones are not sufficiently excised, a good surgical outcome cannot be guaranteed.
Magnetic resonance imaging (MRI) is commonly performed in TLE to noninvasively determine the epileptogenic zones before the surgery. In medial TLE, hippocampal sclerosis is the most common pathologic finding, which is characterized by neuronal loss and gliosis. MRI is a reliable indicator of this hippocampal sclerosis or atrophy in the diagnosis of medial TLE with accuracy of up to 90% by visual assessment or volumetric analysis (4–7). However, in lateral TLE, although the other structural lesions such as tumors, vascular malformation, and cerebral dysgenesis are found, in a considerable portion, structural lesions are not found so that they are called nonlesional or cryptogenic. Therefore, if hippocampal sclerosis or atrophy is found on MRI, the diagnosis of medial TLE can be considered, but if neither hippocampal atrophy nor structural lesion is found on MRI, lateral TLE or other neocortical epilepsy should be considered. However, because hippocampal atrophy can be found in lateral TLE and because cortical changes can be found in medial TLE, this discrimination is not always possible on MRI (8–11).
18F-FDG PET s accepted as a useful tool for the localization of epileptogenic zones. The hypometabolic regions on a 18F-FDG PET scan correlate well with epileptogenic zones, which reveal the pathologic lesions at surgery. 18F-FDG PET is highly sensitive for the localization of the epilepsy zones in TLE, with an extremely rare false lateralization (12,13). However, the reasons for the development of this hypometabolism are as yet unclear. In medial TLE with only a mesiolimbic abnormality, the lateral temporal structures show decreased metabolism as well as medial temporal ones (14–18). The severity of hippocampal sclerosis did not correlate exactly with the temporal cortical hypometabolism in patients with TLE (18–20). The differential performance of 18F-FDG PET between medial and lateral TLE is not yet understood.
In this study, we adopted statistical parametric mapping (SPM) and probabilistic volumes of interest (VOIs) as quantitative analysis methods of the 18F-FDG PET images in patients diagnosed with medial or lateral TLE by pathology and surgical outcome. The diagnostic performance and differential features of metabolic abnormalities between the medial and lateral TLE on the quantified 18F-FDG PET were investigated by a retrospective analysis.
MATERIALS AND METHODS
Patients and Control Subjects
Between 1994 and 1997, 482 patients with medically intractable seizure were examined for the localization of their epileptogenic zones in our institute. As part of the presurgical evaluation, seizure semiology, neurologic examination, brain MRI, interictal 18F-FDG PET, and video-EEG (V-EEG) monitoring using a scalp electrode were performed. If possible, ictal or interictal 99mTc-hexamethylpropyleneamine oxime brain SPECT was also performed. Diagnoses were made on the basis of these study results by the consensus of the Epilepsy Board. If the results were ambiguous or inconclusive, invasive EEG monitoring using strip and grid or depth electrode was done on the suspected area before surgery.
During this period, 200 patients underwent surgery. Of these patients, we selected 113 TLE patients (78 medial TLE, 35 lateral TLE) who showed a good surgical outcome after a follow-up period of at least 1 y. These patients met the following criteria: (a) All patients had TLE of unilateral origin on V-EEG study or invasive EEG monitoring before surgery. (b) Patients with medial TLE showed hippocampal sclerosis on preoperative MRI but no other cortical lesions. Patients with lateral TLE included those with structural lesions (n = 24) in lateral temporal lobes such as cortical dysplasia, vascular morformation, or brain tumor and those with normal MRI findings but with massive and exclusive ictal zones in lateral temporal lobes on invasive EEG (n = 11). (c) Patients with medial TLE showed hippocampal sclerosis on pathologic examination. Patients with lateral TLE showed cortical dysplasia (n = 18), tumor (n = 9), old contusion and reactive gliosis (n = 4), vascular malformation (n = 2), and ischemic infarctions (n = 2). Demographic descriptions of patients in medial and lateral TLE groups are tabulated in Table 1. The distribution of the age and sex were not different between groups.
Clinical Features, Surgery Types, and Outcome
For SPM analysis, 22 healthy volunteers (16 men, 6 women) served as control subjects. Their mean age was 28 ± 9 y. All were right-handed and had no history of neurologic or psychologic disease or severe medical illness requiring drugs known to affect brain 18F-FDG PET studies. Written informed consent was obtained from all participants, and this study was approved by the Institutional Review Board of our hospital.
18F-FDG PET
The PET images were acquired using an ECAT Exact PET scanner (CTI-Siemens). The axial and in-plane resolutions were 4.3 and 6.1 mm, respectively. Before the radiotracer injection, a transmission scan was performed using a 68Ge rod source to yield the attenuation maps. About 30–40 min after the intravenous administration of 370 MBq 18F-FDG, 47 slices of the brain emission images were acquired over a 20-min period. Emission images were reconstructed in a 128 × 128 × 47 matrix with a pixel size of 2.1 × 2.1 × 3.4 mm using a filtered backprojection method with a Shepp filter having a cutoff value of 0.35 cycle per pixel. All reconstructed images were corrected for attenuation and the transaxial images were realigned to yield the sagittal and the coronal images.
Image Processing for SPM and SPAM Analysis
Spatial preprocessing and statistical analysis were performed using SPM 99 (Wellcome Department of Cognitive Neurology, Institute of Neurology, University College London, London, U.K.) implanted in Matlab 5.3 (Mathworks, Inc.). 18F-FDG PET images were spatially normalized into standard PET templates provided in SPM 99 with a 12-parameter affine transformation. The spatially normalized images were smoothed by convolution with an isotropic gaussian kernel with 16-mm full width at half maximum to increase the signal-to-noise ratio. To remove the effect of the global metabolism, the count of each voxel was normalized to the total count of the brain using proportional scaling. The counts from count- and spatially normalized PET images were multiplied by the probability from 98 VOIs of the Statistical Probabilistic Anatomical Map (SPAM) of the International Consortium for Brain Mapping and the probability-weighted counts were obtained objectively for all VOIs (21,22).
18F-FDG PET Image Analysis Using SPM and SPAM Method
A simple comparison of each patient’s 18F-FDG PET image with those of 22 healthy control subjects was performed using an unpaired t test with 2 contrasts on SPM to detect any regional hypometabolism. The regions were considered significant at an uncorrected level of P < 0.001 if they fell within the temporal region, which was hypothesized as an a priori region of interest. The number of the significant voxels was calculated in each VOI defined by SPAM. In addition, the accompanying hypometabolism in the extratemporal region was assessed as a separate cluster at more stringent criteria (P < 0.1, corrected).
When no hypometabolism or bilateral temporal hypometabolism was found under these criteria, the interhemispheric temporal asymmetry was examined. After flipping the 18F-FDG PET images of the patients and control subjects in the middle sagittal plane, areas showing relative hypometabolism to the regions of the contralateral hemisphere were revealed in each patient by 2-group, 2-condition analysis on the SPM (23,24).
Group comparison was performed between medial and lateral TLE using flipped mirror images. 18F-FDG PET images of 55 right TLE patients (18 lateral TLE, 37 medial TLE) were flipped to yield left-sided epileptogenic zones. After spatial and global count normalization with proportional scaling, images of apparently left medial and left lateral TLE were compared using a t test with the same threshold of uncorrected P < 0.001 as in individual analysis.
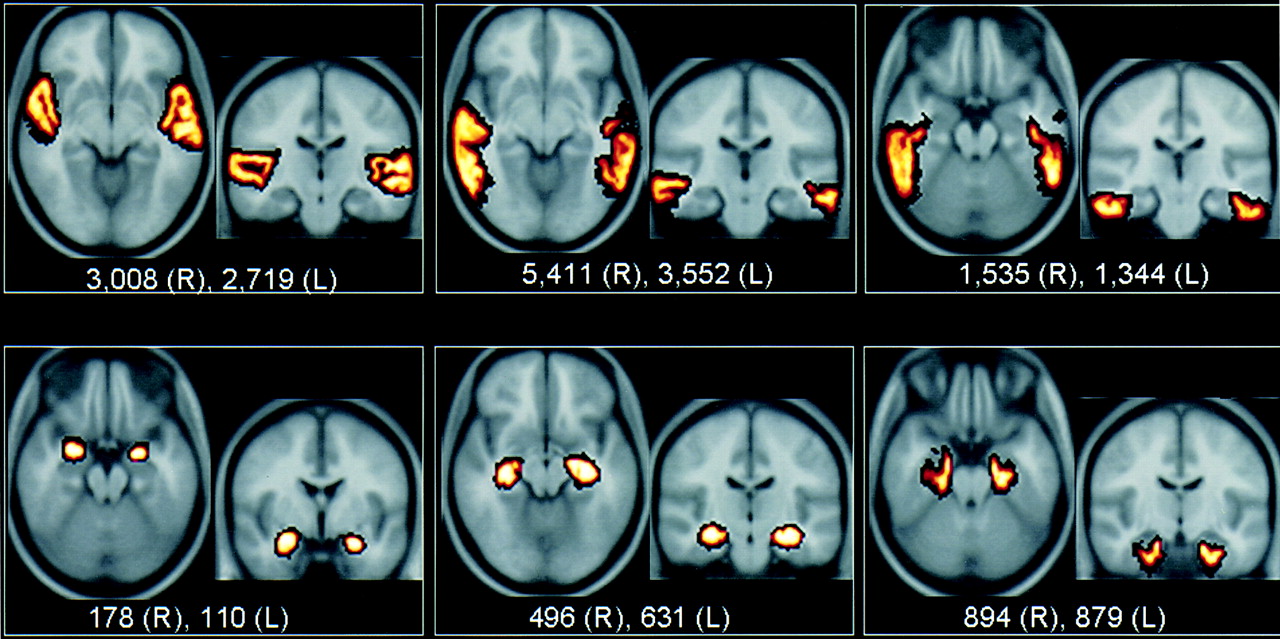
The severity and extent of the hypometabolism in the temporal lobe were assessed in 6 VOI pairs of the temporal lobe. The medial temporal structure included the hippocampus, the amygdala, and the parahippocampal gyrus. The lateral temporal structure included the superior, middle, and inferior temporal lobes (Fig. 1). When the cluster sizes were larger than 100 contiguous voxels in the lateral temporal structures or 50 contiguous voxels in the medial temporal structures, these structures were considered to have significant hypometabolism. The extent of the hypometabolism was defined as the number of voxels showing significant hypometabolism in each VOI and the medial or lateral temporal structures. From the probability-weighted counts of each VOI in both temporal areas, an asymmetry index (ASI) was calculated using the equation (C − I)/(C + I) × 200%, where C and I are mean counts of the contralateral and the ipsilateral VOIs to the resected temporal lobes, respectively. ASIs in each VOI and medial or lateral temporal structures were used as indices of severity.

Six pairs of VOI representing medial and lateral temporal structures. (Top) From left to right, VOIs for superior temporal gyrus, middle temporal gyrus, and inferior temporal gyrus are representative of lateral temporal cortical structure. (Bottom) From left to right, VOIs for amygdala, hippocampus, and parahippocampal gyrus were used as medial temporal structure. Size of each VOI is shown as several voxels. These ranged from 1,344 to 5,411 voxels for lateral structures and from 110 to 894 voxels for medial structures.
Evaluation of Diagnostic Performance and Statistical Analysis
The sensitivity for localization of the seizure focus was defined as the detection rate of significant hypometabolism on the ipsilateral temporal lobe. The specificity was defined as the nondetection rate of significant hypometabolism on the contralateral temporal lobe. When hemispheric asymmetry was considered further to the hypometabolism, this specificity was equal to the number calculated as 100% minus the false localization rate to the contralateral temporal lobe.
RESULTS
Diagnostic Performance of 18F-FDG PET
When each patient’s scan was compared with the healthy control group using SPM analysis, significant hypometabolism was detected in 76% (86/113) of the total TLE patients in the ipsilateral temporal structure at P < 0.001. Twenty-seven patients were normal on both temporal lobes (n = 24) or falsely lateralized (n = 3). There was no difference in the sensitivity between the medial (76%) and lateral (77%) TLE groups (Table 2; Fig. 2). Significant hypometabolism was found on the contralateral temporal lobes in 25 of the medial TLE cases (specificity, 68%) and 12 of the lateral TLE cases (specificity, 66%). Metabolism was decreased bilaterally in 34 of these 37 patients. In 3 other patients showing contralateral temporal hypometabolism, the hypometabolism was limited to the contralateral temporal structure only (false lateralization).

Sensitivity and specificity of SPM analysis of 18F-FDG PET for localization of seizure focus in TLE. Solid bars show sensitivity and specificity using simple comparison test. Each value was calculated at uncorrected P value < 0.001. After considering interhemispheric temporal asymmetry, sensitivity and specificity were increased.
Comparison of Hypometabolic Patterns in Temporal Lobe Between Medial TLE and Lateral TLE
Interhemispheric asymmetry analysis was performed in 61 cases, which showed no significant hypometabolism on ipsilateral temporal region (n = 27) or bilateral temporal hypometabolism (n = 34) in initial simple comparison analysis. Using the interhemispheric asymmetry analysis, more severe hypometabolism correctly indicated an additional 15 patients among those 27 patients showing no significant hypometabolism on the ipsilateral temporal area and correctly lateralized a further 27 patients among 34 patients showing bilateral temporal hypometabolism. After interhemispheric asymmetry analysis, the sensitivity increased to 89% and the specificity increased to 91% (Fig. 2). The hypometabolism outside temporal lobes was also found in SPM analysis. The frontal hypometabolism was most commonly found (12 medial TLE, 7 lateral TLE patients) followed by parietal hypometabolism (1 medial TLE, 3 lateral TLE), occipitotemporal region (3 medial TLE, 1 lateral TLE), and thalamus (2 medial TLE).
Comparison Between Medial TLE and Lateral TLE
In both medial TLE and lateral TLE, the ASIs of the medial and the lateral temporal structures were significantly higher than those of the healthy control subjects. In both groups of TLE, the ASIs of the lateral cortical structures were significantly higher than those of the medial temporal structures (lateral structure vs. medial structure, P = 0.02 for lateral TLE, P = 0.04 for medial TLE; Table 2).
In the group SPM analysis, in medial TLE compared with lateral TLE, metabolism was further decreased in ipsilateral medial temporal structures and the anterior part of the superior temporal gyrus (Fig. 3). In lateral TLE compared with medial TLE, no area of further decrease was found.

Group analysis between lateral TLE (n = 35) and medial TLE (n = 78). Regions identified by SPM were superimposed on average T1-weighted MRI template. Compared with medial TLE group, lateral TLE group showed relatively preserved metabolism at ipsilateral medial temporal structure and anterior part of superior temporal gyrus. Maximum Z value of this cluster was 4.45 and cluster (k= 2,113) was significant at P = 0.002 (corrected).
SPAM VOI analysis revealed that the hypometabolism on medial temporal structures was less extensive (P = 0.03) and less severe (P < 0.001) in the lateral TLE patients than in the medial TLE patients (Table 2). The ASIs of individual medial temporal structures were also higher in the medial TLE (P < 0.001 for hippocampus; P = 0.03 for amygdala; P = 0.01 for parahippocampal gyrus). The ASI of the superior temporal gyrus was higher in the medial TLE group (P = 0.002), but other lateral temporal structures and, thus, the total lateral temporal structure were not (Table 2).
In 63% of lateral TLE patients, significant hypometabolism was confined to the lateral temporal structure. Significant hypometabolism was confined to the medial temporal structure in only 36% of medial TLE patients. Both lateral and medial temporal structures were involved in the other 64% of medial TLE patients.
DISCUSSION
This study showed that the SPM method using hemispheric asymmetry analysis with probabilistic VOI methods (SPAM) was helpful for evaluating the regional cerebral glucose metabolism in TLE and for the discrimination of medial TLE from lateral TLE. The sensitivity of SPM analysis of 18F-FDG PET was high for the localization of the epileptogenic zones regardless of whether the TLE was medial or lateral. SPM-analyzed 18F-FDG PET was helpful, especially when we used hemispheric asymmetry analysis on SPM, in the diagnosis of medial TLE with normal, ambiguous, or bilateral abnormalities on MRI. It helped clearly diagnose the lateral TLE patients without any structural lesions on MRI.
Evaluation of the regional metabolism has been difficult on 18F-FDG PET because of the intersubject shape variation, but SPM made it easier by overcoming this variation. However, when the patients’ images were simply compared with the healthy control subjects using the SPM analysis, the sensitivity for localizing the seizure focus was not different from that of the visual assessment (12,24). The specificity was even lower because significant hypometabolism was also detected in the contralateral temporal area. When the interhemispheric asymmetry analysis was performed, the epileptogenic zones were correctly localized in 69% of the patients showing no significant or bilateral temporal hypometabolism of simple comparison. The use of the interhemispheric asymmetry analysis also reduced the false-positive findings and correctly identified true-positive findings. This result corresponded with the result reported by Van Bogaert et al. (23). This improved performance was mainly because regional cerebral glucose metabolism decreased bilaterally in the medial and lateral temporal structures in patients with medial TLE compared with the healthy control subjects (25,26). Temporal hypometabolism was bilateral on SPM-analyzed 18F-FDG PET in about 30% of medial and lateral TLE patients. In these cases, the interhemispheric asymmetry analysis was needed to make a diagnosis using 18F-FDG PET and SPM. By adopting the probabilistic VOI (SPAM) methods and 18F-FDG PET with SPM, we were able to more objectively acquire information about the area where the metabolism changed in both types of TLE. The SPAM produced the probability-weighted normalized counts in the VOIs. Because the method is fully automated, and thus gave objective data, the determination of the extent and degree of the hypometabolism in specific regions became easier. Using this method in our study, we suggest that if SPM and SPAM analysis are applied, 18F-FDG PET could be used to differentiate between medial and lateral TLE. A considerably larger percentage of confinement of the hypometabolism to the lateral cortical structure was found in lateral TLE.
Surgical outcome of the patients with medial and lateral TLE could be different according to the correctness of diagnosis or surgical procedures. Medically intractable epilepsy improved after surgery in 70%–80% of the patients with medial TLE. In cases of neocortical epilepsy, including lateral TLE, the surgical success rate has been reported to be 44%–80%. Even though it is still lower than medial TLE, the success rate is now increasing, even in nonlesional neocortical epilepsy (27–30). However, among neocortical epilepsy cases, the surgical outcome of the lateral TLE patients was better than that of other neocortical epilepsies. Among the patients who underwent surgical resection at our institute during the study period, almost 90% had a good surgical outcome regardless of medial or lateral TLE. Standard anterior temporal resection was most frequently performed. However, comparative surgical results are expected with limited resection, such as an amygdalo-hippocampectomy in cases of medial TLE, or a tailored temporal lobectomy in cases of lateral TLE (1–3,31,32). In this sense, the discrimination will help change the extent of surgical resection.
When there were structural lesions on MRI, such as hippocampal sclerosis, it might be relatively easier to make a diagnosis. Even in patients with chronic intractable TLE and normal MRI findings, the hypometabolism was detected in approximately 60%–70% (29,33,34). In this study, structural lesions were found in 69% of the lateral TLE patients, but only 60% was found to indicate epileptic zones. When the structural lesion was found on MRI, the hypometabolism was most profound in the lesion and nearby cortex. In lateral TLE, similar to medial TLE, the hypometabolism was more extensive than the structural lesions.
This study showed that the hypometabolism in the epileptogenic temporal lobe in the lateral TLE group was less extensive and less severe than that in the medial TLE group. A similar finding was observed by Hajek et al. (15), who demonstrated that the patients with medial TLE-associated mesial gliosis showed the most profound hypometabolism in the entire temporal structure among the several type of TLE.
Why do medial TLE and lateral TLE reveal a different extent or severity of hypometabolism on 18F-FDG PET? In medial TLE, histopathologic examination of surgical specimens frequently demonstrated a significant loss of neurons (35,36). Neuronal loss in the hippocampus is considered to increase with seizure duration, and neuronal loss is also found bilaterally or associated with adjacent temporal cortical lesions. The extent of the hypometabolism is typically much larger than the abnormality on MRI or histopathology (14,15,37,38). Hypometabolism in the ipsilateral temporal neocortex appears to be associated with the degree of hippocampal neuronal cell loss, but the degree of the hypometabolism on the interictal 18F-FDG PET was not related to the amount of hippocampal gliosis or cell loss (16,17,39,40). In medial TLE, epileptogenic hippocampal neuronal loss might be a result of the prolonged seizure as well as the cause. Neocortical hypometabolism in medial TLE patients might be, in part, the result of a prolonged postictal extrahippocampal cell loss. Furthermore, associated structural or functional regional neocortical abnormality was the cause of the neocortical hypometabolism in TLE (16–18). Focal or diffuse gliosis in the anterior temporal lobe, cerebral microgeneis, and heterotopic white matter were reported in medial TLE, even up to 58%–71% (8,9). All of these pathologic changes might have contributed to the metabolic changes in the lateral temporal regions in medial TLE. Our study indicates that medial TLE has extensive metabolic changes in the lateral temporal region.
In lateral TLE, the extent of hypometabolism is expected to be confined to the structural lesion itself. When a structural lesion is found and no hippocampal abnormality is found on MRI, the diagnosis of lateral TLE is easy and is likely to be correct. When no structural lesion is found on MRI, finding the epileptogenic zone becomes difficult and PET was helpful. Hypometabolism was the only clue to the correct localization in these cases. However, the cause—especially, how the extent and severity vary in lateral TLE—is unknown. Because hypometabolism can also be extended to the adjacent areas near the epileptogenic lesions in lateral TLE, and the severe hyometabolism in the lateral temporal structure can be found in lateral TLE as well as medial TLE, exclusion of medial TLE is difficult on 18F-FDG PET. Nevertheless, we observed the considerably larger percentage of lateral TLE patients with confined hypometabolism in the lateral temporal structure compared with medial TLE. Especially, the confined hypometabolism in the lateral temporal structure was shown in the large percentage of the patients without a structural lesion on MRI. This confined hypometabolism to the lateral temporal structures can be a clue to diagnose lateral TLE.
CONCLUSION
Hypometabolism was more often confined to lateral temporal structures on 18F-FDG PET in lateral TLE, and this characteristic could help discriminate medial TLE from lateral TLE. In this study, SPM including interhemispheric asymmetry analysis of 18F-FDG PET was shown to help accurately localize the seizure focus in TLE patients and was helpful in discriminating between medial TLE and lateral TLE. We suggest that lateral TLE, rather than medial TLE, should be considered when relatively spared glucose metabolism is found in the medial temporal structures.
Footnotes
Received Oct. 21, 2002; revision accepted Mar. 5, 2003.
For correspondence or reprints contact: Dong Soo Lee, MD, PhD, Department of Nuclear Medicine, Seoul National University Hospital, 28 Youngundong Chongnogu, Seoul, Korea, 110-744.
E-mail: dsl{at}plaza.snu.ac.kr
REFERENCES
In this issue


Jump to section
Related Articles
Cited By...
- Age-Specific 18F-FDG Image Processing Pipelines and Analysis Are Essential for Individual Mapping of Seizure Foci in Pediatric Patients with Intractable Epilepsy
- The Role of Radionuclide Imaging in Epilepsy, Part 1: Sporadic Temporal and Extratemporal Lobe Epilepsy
- The Role of Radionuclide Imaging in Epilepsy, Part 1: Sporadic Temporal and Extratemporal Lobe Epilepsy
- Objective Detection of Epileptic Foci by 18F-FDG PET in Children Undergoing Epilepsy Surgery
- Predicting Seizure-Free Status for Temporal Lobe Epilepsy Patients Undergoing Surgery: Prognostic Value of Quantifying Maximal Metabolic Asymmetry Extending over a Specified Proportion of the Temporal Lobe
- 5-HT1A Receptors Are Reduced in Temporal Lobe Epilepsy After Partial-Volume Correction