


Article Figures & Data
Figures
- FIGURE 1.
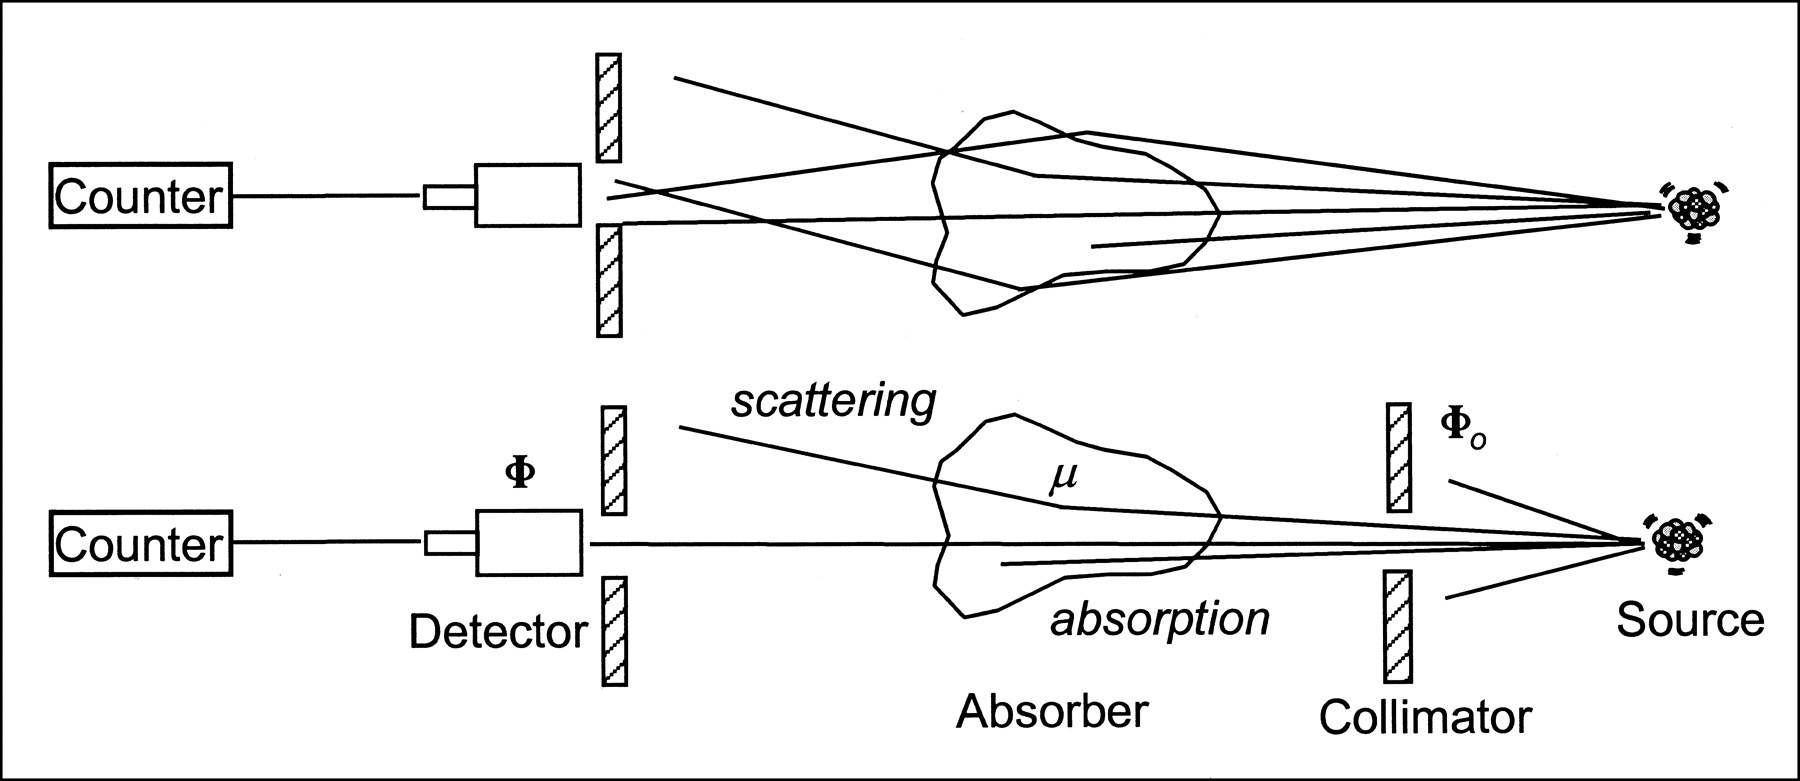
Schematic illustration of concept of broad-beam (top) and narrow-beam (bottom) attenuation for simple single detector system. In broad-beam case, source is uncollimated and this results in deviation of some photons back into acceptance angle of collimated detector. Because of acceptance of scattered events, counting rate will be higher in broad-beam case, the effect of which is to lower effective linear attenuation coefficient value. In narrow-beam case, most scattered photons will not be detected. This is due mainly to collimation of both source and detector. Difference between detected counts with and without object in place is due to both total attenuation within object and scattering out of line of sight of detector, where μ is linear attenuation coefficient (cm−1), Φ0 is incident photon fluence (photons/cm2), and Φ is transmitted photon fluence (photons/cm2).
- FIGURE 2.
(A) Narrow-beam attenuation as function of source depth in cylindric water phantom for photons of different energies of interest in nuclear medicine imaging. Lower energy photons suffer more attenuation than higher energy photons for any given source depth. (B) Same as A for 140 keV and different attenuating media. Lung tissue allows greater transmission, soft tissue allows intermediate amount of transmission, and bone allows least transmission for equal tissue thicknesses. Source depth is not useful parameter in coincidence imaging. Therefore, curves shown reflect singles detection.
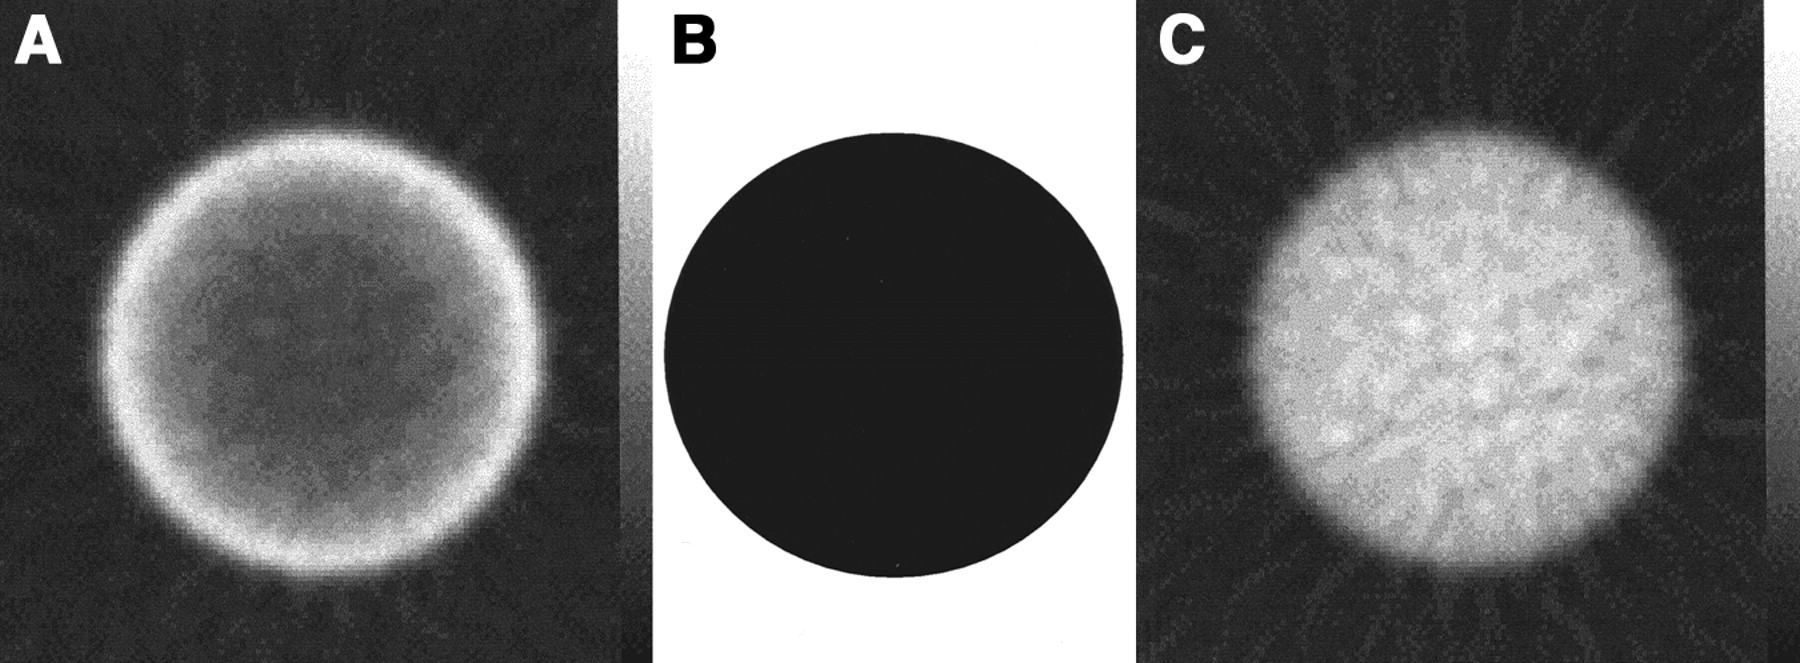
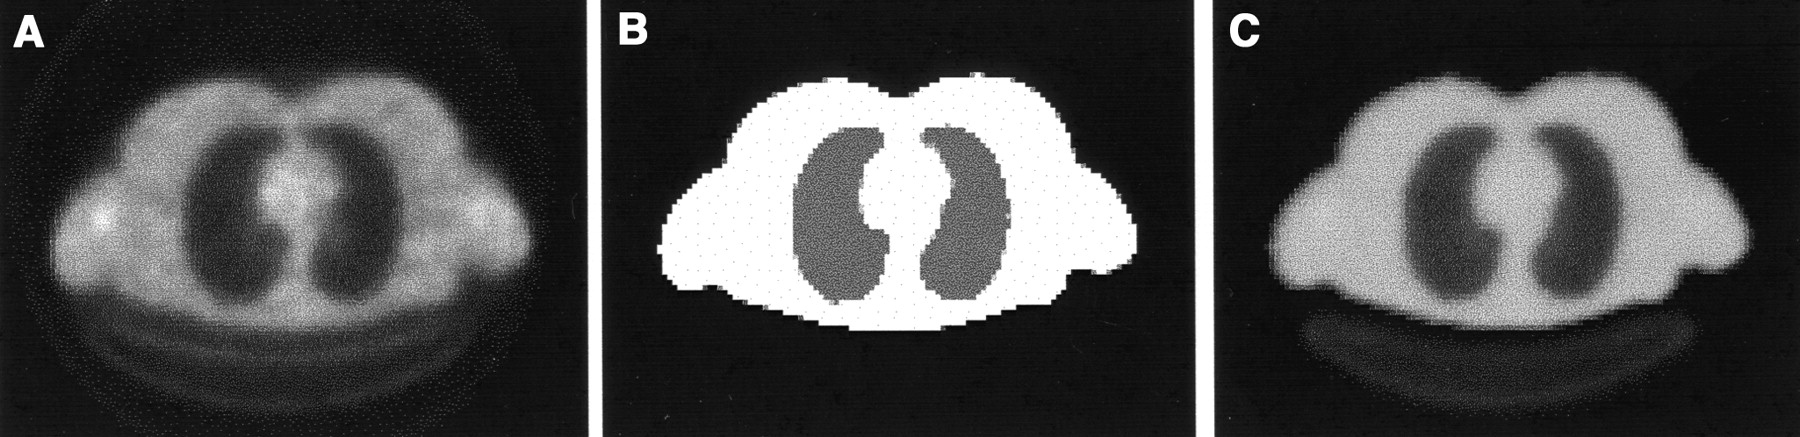
- FIGURE 3.
Illustration of reconstruction artifacts resulting from lack of attenuation correction for uniform distribution of activity in cylindric phantom. (A) Reconstructed image without attenuation correction. (B) Uniform attenuation map. (C) Same slice as in A after applying attenuation correction. Note loss of activity at center of cylinder on noncorrected image (A) and recovery of uniform activity distribution after attenuation correction (C).
- FIGURE 4.
Acquisition geometry illustrates attenuated radon transform showing original 2D attenuation map μ(x,y) and activity distribution f(x,y), and 1D projection data p(s,φ), reflecting photon attenuation and activity distribution in patient, and projection data recorded in 1 view of imaging detector, respectively. P denotes projection operator.
- FIGURE 5.
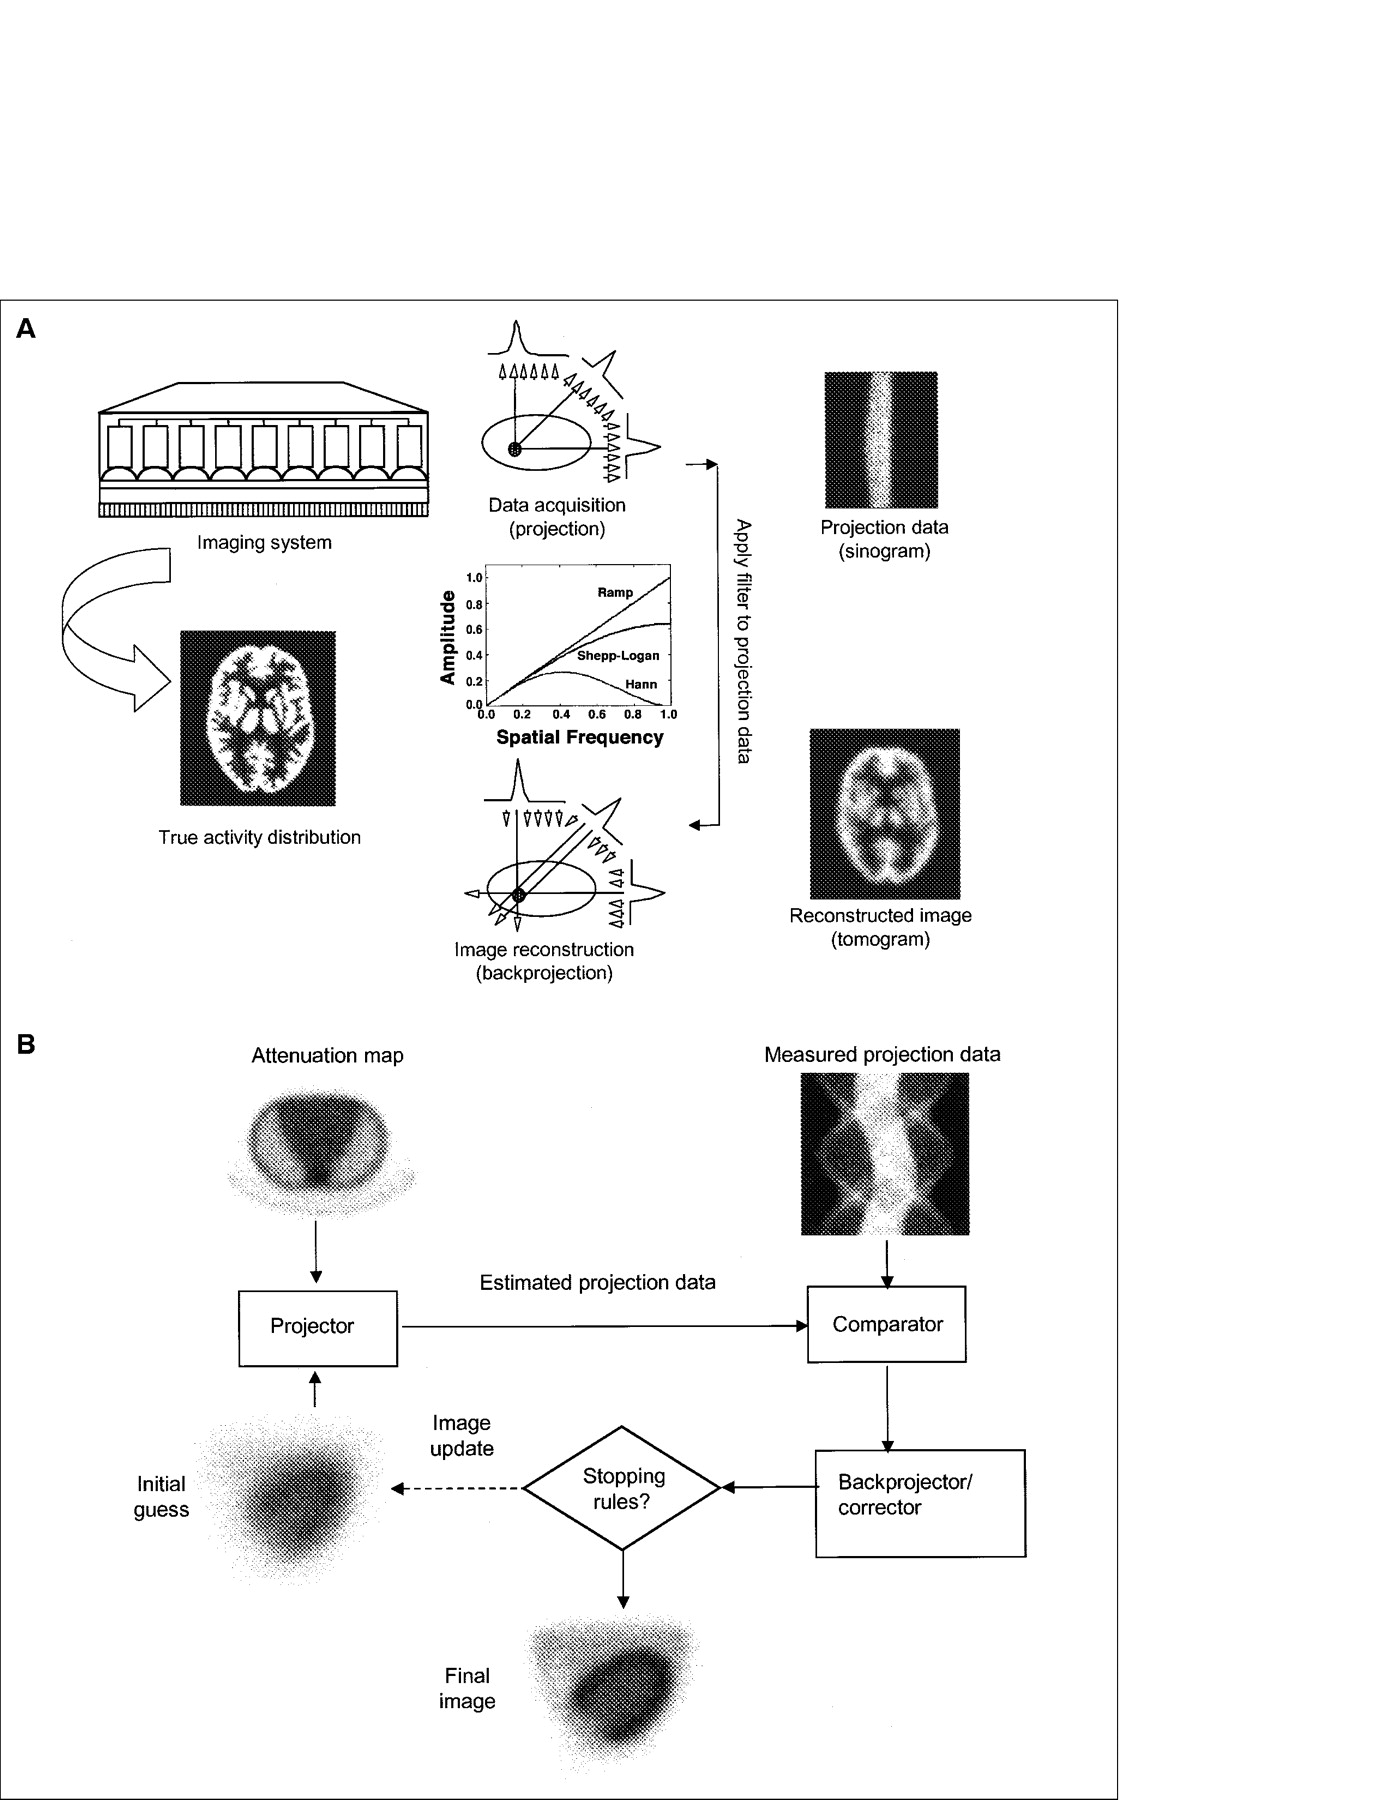
(A) Principle of FBP reconstruction algorithm. Activity distribution is recovered from measured projection data in 2 steps: filtering—projections are filtered by ramp filter; then—backprojection—contribution to image volume of each of filtered projections is computed. (B) Iterative approach is based on process of matching measured projections to calculated projections. Calculated projections are determined from initial reconstruction and are compared with measured data. Difference between 2 datasets is used to correct calculated projections. Procedure is repeated until some predefined error level has been reached.
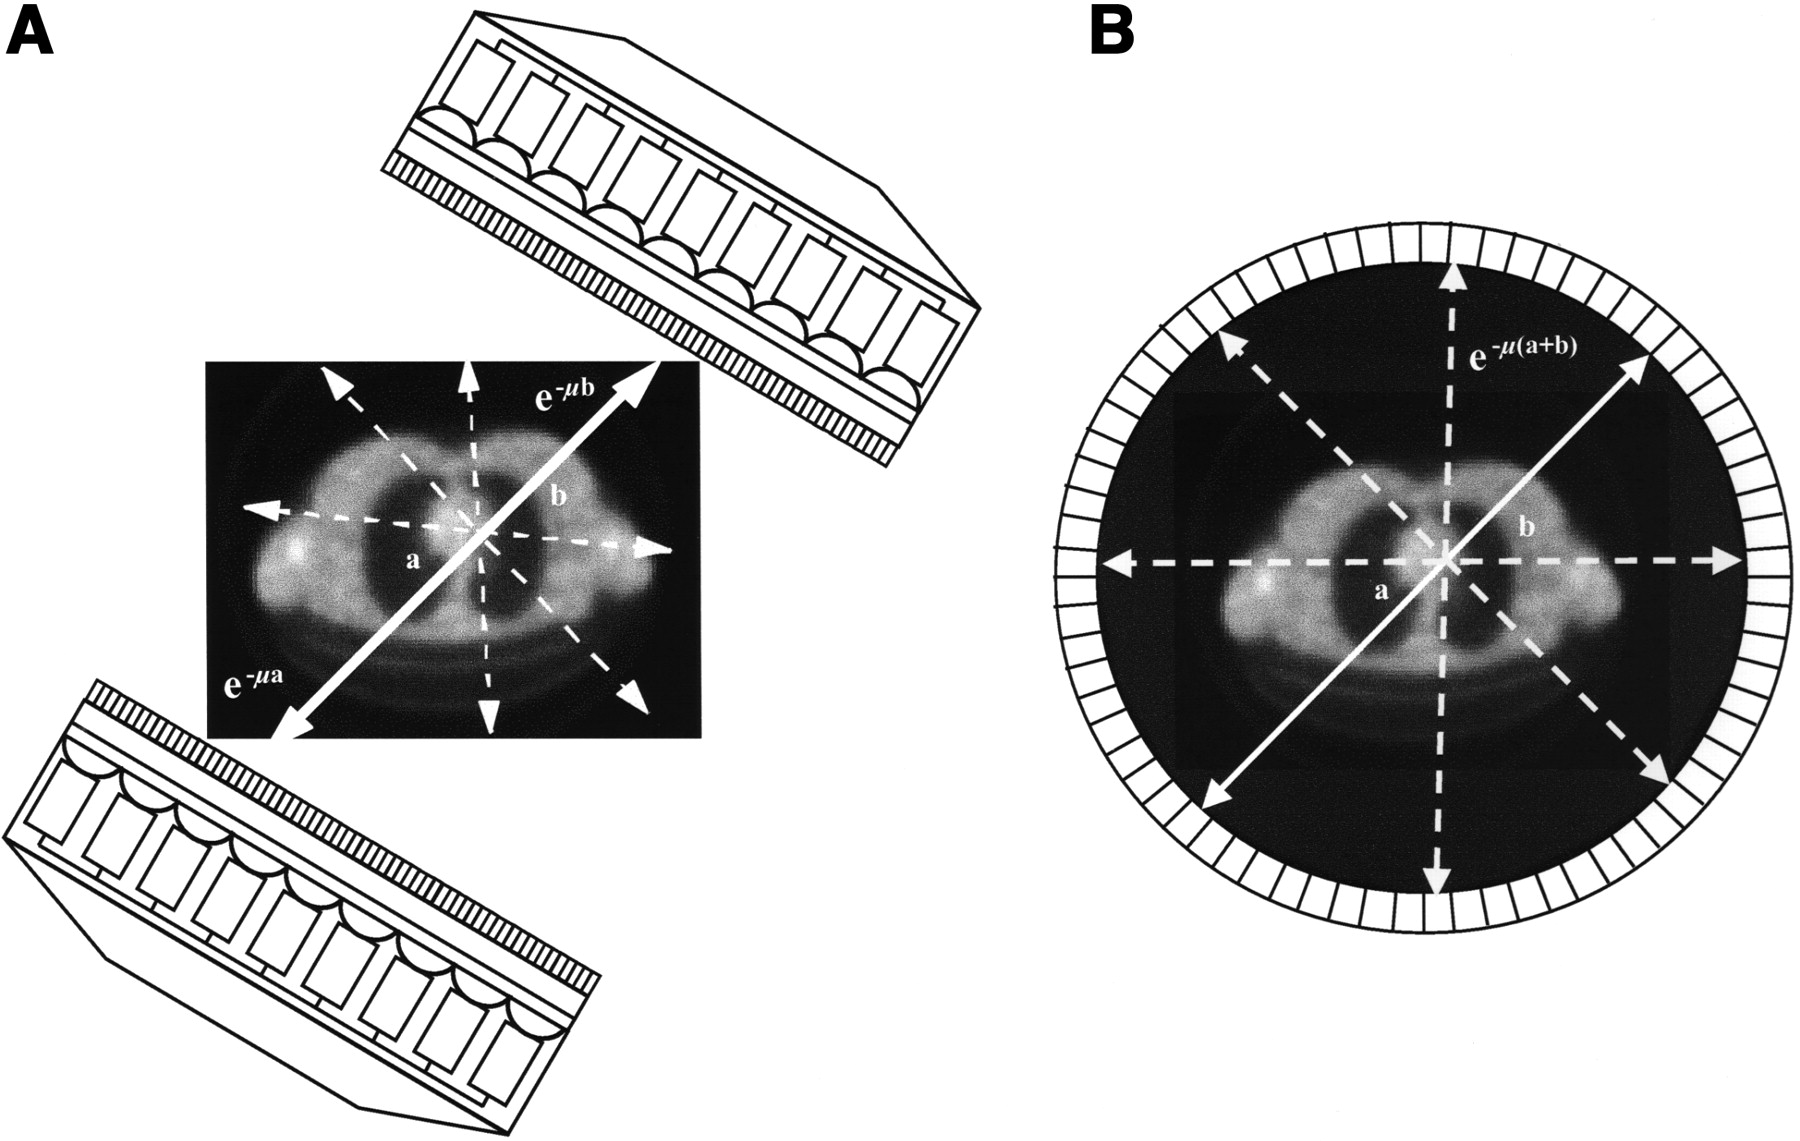
- FIGURE 6.
Illustration of main differences between attenuation correction schemes for SPECT and PET on transmission image in thorax region of patient. (A) In SPECT, most widely used algorithm on commercial systems calculates attenuation factor e−μa(e(−∫0aμ(x)dx) for nonuniform attenuating media) for all projection angles and assigns average attenuation factor to each point within object along all rays. Procedure can be repeated iteratively and adapted to nonuniform attenuating media. (B) In PET, attenuation correction factors are independent of location of emission point on LOR and are therefore given directly by factor e−μ(a+b)(e(−∫0a+bμ(x)dx) for nonuniform attenuating media) for each projection.
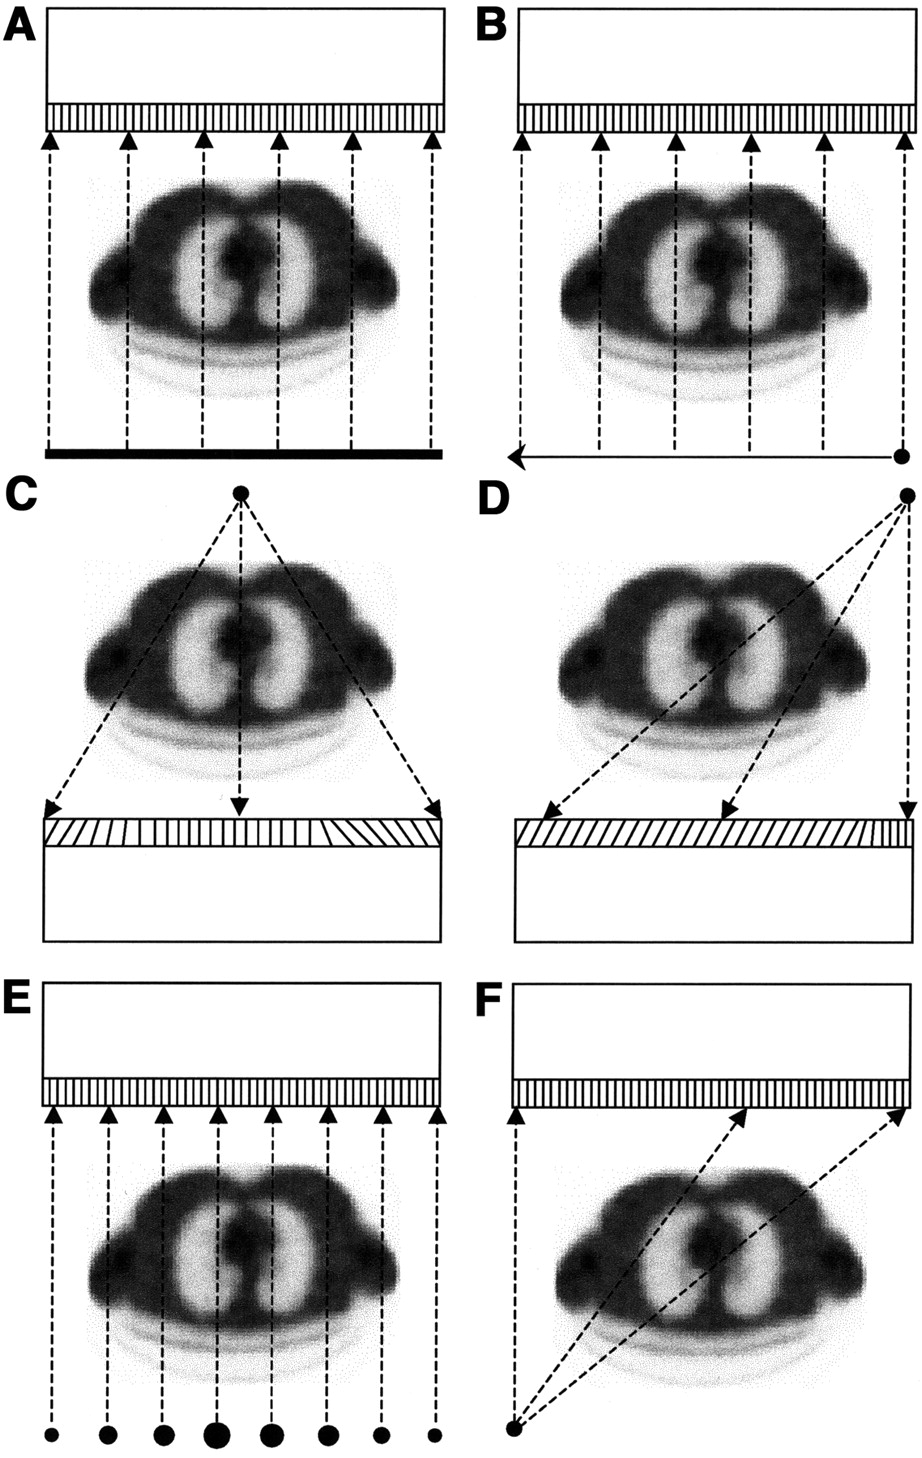
- FIGURE 7.
Different configurations of transmission scanning geometries for SPECT. (A) Sheet source. (B) Scanning line source. (C) Fixed line source and converging collimation. (D) Point or line source and asymmetric fanbeam collimation. (E) Multiple line sources where source size is proportional to relative activity of source. (F) Point source and septal penetration of parallel collimation.
- FIGURE 8.
Different configurations of transmission scanning geometries for hybrid SPECT/PET cameras. (A) Symmetric point source and fanbeam geometry that truncate imaged object. (B) Offset point source covering entire field of view where flux of radiation includes center of rotation for sampling to be complete. (C) Two scanning point sources translating axially and located far enough to side so that flux of radiation does not include center of rotation. Truncation is avoided by lateral movement of bed and 360° rotation. (D) Multiple point sources inserted between existing septa and placed along line parallel to axis of rotation near edge of 1 camera. Septa provide axial collimation for sources so that transmission system operates in 2D offset fanbeam geometry.
- FIGURE 9.
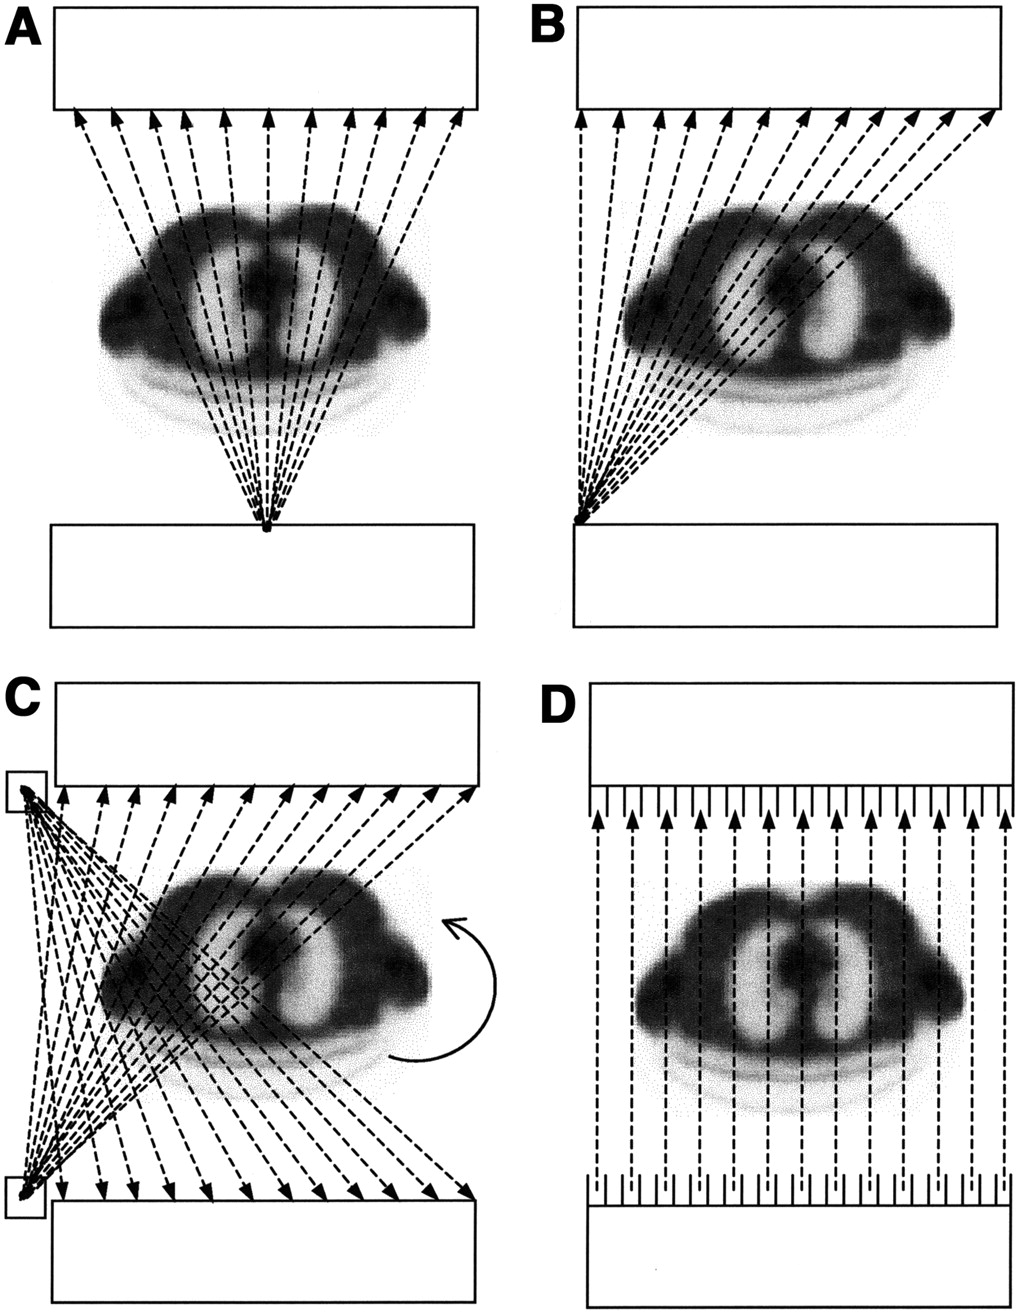
Different configurations of transmission scanning geometries for PET. (A) Ring sources of positron-emitting radionuclide measuring transmission in coincidence mode. (B) Rotating positron-emitting rods measuring transmission in coincidence mode. (C) Single-photon source producing coincidence events between known source position and photons detected on opposing side of detector ring. (D) Fixed positron-emitting rod (left) or single-photon (right) sources on rotating, partial-ring scanner.
- FIGURE 10.
Illustration of fuzzy clustering segmentation algorithm on clinical whole-body study at thorax level. (A) Reconstructed image from low-statistics transmission scanning. (B) Corresponding segmented transmission image into 3 clusters to extract specific areas of differing attenuation such as air, lungs, and soft tissue. (C) Final attenuation map obtained by assigning known attenuation coefficients and weighted averaging and adding-up high-quality transmission image of scanner bed obtained from high-statistics scan. (Reprinted with permission of (88).)
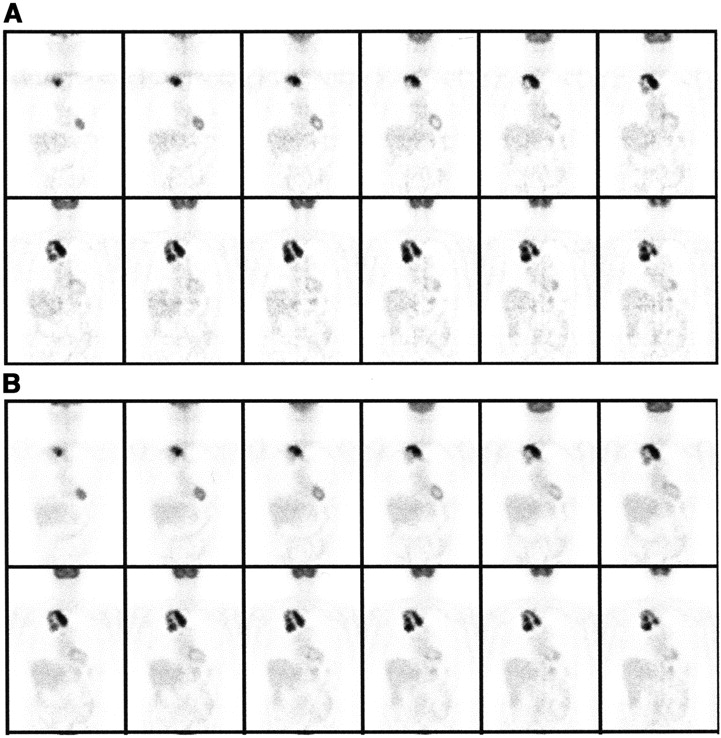
- FIGURE 11.
Illustration of improvement in image quality using segmented attenuation correction. (A) Reconstructions using measured attenuation correction. (B) Reconstructions using fuzzy clustering-based segmented attenuation correction. Note that images reconstructed with segmented attenuation correction are less noisy and show more uniform uptake of tracer. (Reprinted with permission of (88).)
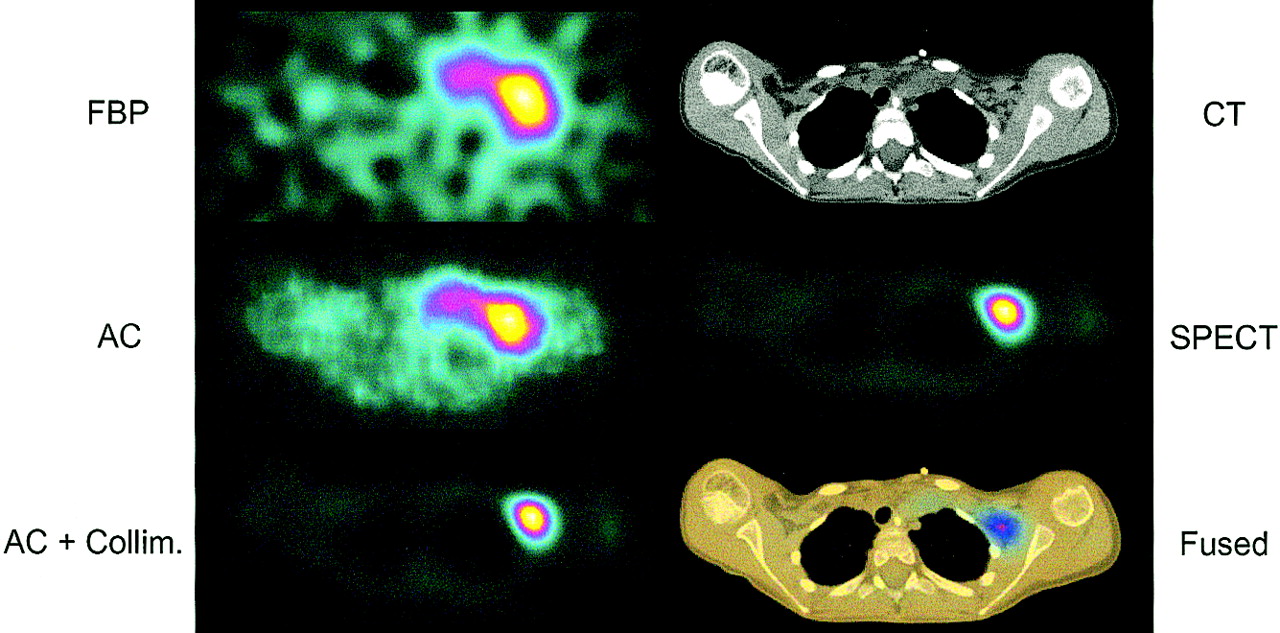
- FIGURE 12.
SPECT image of patient with neuroblastoma using 131I-metaiodobenzylguanidine (131I-MIBG). (Left) Images reconstructed with FBP and with iterative ML-EM reconstruction including attenuation correction (AC) and both attenuation correction and correction for collimator response (AC + Collim.). (Right) Correlated CT scan in same anatomic region (CT), functional image (SPECT), and fused images show radionuclide image superimposed in color on correlated CT scan (Fused). (Reprinted with permission of (130).)
- FIGURE 13.
FBP reconstructions without attenuation correction of clinical 3D brain PET images presented in different planes. Noncorrected image tends to depress reconstructed activity at center of brain.
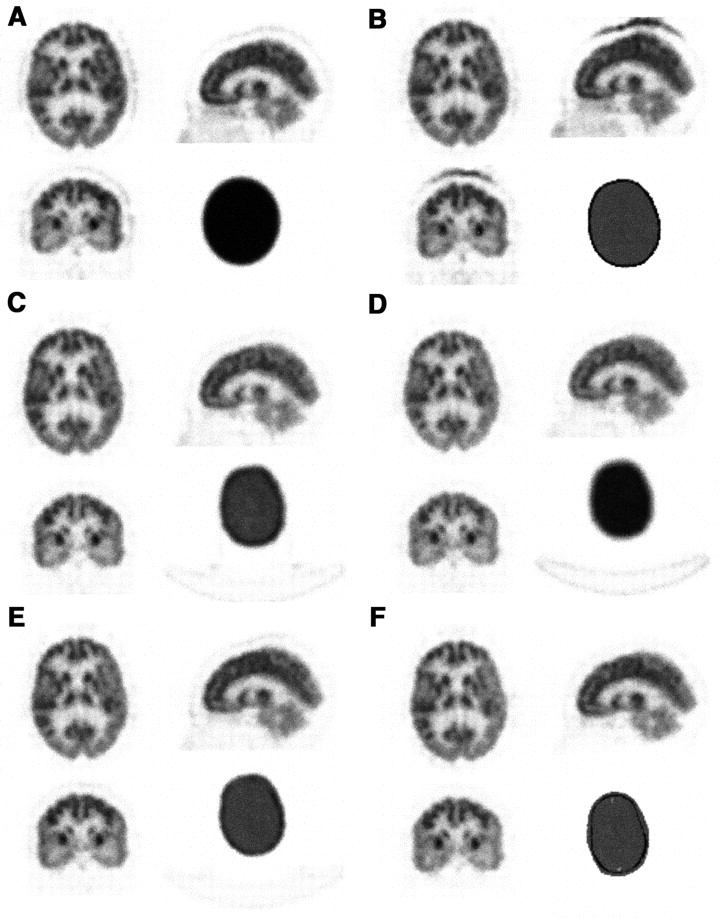
- FIGURE 14.
FBP reconstructions of clinical 3D brain PET images presented in different planes together with corresponding slice of attenuation map compare different attenuation correction techniques. (A) Calculated attenuation correction using fit-ellipse method. (B) Calculated attenuation correction using automatic contour detection algorithm (15% threshold). (C) Measured attenuation correction using 137Cs transmission scanning before injection. (D) Measured attenuation correction using segmented attenuation map. (E) Measured attenuation correction using segmented MRI. (F) IAD-based attenuation correction. Note that more exact methods based on realistic nonuniform attenuation maps produce less visible artifacts (C–F), whereas approximate methods tend to produce artifact in which there is high level of activity along edge of image due to overestimation of head contour on external slices (B).


Tables
- TABLE 1
EDE Rates and EDE Estimates for Typical Transmission Scanning Sources and Configurations
Isotope or source γ-Factor (mSv·m2/GBq·h) Source geometry Imaging modality Typical total source strength (GBq) EDE rate (μSv/GBq·h) Typical EDE/examination (μSv) Reference 99mTc 0.022 Sheet SPECT 0.1–0.3 750 75 (brain) 132 Sheet, uncollimated SPECT 0.15–0.85 71.1 — (cardiac) 77 HR collimation SPECT 0.15–0.85 0.8 — (cardiac) 77 Line SPECT 0.37–0.74 71.1 17.5 (brain) 41 57Co 0.021 Sheet SPECT 0.15–0.25 324.3 27 (cardiac) 133 153Gd 0.029 Sheet SPECT 1–2.5 133.3 111 (cardiac) 72 Line, collimated SPECT 1–22 0.5 3.8 (brain) 131 Line, collimated SPECT 1.9 13.9 (cardiac) 131 Line, uncollimated SPECT 32 234.7 (brain) 41 241Am 0.019 Line SPECT 4–8 90 240 (brain) 71 201Tl 0.018 Line SPECT 0.15–0.3 50.3 5 (brain) 41 133Ba 0.085 Point SPECT/PET 0.4–0.6 101 22.2 (whole body) 134 68Ga/68Ge 0.149 Rod PET 0.2–0.6 270 54 (brain) 131 PET 770 154 (cardiac) 131 137Cs 0.092 Point PET 1–1.3 170 74 (whole body) 135 X-ray CT — X-ray tube SPECT/PET — — 5,400 (thoracic) 136 EDE is calculated for maximal activity reported and typical 20-min scan except CT.
In this issue


Jump to section
- Article
- Abstract
- THE PROBLEM OF PHOTON ATTENUATION IN EMISSION TOMOGRAPHY
- ATTENUATION CORRECTION STRATEGIES IN EMISSION TOMOGRAPHY
- TRANSMISSIONLESS METHODS
- TRANSMISSION METHODS
- FURTHER APPLICATIONS OF ATTENUATION MAP
- Dosimetric, Logistic, and Computing Considerations
- CONCLUSION AND FUTURE PROSPECTS
- Acknowledgments
- Footnotes
- REFERENCES
- Figures & Data
- Info & Metrics
Related Articles
Cited By...
- Study of Attenuation Correction Using a Cardiac Dynamic Phantom: Synchronized Time-Phase-Gated Attenuation Correction Method
- Optimization of the Attenuation Coefficient for Chang Attenuation Correction in 123I Brain Perfusion SPECT
- Diagnostic Performance of Attenuation-Corrected Myocardial Perfusion Imaging for Coronary Artery Disease: A Systematic Review and Meta-Analysis
- Transmission Imaging in Lymphoscintigraphy with a 153Gd Flood Source
- Assessment of Clinical Impact in the Application of Chang Attenuation Correction to Lung Ventilation/Perfusion SPECT
- SPECT/CT Physical Principles and Attenuation Correction
- Respiration-Averaged CT for Attenuation Correction in Canine Cardiac PET/CT
- Recent Advances in SPECT Imaging
- Attenuation Correction of Myocardial SPECT Perfusion Images with Low-Dose CT: Evaluation of the Method by Comparison with Perfusion PET
- A Method to Remove Artifacts in Attenuation-Corrected Myocardial Perfusion SPECT Introduced by Misalignment Between Emission Scan and CT-Derived Attenuation Maps