


Abstract
Nonuniform soft-tissue attenuation affects the diagnostic accuracy of SPECT in myocardial perfusion imaging. The attenuation map required for attenuation correction can be acquired using x-ray tomography (CT). Frequent findings in attenuation-corrected images are defects in the apical and anterior myocardial wall. We assume that these are artifacts produced by misalignment of SPECT images and the attenuation map. Methods: One hundred forty patients underwent myocardial perfusion imaging with 99mTc-methoxyisobutylisonitrile. Twenty-seven of 140 showed pronounced defects in the apical or anterior wall only after CT-based attenuation correction. SPECT and corresponding CT slices were examined for misalignment in the ventrodorsal direction (y-direction) visually and by threshold-based delineation of the body surface. Mismatched studies were realigned and image reconstruction and analysis were redone. The effect of the correction was assessed visually and by semiquantitative analysis based on a 20-segment model using 4D-MSPECT. Results: In 15 of 27 patients, the improved coregistration led to smaller and less-pronounced defects in the regions mentioned. In 6 of 27 patients, former defects were judged as normal. No improvement was seen in only 4 patients. In these 4 subjects, the mismatch in the y-direction was <1 pixel (7 mm), and visual inspection suggested a coincident mismatch in the craniocaudal direction. In 2 cases, coregistration was not possible because the body outline extended beyond the CT field of view. Semiquantitative analysis revealed a significant increase of the relative uptake in the apex; in the apical segments of the anterior, septal, and inferior wall; and in the mid-anterior and mid-anteroseptal segment. Basal segments of the anterolateral, lateral, and inferolateral wall and the middle inferolateral segment showed a significant decrease of relative uptake. Conclusion: Misalignment in the y-direction between SPECT and the attenuation map can lead to artifacts in the apical, septal, and anterior wall, which will appear as defects. It also can cause overcorrection in the basal inferior and lateral segments. There is evidence that mismatches along the other directions may have a similar effect. The coregistration of SPECT and the attenuation map needs to be verified for every patient, even when using integrated dual-modality imaging devices.
Soft-tissue attenuation influences the diagnostic accuracy of SPECT in myocardial perfusion imaging (1). Attenuation correction (AC) has been shown to enlarge the percentage of normal SPECT scans in clinical trials (2). If AC is used, transmission scanning of the individual subject is reported to be mandatory for areas of inhomogeneous attenuation, such as the chest (3). Several methods for acquiring the attenuation map have been proposed, mostly based on radionuclide transmission scanning. Different configurations of transmission scanning geometries for SPECT exist to date, each having its unique advantages and drawbacks (4–8). A common problem of radionuclide-based systems is the low activity of the radioactive sources leading either to long acquisition times or to attenuation maps with low counting rates, causing poor quality. If the energy of the transmission photons is lower than that of the emission nuclide, there is also contamination of the attenuation map (cross talk).
As phantom studies have shown, systems that generate high-quality attenuation maps yield the best results (9). Therefore, AC using x-ray tomography (CT) seems to be most promising. Compared with classic camera-based transmission systems, CT shows a higher photon flux. According to Bocher et al. (10), the Hawkeye system (General Electric Medical Systems) yields a photon flux of about 0.5 × 10⁶ s−1 cm−2, whereas the flux of a high-counting-rate emission scan is at least 5 × 10⁴ times lower. The Millennium VG3 γ-camera with the Hawkeye facility (General Electric Medical Systems) is a dual-modality imaging system with an integrated patient table that allows both the x-ray and the radionuclide images to be acquired without removing the patient from the system. Therefore, patient movement is minimized, which should yield an optimal coregistration of emission and transmission scans.
We introduced x-ray–derived AC for myocardial perfusion imaging as a routine procedure to increase the specificity of results. Besides a marked reduction of attenuation artifacts in the inferior and inferoseptal wall, we often found new defects in the apical, anterior, and septal wall compared with uncorrected images. Visual inspection suggested a misalignment between the emission scan and CT in the ventrodorsal direction (y-direction).
We presume that this misalignment might be the reason for the artifacts in attenuation-corrected images (11). A correction of this misalignment should therefore reduce the observed artifacts.
MATERIALS AND METHODS
Phantom Study
For the phantom study we used an IEC body phantom (PTW). This phantom consists of body-shaped acrylic vessels, simulating lung and thoracic wall. The simulated myocardium of a Data Spectrum Cardiac Insert (Data Spectrum Corp.) was homogeneously filled with 21 MBq 99mTc (190 kBq/mL) and positioned in the body phantom. The vessel representing the thoracic wall was filled with 13 MBq 99mTc (3.3 kBq/mL); the vessel representing the lung contained air. The acquisition parameters were the same as in the patient studies.
To simulate misalignment of CT and SPECT images, the CT slices were shifted along the y-direction from ventral to dorsal (“down”) in increments of 0.25 pixel with the same software as that used for correcting the misalignment. Semiquantitative analysis was done using 4D-MSPECT (University of Michigan Medical Center).
Study Population
We retrospectively analyzed 140 recent stress studies done with 99mTc-methoxyisobutylisonitrile (99mTc-MIBI) (Cardiolite; Bristol-Myers Squibb Pharma). Patients were included if they were normal according to the non–attenuation-corrected SPECT images (experienced observer does not note any defects; summed stress score [SSS] < 3) but exhibited a clinically relevant defect in the apical, septal, or anterior wall in the attenuation-corrected images. This was the case for 27 patients whose data are given in Table 1. Nineteen of 27 patients had been examined because of suspected cardiovascular disease. In 3 patients, SPECT had been performed to estimate the relevance of known coronary arteries stenosis; 5 patients had been follow-ups after percutaneous or surgical revascularization. For the non–attenuation-corrected studies (IRNC) of these 27 patients, the average SSS was 0.30 ± 0.66, which implies all of them being classified as normal (12).
Patient Characteristics
SPECT
Data Acquisition and Reconstruction.
Phantom and patient studies were acquired using a Millennium VG3 γ-camera with the Hawkeye facility. In patients, the acquisition was started about 2 h after application of 250–350 MBq 99mTc-MIBI under stress conditions. Stress conditions were either bicycle ergometry (48%) or pharmacologic stress (52%). Patients were placed in the supine position with arms up because arms placed at the sides of the body frequently extend beyond the transaxial field of view of the CT scan and have been observed to reduce the image quality (13). Randomly, either emission or transmission scanning was done first. The detector heads were positioned opposing each other (H-mode) and were equipped with low-energy, high-resolution collimators (VP 45). Automatic body contouring was used to obtain the optimum detector-to-patient distance. Emission data were acquired with a 20% energy window centered at 140 keV. Further acquisition parameters were 3° per step, 180° each head, and 25 s per projection.
CT slices were acquired only for the region of the heart—not for the whole axial field of view of the γ-camera—to reduce radiation exposure to the patients. The Hawkeye device has a fixed slice thickness of 10 mm. The following parameters are fixed as well: 140-kV voltage, 2.5-mA current, 14-s half scan. CT images are reconstructed on the VG3 system (acquisition software versions 5.1 and 6.0) with a direct fanbeam filtered backprojection. The pixel-by-pixel attenuation coefficient is calculated by scaling the CT numbers measured with a known effective x-ray energy. The attenuation map is smoothed by convolution with a 3-dimensional gaussian kernel to equate its resolution with the emission images (10).
For SPECT image reconstruction and analysis, all data were transferred to an eNTEGRA workstation (General Electric Medical Systems). Transaxial images of 64 × 64 pixels were reconstructed using 2 iterations with 10 subsets of ordered-subset expectation maximization (OSEM). Data were filtered with a Butterworth filter (critical frequency, 0.25; power, 5.0).
Image Processing.
For visual analysis, the attenuation-corrected (IRAC) and non–attenuation-corrected images (IRNC) were displayed as short-axis and as horizontal and vertical long-axis slices of the left ventricle using the eNTEGRA software.
For semiquantitative analysis, all studies were transferred to an Odyssey LX workstation (Philips Medical Systems) and further analyzed using the 4D-MSPECT software. Polar maps were created as described and normalized to 100% peak activity (14). Then the average pixel value of each segment of a 20-segment model (15) was calculated. The SSS was computed for each segment, based on the sex-specific databases (30 healthy men, 30 healthy women) supplied with 4D-MSPECT (16).
Detection and Correction of Misalignment Between CT and SPECT.
For the quantification of misalignment in the ventrodorsal direction, the non–attenuation-corrected SPECT slices and the attenuation maps were exported to Interfile format and processed with a program written in MATLAB (release 13; The MathWorks). The software uses thresholds determined from histograms of the pixel values (Fig. 1) to find the body outline in 11 central sagittal slices. For each row in each sagittal slice, the locations of the front and back contour are averaged to estimate the body position for this row (Fig. 2). The mean shift is then calculated as the mean of all paired differences between the positions derived from SPECT and CT. A roughly gaussian distribution of the paired differences without outliers indicates successful surface detection.
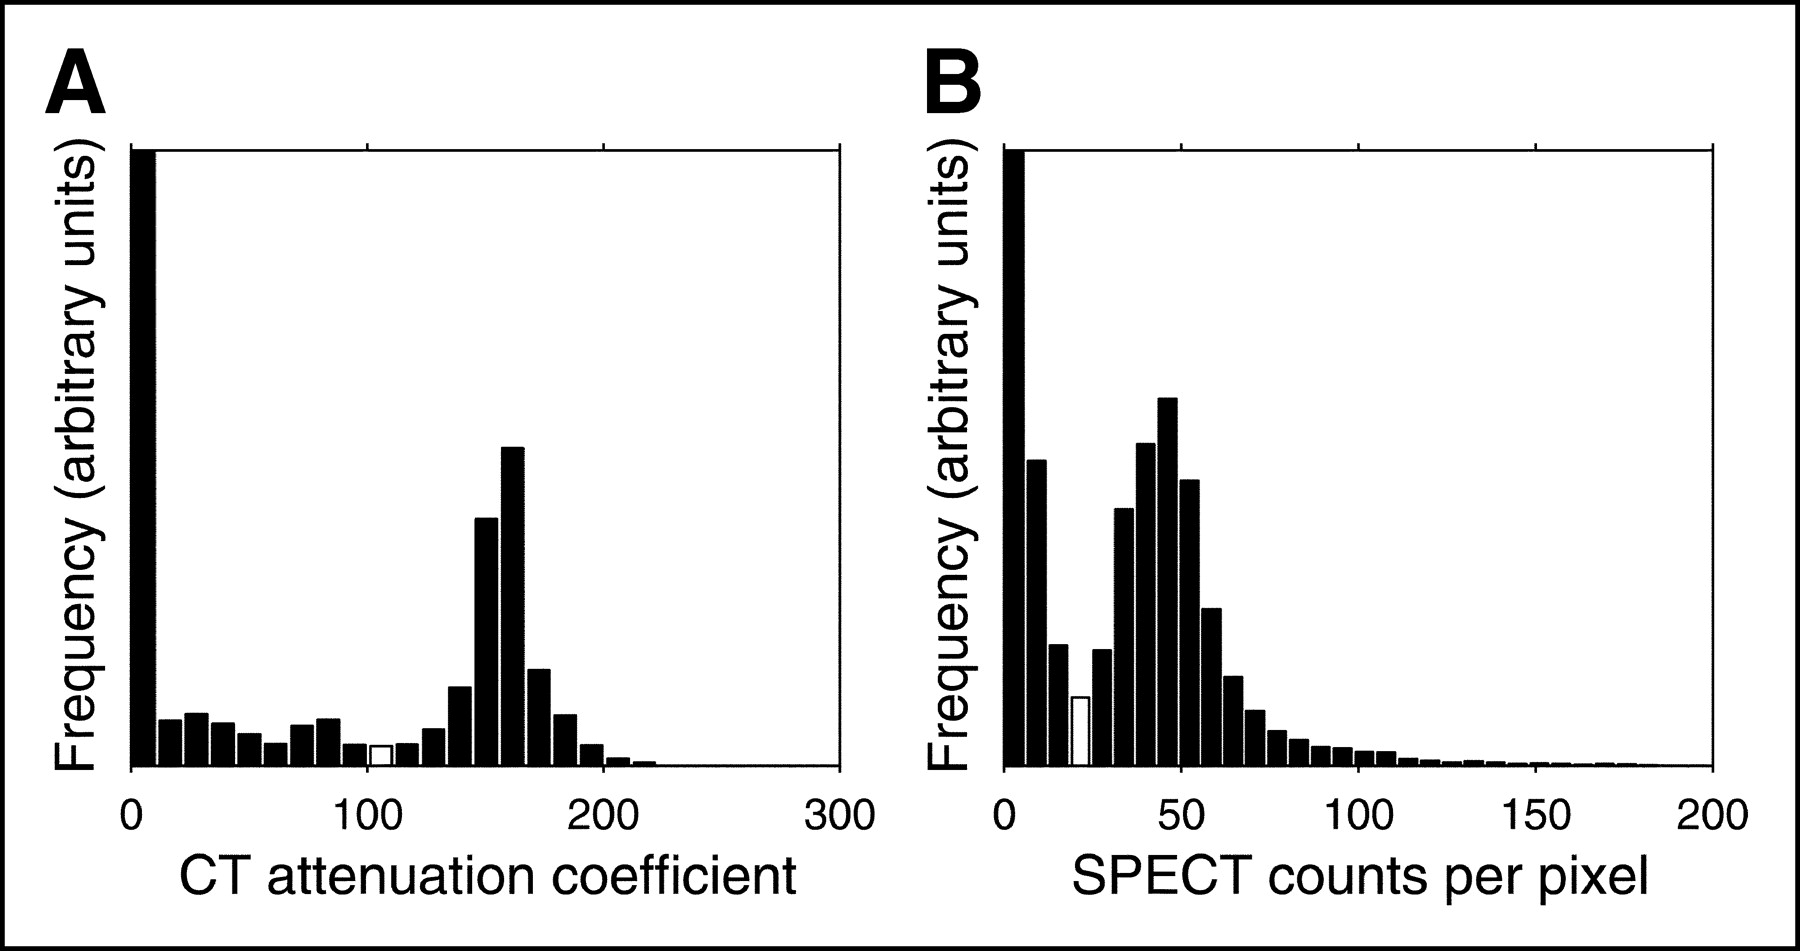
Histograms of pixel values of sagittal CT (A) and SPECT (B) slices. Thresholds determined from the histograms are marked as white columns.

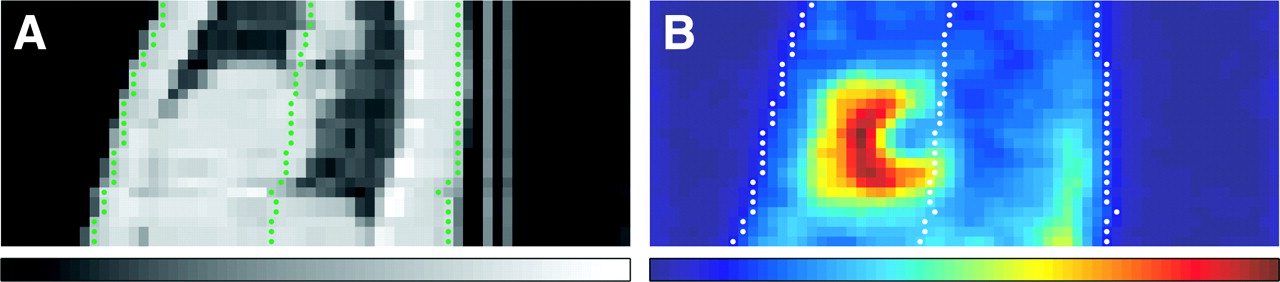
Detection of body surface in sagittal CT (A) and SPECT (B) slices. Outer contours corresponding to thresholds and estimated positions are marked as green dots (A) or white dots (B). The study shown is correctly aligned.
A program written with the Aladdin programming facility of the eNTEGRA workstation was used to apply the shift to the attenuation maps and to file the realigned data as a new study. Image reconstruction and evaluation were repeated as described (Fig. 3).

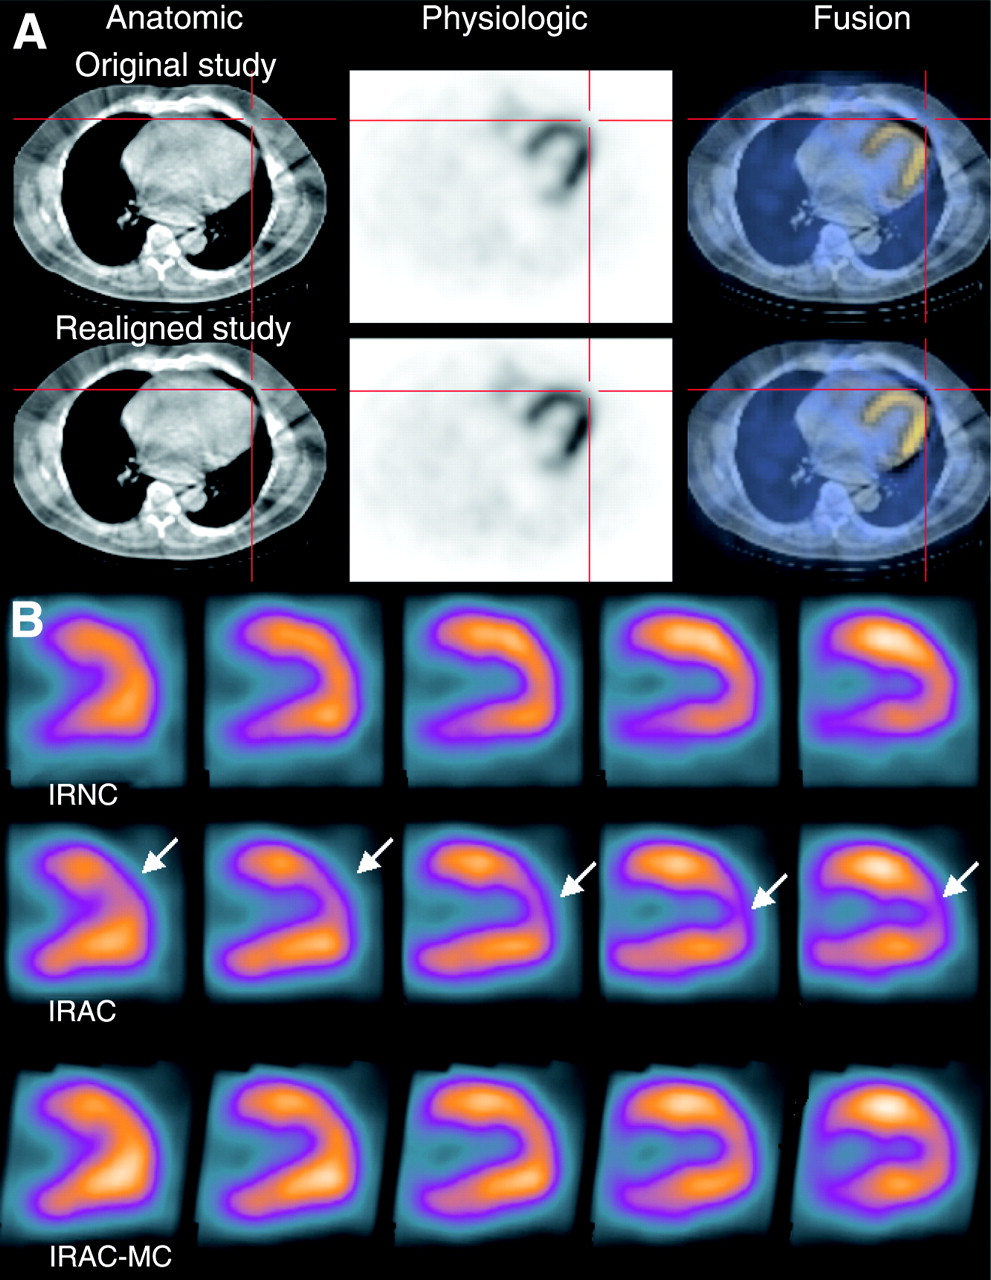
(A) Coregistration: displays from fusion tool supplied by General Electric Medical Systems. Left, CT slices; center, SPECT slices; right, fused images. Top row, misalignment in craniocaudal direction (y-direction). Bottom row, corrected study. (B) Vertical long-axis slices of reconstructed SPECT study without AC (IRNC), after AC (IRAC), and after correction for misalignment (IRAC-MC). Arrows mark defects in apical anterior wall, which are not visible in non–attenuation-corrected slices and are improved in slices corrected for misalignment.
For visual detection of mismatches in the craniocaudal direction (z-direction) and the lateral direction (x-direction), the fusion tool supplied with the eNTEGRA workstation was used. Findings were divided into 3 groups: 0, no definite misalignment; 1, minor misalignment of <1 pixel (7 mm); 2, major misalignment of >1 pixel.
Statistical Analysis
Data are reported as mean ± 1 SD. For the phantom study, only descriptive analysis was done. Patient characteristics and extent of mismatch were tested for linear regression. The Student paired t test was used to compare parameters between the IRNC and IRAC studies before and after correction for mismatch. P values < 0.05 were considered statistically significant. Statistical analysis was performed using StatView 5.0 (SAS Institute, Inc.).
RESULTS
Phantom Study
Even a mismatch as small as 0.5 pixel caused a visible defect in the anteroseptal myocardial wall (Fig. 4). In the apical, anterior, and septal walls, this defect got more intense with the degree of misalignment (Fig. 5). On the other hand, no relevant effect was seen in the lateral wall up to a mismatch of 1.75 pixels. At a misalignment of 2 pixels, all lateral segments showed a loss of the relative counting rate within the segment. In the inferior wall, there was only little change in relative uptake up to a mismatch of 1.75 pixels. Reaching a mismatch of 2 pixels, the most pronounced loss was seen in the apical inferior segment.

Phantom study: polar maps from 4D-MSPECT. Top left, homogeneously filled heart phantom with AC. Other pictures from the same study show increasing craniocaudal misalignment (simulated) between CT and SPECT (pixel size = 7 mm).

Phantom study, as in Figure 4. Ordinate, relative uptake per segment; abscissa, artificial misalignment in y-direction (1 pixel = 7 mm). In apical, anterior, and septal walls, uptake decreases with degree of misalignment; in inferior wall, declining uptake is apparent only in apical segment (×).
Patient Studies
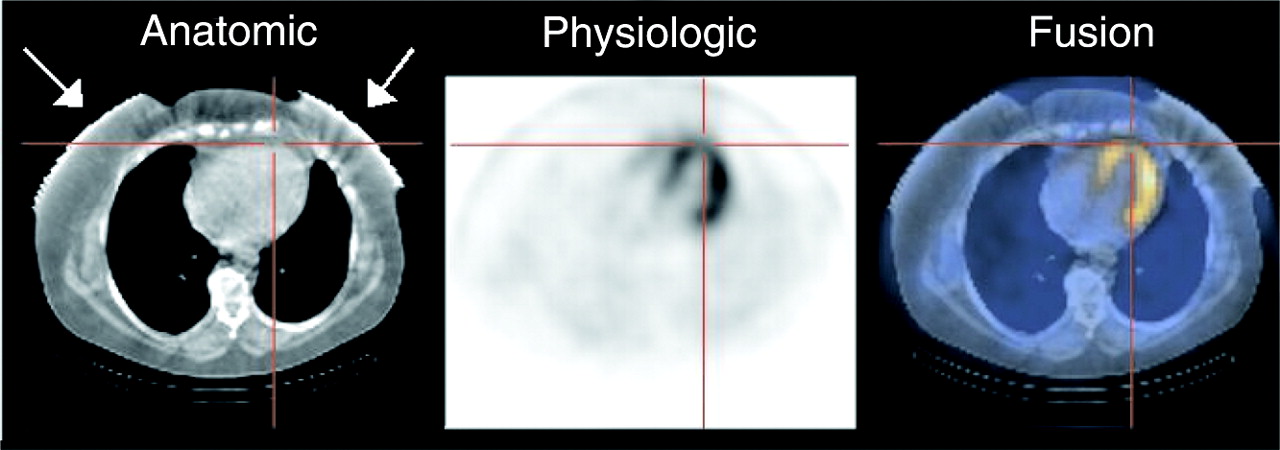
Quantification of misalignment was not possible in 2 patients because part of the body contour was outside the transaxial field of view of the CT scanner. Both patients were extremely obese, with body mass indices of 34.6 and 45.0 kg/m2. In these 2 patients, no obvious misalignment in any direction could be seen (Fig. 6).

Artifacts (arrows) caused by limited transaxial field of view of Hawkeye device. In this obese female patient, breasts are outside field of view.
For the 25 patients who could be analyzed with our software, the mean misalignment in the y-direction was 1.3 ± 0.4 pixel, the CT scan being displaced in the dorsal direction. The height or weight of the patient had no influence on the extent of the detected misalignment, nor did the body mass index. By visual interpretation, no misalignment in the lateral direction was seen. In the z-direction, there was a major misalignment in 1 patient and a minor misalignment in 7 patients.
In 15 patients, the improved coregistration in the y-direction led to smaller and less intense defects in the above regions. In another 6 patients, the defects even returned to normal uptake. No change could be seen in only 4 patients. In these 4 subjects, the mismatch in the y-direction was <1 pixel (7 mm), but a coincident mismatch in the craniocaudal direction (z-direction) was visible.
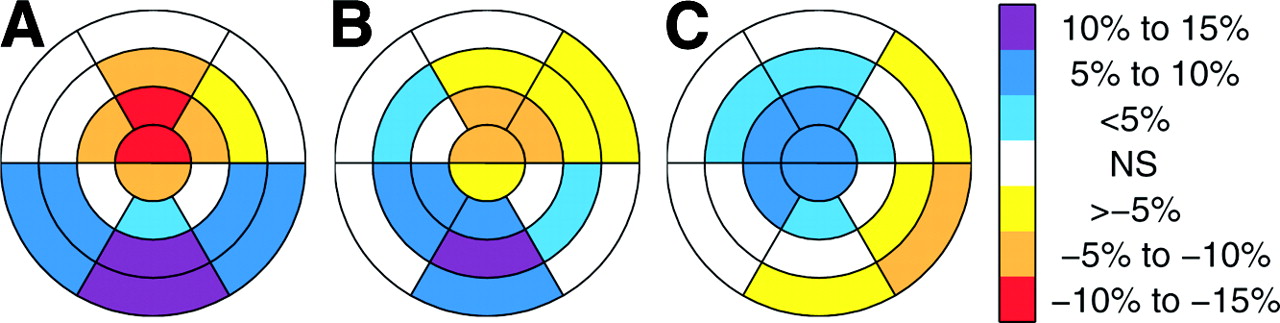
Results of the semiquantitative analysis are given in Table 2. Compared with the IRNC studies, the IRAC studies show an increase of relative uptake in the inferoseptal, inferior, and inferolateral walls. On the other hand, a decrease of relative uptake is shown in apical and mid-anterior segments (Fig. 7A). After correction for misalignment (IRAC-MC), the increase of uptake in the inferior and inferolateral walls is less intense (Fig. 7B). Coincidently, the decrease of uptake in the apex and mid-anterior wall is smaller. The effect of the misalignment correction for each segment is given in Table 3 and graphically shown in Figure 7C.

Patient studies: semiquantitative analysis of polar maps from 4D-MSPECT. (A) Mean differences between studies without (IRNC) and with AC (IRAC). (B) Mean differences between studies without (IRNC) and with AC after correction for misalignment (IRAC-MC). (C) Mean differences between attenuation-corrected studies before (IRAC) and after correction for misalignment (IRAC-MC). NS = not significant.
Attenuation-Corrected Studies With and Without Correction for Misalignment Compared With Non–Attenuation-Corrected Studies
Comparison of Attenuation-Corrected Studies With and Without Correction for Misalignment
DISCUSSION
Our hypothesis was that misalignment between SPECT and the attenuation map might be the reason for artifacts in attenuation-corrected images and that a correction of this misalignment should therefore reduce the observed artifacts. Our supposition was supported by the results of the phantom study, showing artifacts similar to those observed in patient studies raised by artificially introduced misalignment of SPECT and the attenuation map. A similar phenomenon has been demonstrated by Matsunari et al. (11), using a triple-head SPECT system and radionuclide transmission scanning. In the phantom study they performed a shift of 1 pixel (7 mm), producing up to 15% change in the regional relative activity.
According to the SSSs, all of our patients were normal. Especially, as mentioned in the inclusion criteria for the study, no patient had a defect in the apical or anterior wall in the non–attenuation-corrected SPECT study. The observed defects in those segments were therefore classified as artifacts. According to our presumption, in all cases a misalignment of SPECT and CT could be proven. In the case of the misalignment being >1 pixel (7 mm), correction led to visible changes in the reconstructed slices.
The artifacts in the apical and anterior walls in attenuation-corrected images of the myocardial perfusion may be due to underestimation of the attenuation effects of the anterior thoracic wall in the case of misalignment. On the other hand, overestimation of the attenuation effects in the inferior thoracic wall may explain the phenomenon of overcorrection in the inferior wall of the left myocardium.
Apical defects in attenuation-corrected images have been described for other systems (4,5) and different reasons have been discussed. Matsunari et al. (17) have found a hot region near the inferior wall to cause a relative reduction in count density in the anterior wall, especially with 201Tl. In our study, we can rule this effect out because acquisition was redone in patients with high extracardial uptake close to the heart.
In the 2 very obese patients, for whom the CT field of view was too small, a similar artifact in attenuation-corrected images occurred without apparent misalignment. This artifact might have the same cause: The attenuation map does not contain the whole thoracic wall of the patients, especially the breasts of female patients. Attenuation effects in the anterior direction are underestimated, leading to defects in the apical, anterior, or septal wall.
The 4 cases that did not benefit from improved coregistration suggest that misalignment in the z-direction causes similar artifacts. However, this misalignment is much more difficult to detect and correct. Most obviously, the body outline cannot serve as a reference and there are no internal landmarks easily discernible in both CT and SPECT. Another reason is that the Hawkeye device has a fixed slice width of 10 mm, causing low resolution in the z-direction. As we have shown, even a misalignment of 3.5 mm in the y-direction leads to a detectable artifact, which means that a 10-mm slice width is inadequate. In response, General Electric Medical Systems has proposed to reduce the feed of the patient table to 5 mm. This is not worthwhile because of the fixed collimation of the x-ray source, which leaves no room for improving the resolution. Even worse, acquisition time and radiation exposure are doubled, because every part of the axial field of view is effectively scanned twice. A certain misalignment in the z-direction is indeed unavoidable because of the respiratory motion. As a phantom study has shown, diaphragmatic motion artifacts manifest themselves as reduced uptake in both the anterior and the inferior walls relative to the lateral wall, an effect not corrected by AC (18). Respiratory gating of myocardial SPECT images is required to overcome this limitation.
In a joint position statement, the American Society of Nuclear Cardiology and the Society of Nuclear Medicine recommend that both noncorrected and corrected image sets be reviewed and integrated into the final report (1). With both image sets at hand, an experienced observer will identify defects in the apical or anterior myocardial wall that are present only in the attenuation-corrected images. The observer usually will discard them as artifacts with some confidence. The basal inferior lateral wall, on the other hand, exhibits a significant decrease in relative uptake after correction for misalignment. In other words, misalignment causes those myocardial segments to be overcorrected. This artifact is much harder to detect because an increase of relative uptake is what the investigator expects of attenuation-corrected images. Nevertheless, this may lead to misinterpretation and a loss of sensitivity in these segments.
Mismatch between the modalities of an integrated multiple-modality imaging system is an unexpected observation. The patient table has to be extended from the SPECT position to reach the CT field of view. Bed deflection is known to cause problems in multiple-modality imaging devices. The gantry is equipped with support rollers that engage after the bed has traversed the axial field of view of the CT scanner and the camera heads. Only one end of the bed, however, will be supported for the first 90 cm of travel. The manufacturer seems to have anticipated some deflection, as the bed actually aims at a point ∼1 cm above the support rollers to avoid collision under maximum load. Mechanical problems could explain our results, but the malfunction does not occur only in obese patients but occurs rather randomly and not dependent on patient weight, height, or body mass index. Another cause of misalignment is patient movement. As described, the arms of the patients are placed over the head during acquisition. This is an uncomfortable position, especially for elderly patients. Movement of the arms during acquisition might cause misalignment in the y- and z-directions. Additional arm rests or acquisition in prone position with the arms positioned on the patient table may help to prevent arm movements.
CONCLUSION
CT delivers attenuation maps of high quality that are superior to those acquired with radionuclide transmission scanning. With better transmission images, it becomes evident that misalignment between the transmission and emission scans can be a major source of artifacts even with an integrated dual-modality imaging device. This issue has not been adequately addressed so far. Efforts are needed to rule out misalignment caused by mechanical or software problems. The design of the patient bed might need to be improved. Currently, the coregistration of the transmission and emission scans should be verified for every patient. The software included with dual-modality imaging systems should allow for easy detection and correction of a misalignment, which does not hold true for the commercial software currently available.
Acknowledgments
The authors thank the technical staff of our institution for data acquisition.
Footnotes
Received Jan 27, 2004; revision accepted Apr. 13, 2004.
For correspondence or reprints contact: Harald Fricke, Dr. rer. biol., Institute of Molecular Biophysics, Radiopharmacy and Nuclear Medicine, Heart and Diabetes Center North Rhine-Westphalia, Georgstrasse 11, D-32545 Bad Oeynhausen, Germany.
E-mail: hfricke{at}hdz-nrw.de
REFERENCES
In this issue


Jump to section
Related Articles
Cited By...
- Study of Attenuation Correction Using a Cardiac Dynamic Phantom: Synchronized Time-Phase-Gated Attenuation Correction Method
- Value of a Lower-Limb Immobilization Device for Optimization of SPECT/CT Image Fusion
- Directions and Magnitudes of Misregistration of CT Attenuation-Corrected Myocardial Perfusion Studies: Incidence, Impact on Image Quality, and Guidance for Reregistration
- Attenuation Correction in Myocardial Perfusion SPECT/CT: Effects of Misregistration and Value of Reregistration
- Cardiac Image Fusion from Stand-Alone SPECT and CT: Clinical Experience
- Artifacts from Misaligned CT in Cardiac Perfusion PET/CT Studies: Frequency, Effects, and Potential Solutions
- The Year in Cardiac Imaging