


Abstract
To evaluate whether scintigraphy with 99mTc-labeled white blood cells (WBC) can assess the intensity of bowel inflammation, a large dataset of laboratory values and clinical activity indices was correlated with 99mTc-WBC scintigraphy in children with Crohn’s disease (CD), ulcerative colitis (UC), and miscellaneous colitis (MC). Also evaluated was whether stratification of children with CD as ileitis versus colitis results in different correlation coefficients for laboratory values versus 99mTc-WBC scintigraphy. Methods: Over a 6-y period, 313 99mTc-WBC studies were performed. A dataset of 2,714 laboratory values is available for analysis. Results: There is a positive correlation between the erythrocyte sedimentation rate (ESR) and large bowel uptake of 99mTc-WBC (P < 0.05) and a negative trend with small bowel uptake of 99mTc-WBC in children with CD. Similarly, there is a correlation between WBC counts and scintigraphy in most segments of the large bowel and a negative correlation with the small bowel (R = −0.32, P = 0.01) in children with CD. There is a correlation between platelets and 99mTc-WBC in children with CD or UC. There is no correlation between the ESR and 99mTc-WBC in children with UC or MC. Many clinical activity indices correlate (P < 0.001) with 99mTc-WBC in children with CD, but none correlates in children with UC. Numerous laboratory values correlate with each other. There is a negative correlation between protein, albumin, hemoglobin, and hematocrit versus 99mTc-WBC scintigraphy in children with CD. In children with UC, there is a negative correlation between hemoglobin and hematocrit versus 99mTc-WBC. Conclusion: 99mTc-WBC scintigraphy, ESR, and WBC counts are good indicators of the inflammatory activity in CD if the inflammation is limited to the large bowel. There is a trend toward an inverse relationship when the inflammation is limited to the small bowel; thus, scintigraphy and the aforementioned markers may be of limited value. This report also demonstrates that 99mTc-WBC scintigraphy correlates with clinical activity indices in CD and with numerous biologic markers. In children with UC, scintigraphy with 99mTc-WBC and most laboratory markers are of limited value in assessing disease activity.
- laboratory markers
- assessment of intensity of inflammation in inflammatory bowel disease
- 99mTc-labeled white blood cells
Localization and quantification of inflammation in inflammatory bowel disease (IBD) are crucial to establishing a diagnosis, evaluating prognosis, and determining optimal therapy. Patients expect the research community to provide objective information by which physicians can answers their questions regarding prognosis (1). Growing literature suggests that providing patients with knowledge about their disease and its management results in improvements in symptoms and health care savings (2,3). Farmer et al. have shown that the anatomic location of disease is a major determinant in the clinical course (4). Patients with localized ileal disease fared the best. The erythrocyte sedimentation rate (ESR) may be a predictor of the anatomic distribution of inflammation, as suggested by Sachar et al. (5,6), in which the ESR appeared to correlate well with activity in cases of predominantly colonic diseases but not in cases of inflammation limited to the small bowel.
The goal of this retrospective study was to evaluate whether 99mTc-labeled white blood cell (WBC) scintigraphy can assess the intensity of inflammation by comparison with biologic markers and clinical activity indices. Also evaluated was whether stratification of children with Crohn’s disease (CD) as ileitis versus colitis results in different correlation coefficients with the biologic markers frequently obtained in the evaluation of the intensity of inflammation in IBD (i.e., ESR, hemoglobin [Hg], hematocrit [Ht], WBC, platelets [Plt], albumin [Alb], and protein [Pro]).
MATERIALS AND METHODS
Patients
Over a 6-y period, 313 99mTc-WBC studies were performed and the hospital charts of these consecutive children were reviewed. There were 144 boys and 169 girls (average age, 13 y). Three groups of children were evaluated: (a) 132 children with known IBD who had a 99mTc-WBC scan for assessment of a clinical flare; (b) 130 children who had a 99mTc-WBC scan to exclude IBD; the final diagnosis (by colonoscopy and biopsies) in this latter group is CD in 27, ulcerative colitis (UC) in 9, miscellaneous colitis (MC) in 13 (7 indeterminate colitis, 4 infectious colitis, and 2 autoimmune colitis), probably normal in 42 (children with no evidence of IBD by clinical follow-up and radiographic study), and normal in 39 (normal colonoscopy); (c) 51 control subjects who underwent 99mTc-WBC scanning for other medical problems (final diagnoses: osteomyelitis, cellulitis, trauma, myocarditis, and fever of unknown origin, painful hip, and peritonitis). In summary, 119 children had CD, 37 had UC, 24 had MC, and 126 did not have IBD. The Institutional Review Board of this institution approved the study.
Performance of Scans
The labeling of leukocytes with 99mTc and 20–45 mL of venous blood has been described (7). The patient voids before any imaging. Imaging is done with a large-field-of-view gamma camera fitted with a low-energy, high-resolution collimator and images are obtained at 0.5 and 2–3 h (8) after injection of 99mTc-WBC. Anterior and posterior 8-min images of the abdomen and pelvis are recorded in analog and digital form. Two to 3 h after injection, and no later (8), an 8-min static-anterior supine view of the abdomen and pelvis is obtained followed by SPECT imaging with the following acquisition parameters: 30 s per stop; 60 stops; 120 projections; 1.6× magnification; prefilter, Hanning–Nyquist 1.515: cutoff, 1.315; ramp filter, Nyquist 1.515: cutoff, 1.31. Volume-rendered images using the maximum activity projection technique are derived from the SPECT data (9).
All images were reviewed on a workstation with ad-lib manipulation of intensity scale, contrast, color scale, and cine display rotational speed. When scan findings were equivocal, delayed imaging was performed at 6–8 h (8).
Analysis of Scans
In each set of scans (0.5–1 and 2–3 h) from the 313 patients, the bowel is divided into 8 segments (rectum, sigmoid, descending, transverse, ascending, cecum, terminal ileum, and small bowel), resulting in 5,008 bowel segments for scoring (i.e., 8 segments × 2 images × 313 patients = 5,008). The inflammatory activity in each segment is graded semiquantitatively by comparing the uptake in the bowel with that in the iliac crest bone marrow and liver: grade 0 = no activity, grade 1 = activity less than iliac crest, grade 2 = activity similar to iliac crest, grade 3 = activity greater than iliac crest, grade 4 = activity equal to liver, grade 5 = activity greater than liver, grade 6 = activity equal to spleen. For each patient, a scan activity index (SAI) is computed by summing up each segment score.
Laboratory Values and Data Analysis
A dataset of 2,714 laboratory values is available for analysis. This dataset includes the following values: 508 ESR, 449 Hg, 394 Ht, 367 Plt, 447 WBC, 349 Alb, and 113 Pro. The uptake in each bowel segment is compared with the ESR, WBC, Hg, Ht, Plt, Alb, and Pro obtained within 3 d, 1 wk, 2 wk, 3 mo, 6 mo, or 1 y of the 99mTc-WBC scan, when available. The data are analyzed by disease (CD, UC, and MC) and by anatomic distribution of inflammation. The temporal changes in those laboratory values are analyzed by disease. Laboratory values are correlated with each other. The result of 99mTc-WBC scintigraphy is correlated with clinical indices of disease activity for CD and UC, indices computed with quantitative objective data only. Only laboratory values obtained within 3 d of the 99mTc-WBC scan are used for correlations, unless specified. Statistical analysis is performed with SPSS 11 (SPSS Inc.) and plots with Sigmaplot 2001 version 7 (SPSS Inc.)
RESULTS
CD
ESR.
The correlation between the ESR and uptake of 99mTc-WBC is statistically significant for the sum of all large bowel segments (R = 0.257, P = 0.093) and for the SAI (R = 0.314, P = 0.041) (Table 1; Figs. 1 and 2). There is a trend toward a negative correlation (R = −0.29, P = 0.852) of the ESR versus uptake of 99mTc-WBC in the terminal ileum (Fig. 3).

ESR vs. SAI in children with CD.
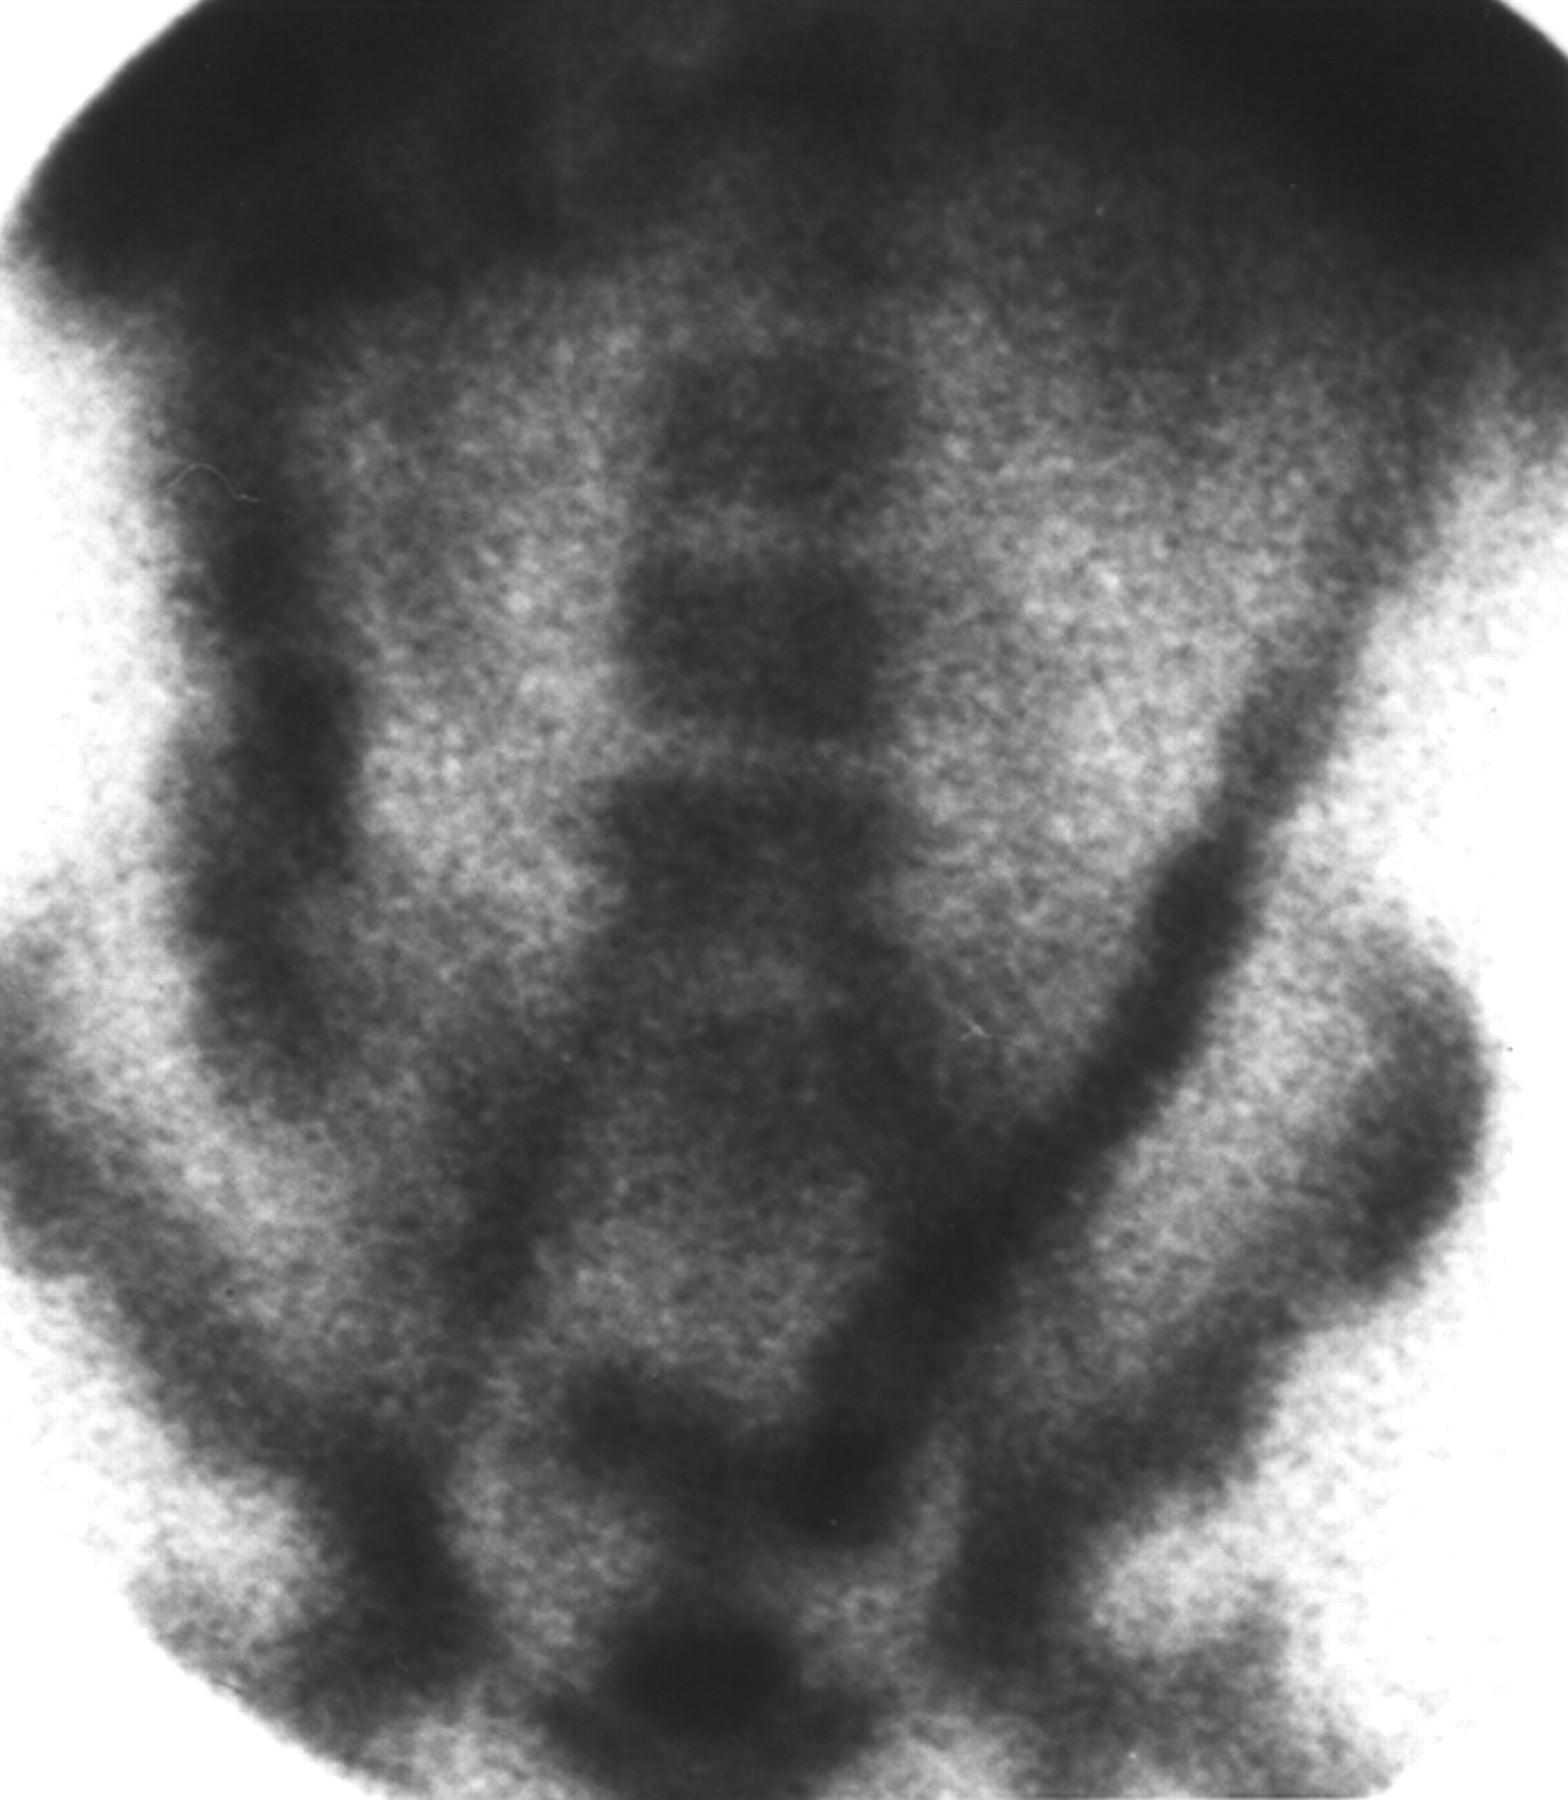
Anterior projection of scintigraphy with 99mTc-WBC of 18 y old with CD that reveals increased uptake in sigmoid, ascending, and descending colon (ESR, 29 mm/h; WBC, 15.5 × 1,000 cells/mm3 μL; Alb, 2.9 g/dL).

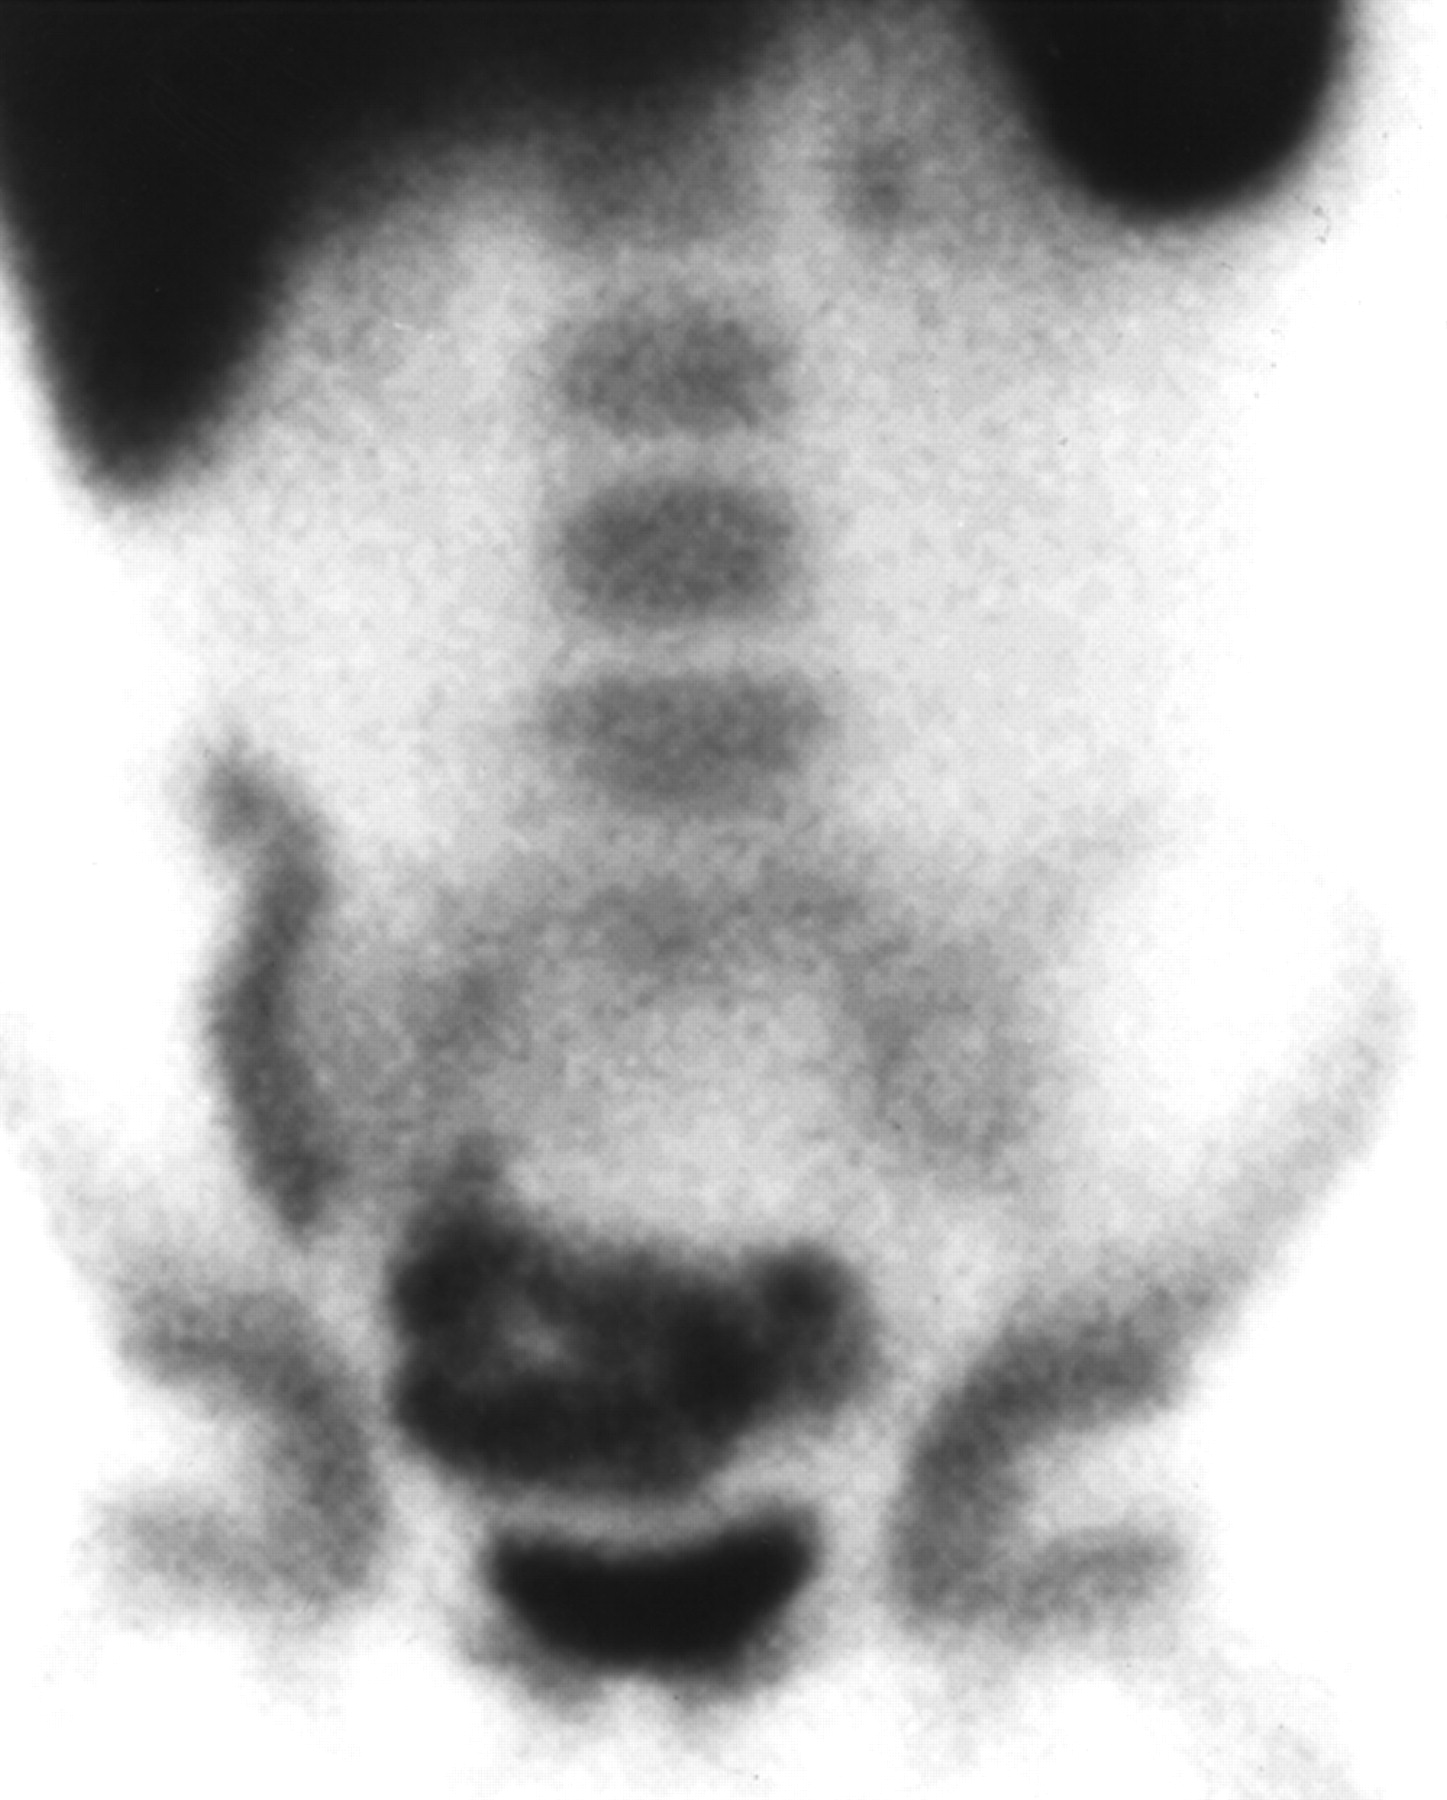
Anterior projection of scintigraphy with 99mTc-WBC of 11 y old with CD that reveals increased uptake limited to small bowel (ESR, 7 mm/h; WBC, 7.5 × 1,000 cells/mm3 μL; Alb, 4.1 g/dL).
Pearson Correlation Coefficient (R) and Significance (P) for Laboratory Value vs. Segmental Bowel Uptake of 99mTc-WBC in CD
When the ESR is obtained within 3 d of the 99mTc-WBC scan, the correlation with the SAI is R = 0.314 (P = 0.041); within 1 wk, R = 0.358 (P < 0.05); within 2 wk, R = 0.254 (P = 0.129); within 1 mo, R = −0.029 (P = 0.84); within 3 mo, R = −0.002 (P = 0.989); within 6 mo, R = 0.241 (P = 0.145); and within 1 y, R = 0.068 (P = 0.759).
WBC.
There are statistically significant correlations between WBC and scintigraphy in all segments of the large bowel except the rectum (Table 1) in children with CD. There is a negative correlation between WBC and scintigraphy when the uptake is confined solely to the small bowel (R = −0.325, P = 0.019). The plot of 99mTc-WBC uptake for each bowel segment versus WBC reveals a positive and negative correlation for the large and small bowel, respectively (Fig. 4).
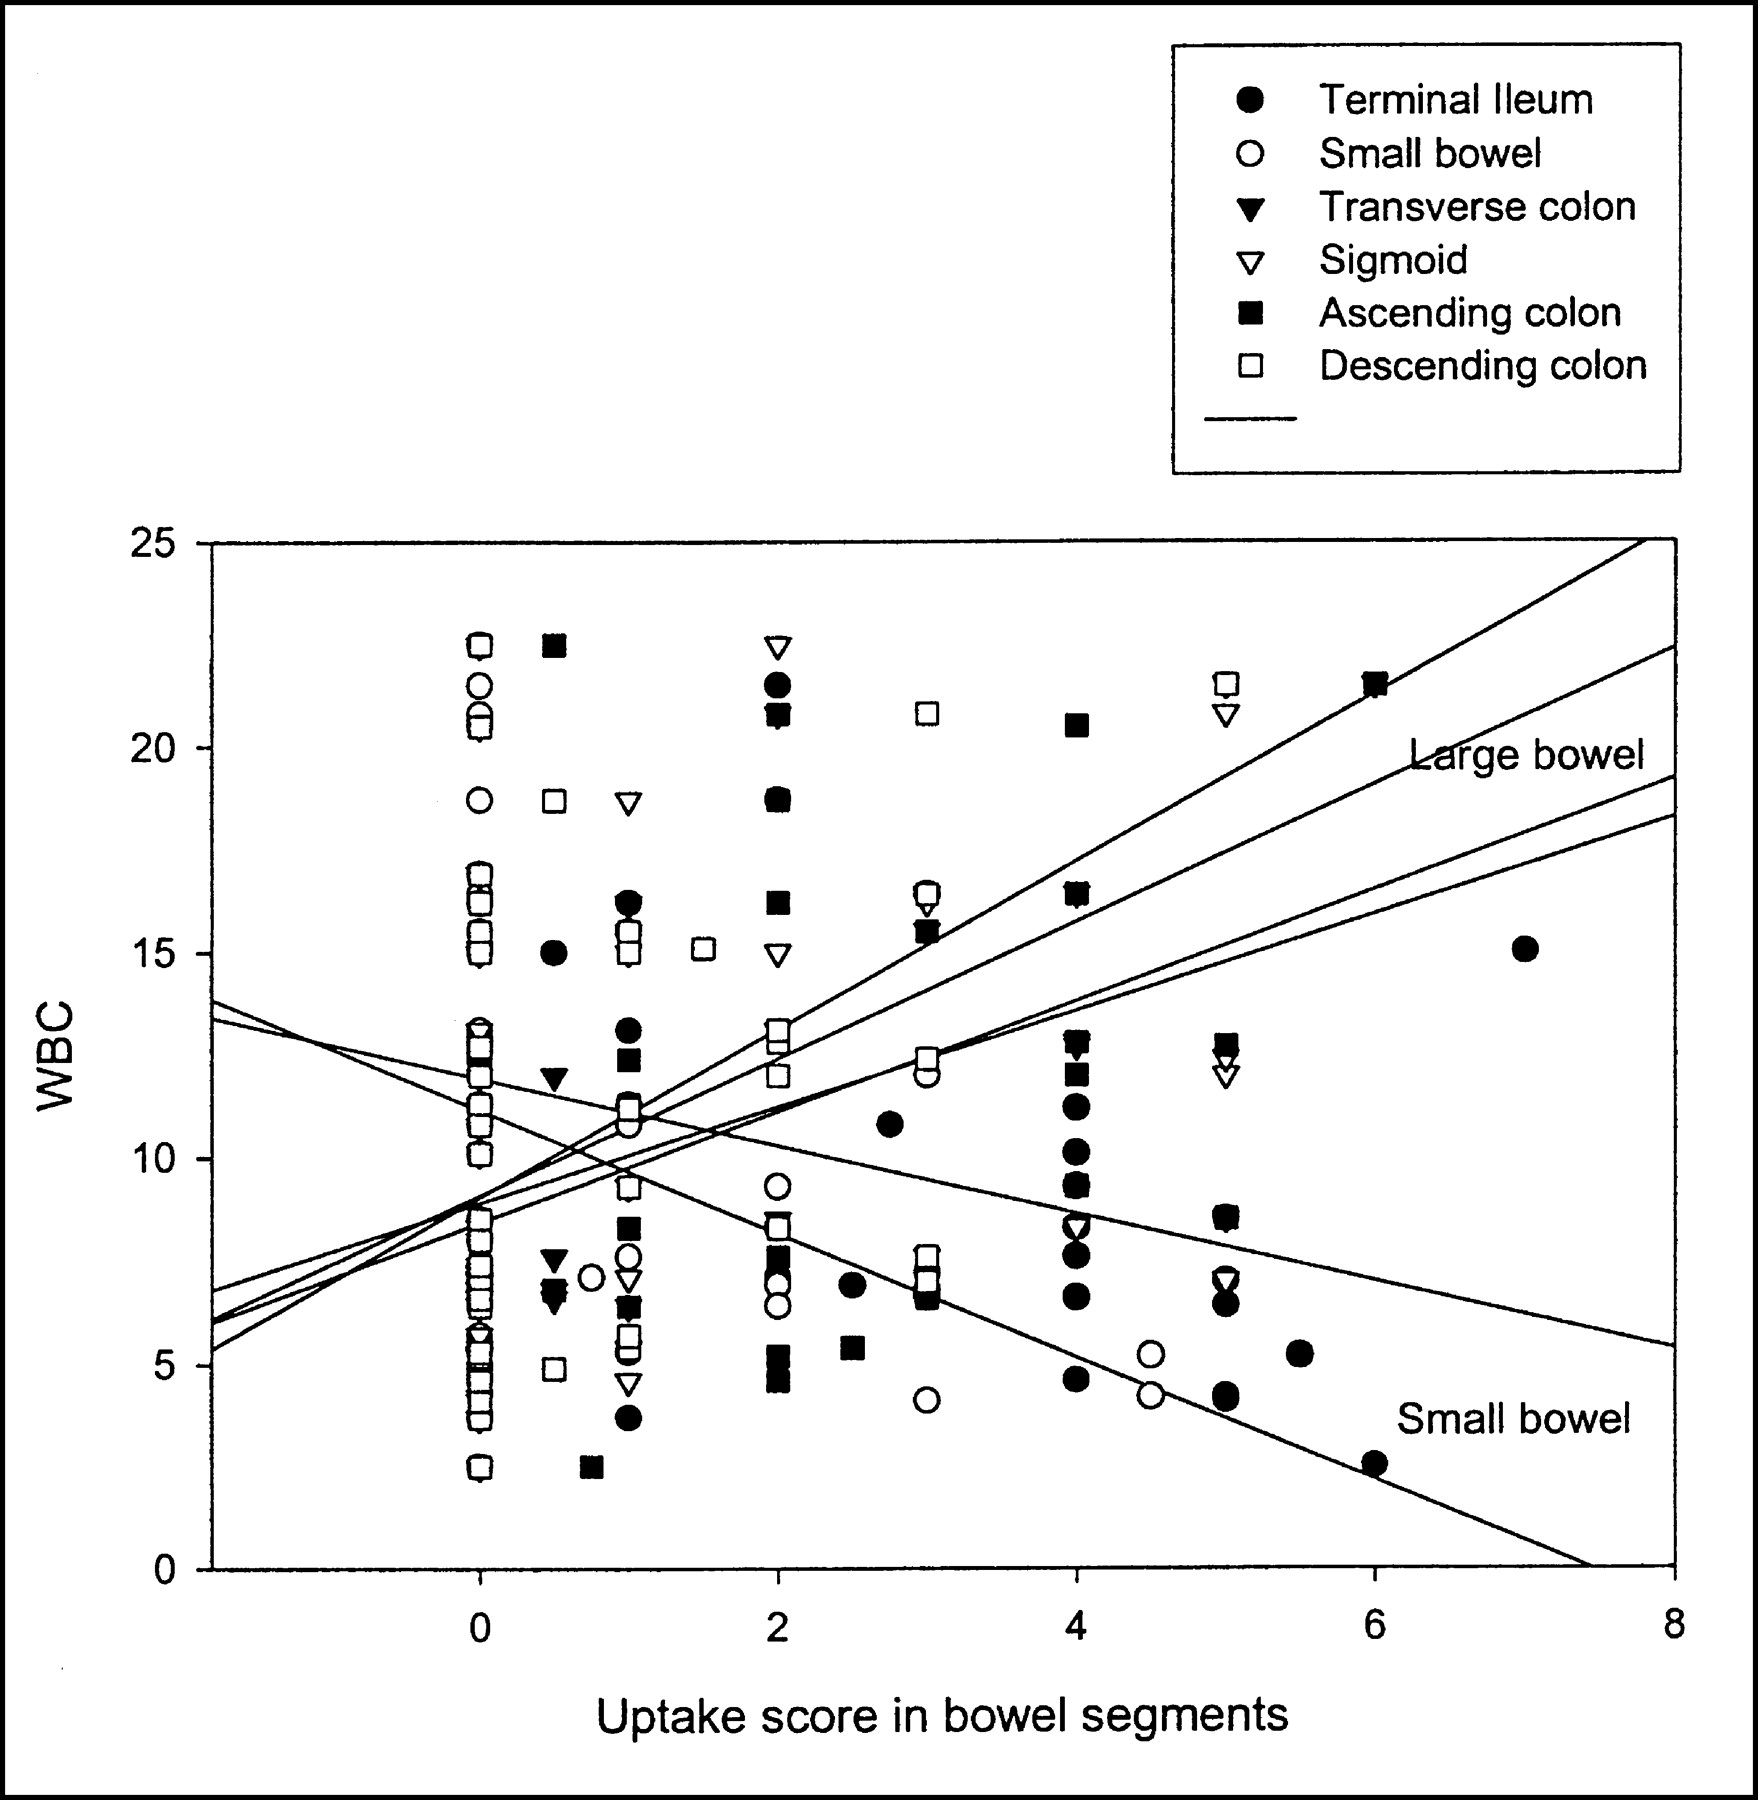
Concatenated graph of WBC vs. 99mTc-WBC uptake in terminal ileum, small bowel, ascending colon, transverse colon, descending colon, and sigmoid in children with CD.
Other Biologic Markers.
The Plt correlate with the uptake of 99mTc-WBC in the cecum, ascending colon, transverse colon, and the SAI (Table 1). There is a negative correlation between the Hg and Ht and the uptake of 99mTc-WBC in all bowel segments (statistically significant for the ascending colon and rectum) (Table 1). Similarly, there is a negative correlation between Alb and Pro versus the uptake of 99mTc-WBC for most bowel segments (statistically significant for the sigmoid, ascending colon, and transverse colon).
Miscellaneous.
In terms of correlation of laboratory values among each others, there is a correlation between ESR and Ht (R = −0.361, P = 0.021), WBC and Plt (R = 0.381, P = 0.011), WBC and Pro (R = −0.326, P = 0.073), Hg and Ht (R = 0.966, P = 0.001), Hg and Plt (R = −0.380, P = 0.012), Hg and Alb (R = 0.499, P = 0.004), Hg and Pro (R = 0.515, P = 0.004), Ht and Plt (R = −0.382, P = 0.011), Ht and Alb (R = 0.403, P = 0.022), Ht and Pro (R = 0.447, P = 0.012), and Alb and Pro (R = 0.738, P = 0.001).
The SAI score is statistically different in patients with active CD versus inactive disease. The former group has a mean SAI score of 14.7 ± 11.1 with a lower and upper 95% confidence interval of 13.1 and 16.5, respectively. The latter group has a mean SAI score of 2.72 ± 3.8 with a lower and upper 95% confidence interval of 0.84 and 4.59, respectively. No significant correlation differences are noted between biologic markers and uptake of 99mTc-WBC on the early versus the late images.
Table 2 lists correlation between the SAI and different clinical activity indices.
Pearson Correlation Coefficient (R) and Significance (P) for SAI vs. Clinical Activity Indices
UC and MC
ESR.
There is no correlation between the ESR and any bowel segment uptake of 99mTc-WBC in children with UC or MC. When the ESR is obtained within 3 d of the 99mTc-WBC scan, R = 0.081 (P = 0.759); within 1 wk, R = 0.381 (P = 0.247); within 2 wk, R = 0.28 (P = 0.404); within 1 mo, R = 0.474 (P = 0.167); within 3 mo, R = 0.18 (P = 0.577); within 6 mo, R = −0.65 (P = 0.114); and within 1 y, R = 0.073 (P = 0.927).
Plt, Hg, and Ht.
There is a correlation between Plt and uptake of 99mTc-WBC in the descending colon and sigmoid (R = 0.542, P = 0.03). The uptake of 99mTc-WBC in the sigmoid shows a negative correlation with Hg (R = −0.562, P = 0.015) and Ht (R = −0.501, P = 0.034).
Miscellaneous.
In terms of the correlation of laboratory values between each other, there is a correlation between the ESR and Plt (R = 0.751, P = 0.003), WBC and Hg (R = −0.503, P = 0.039), WBC and Alb (R = −0.718, P = 0.009), Hg and Ht (R = 0.99, P < 001), Hg and Plt (R = −0.701, P = 0.004), Ht and Plt (R = −0.677, P = 0.004), Ht and Alb (R = 0.609, P = 0.036), and Plt and Pro (R = 0.823, P = 0.006).
DISCUSSION
Assessment of disease severity and activity is important for planning the management of IBD, for the evaluation of treatment, and for prediction of prognosis. For quantifying disease severity, several different clinical indices for both UC and CD have been developed and correlated with biochemical parameters. The plethora of proposed clinical indices indicated that none is ideal. All of these indices have applications in clinical research, but most are too cumbersome for daily use in patient management. Endoscopic indices of activity have been designed but correlate poorly with clinical symptoms.
With specific reference to laboratory markers of inflammation in the gut, several serum markers have been studied. Hg determination reflects the long-term balance of iron stores versus loss and is not specific as an indicator of disease activity. The WBC is a supportive indicator of severity or transmural disease. Acute-phase reactants such as the ESR have been evaluated as markers for disease activity and demonstrate relatively good levels of correlation with clinical disease classification. Surrogate markers of inflammation are useful to distinguish organic from inorganic intestinal disease (10). In clinical practice, the ESR is the most frequently used index of inflammation.
In their initial report, Farmer et al. (11) emphasized the importance of disease location as a predictor of the “clinical pattern” that patients might expect. They grouped patients in 4 groups: ileocolonic (distal ileum and right colon, 41%), small bowel only (29%), colonic (27%), and rectal disease (3%). Patients with ileocolonic disease had a greater risk of surgery. Patients with small bowel disease developed intestinal obstruction twice as often as inpatients with exclusively colonic disease. Patients with colonic disease had the greatest risk of rectal bleeding. In their second report, patients with segmental colonic disease had the best prognosis (12). Similarly, Holdstock et al. (13) suggested that the anatomic location distinguished the course of CD of the small intestine versus CD of the colon in terms of symptom, the number of surgeries, and the number of relapses per year. The Vienna Working Party developed a simple classification of CD based on objective variables including disease location (14). Location of CD, as defined by the Vienna classification, was found subsequently by Louis et al. (15) to be a relatively stable phenotype that seems suitable for phenotype–genotype analyses.
In a retrospective study of 77 adults with CD or UC, Sachar et al. (6) found that, although the ESR was a generally reliable index of disease activity, it was not uniformly applicable to all group of patients. The ESR appeared to correlate well with activity in cases of predominantly colonic disease but not in cases localized to the small bowel. The highest mean ESR was in patients with the most extensive colon involvement (Crohn’s colitis, 40.7 ± 3.3; universal ulcerative colitis, 31.0 ± 3.9), whereas the lowest mean ESR was in patients with the most limited disease (ulcerative proctitis and proctosigmoiditis, 19.2 ± 2.1) (6). A later report from the same group (5) showed that for 18 patients with CD involving primarily the colon, there was a trend toward a direct correlation between the clinical score and ESR (P = 0.15). By contrast, an opposite trend was observed for patients with small bowel disease. For the 26 patients with disease involving predominantly the small bowel, as well as for the 22 patients with disease limited to small bowel, there were statistically significant inverse correlations between the clinical score and ESR (P < 0.04). This difference between the directions of the correlations for Crohn’s colitis versus ileitis was statistically significant (P < 0.05). In summary, those 2 reports from the same group provide further evidence for a direct correlation between the ESR and clinical activity in Crohn’s colitis and an inverse correlation in ileitis (5,6). One explanation for the difference could be that it reflects actual biologic differences between the ESR generated by inflammation of the small bowel and the colon (16). An alternative explanation (5) may lie in the different way by which clinicians assess clinical activity in ileitis and colitis.
In this study, the ESR did reveal a trend similar to that described by Sachar et al. (5)—that is, there is a negative correlation between the ESR and inflammation of the small bowel and a positive correlation for inflammation in the large bowel only. The ESR showed a positive correlation with uptake of 99mTc-WBC in the sigmoid, rectum, and the sum of all large bowel segments. Additionally, this study found that WBC behaved similarly—that is, there is a positive correlation of WBC with uptake of 99mTc-WBC in the colon and a negative correlation in the case of inflammation limited to the small bowel. This provides further evidence of actual biologic differences generated by inflammation of the small bowel versus the colon.
As to the ability of 99mTc-WBC scintigraphy to assess the intensity of inflammation, smaller series have shown a correlation between the uptake of 99mTc-WBC and ESR (17–20). This study reports similar findings, and this correlation decreases with time as the flare of inflammation subsides, a finding not previously reported in children with CD. There is also a good correlation of scintigraphy with clinical activity indices (pediatric CD activity index (21), Lloyd-Still and Green (22)). No such correlation is noted with clinical activity indices in UC.
In children with CD, a negative correlation is seen between Pro, Alb, Hg, and Ht versus 99mTc-WBC scintigraphy in segments of the large and small bowel, suggesting that the greater the inflammation the greater the losses in the bowel lumen. Similarly, in children with UC, a negative correlation is seen with Hg and Ht.
A recent study revealed a poor predictive value of inflammatory and coagulation parameters in the course of UC (23). Similarly, no significant correlation was found between most surrogate markers of inflammation and 99mTc-WBC in children with UC. However, many have reported that the Plt count can be a gauge of moderate–severe inflammation and may correspond to the thrombogenic potential in acute IBD (24,25). Holmquist et al. (26) noted that thrombocytosis and hypoalbuminemia correlated best with histologic inflammation of the colon. In this report, the Plt correlate with uptake of 99mTc-WBC in segments of the colon.
CONCLUSION
In children with Crohn’s colitis, there is a positive correlation between both WBC and ESR versus scintigraphy and a negative correlation in children with ileitis. This report also demonstrates that 99mTc-WBC scintigraphy correlates with clinical activity indices in CD and numerous laboratory values (Hg, Ht, Plt, Pr, ESR, and Alb). The results of this study suggests that scintigraphy with 99mTc-WBC may be used clinically to assess the intensity of inflammation in children with known Crohn’s colitis.
Footnotes
Received Mar. 21, 2003; revision accepted Jun. 13, 2003.
For correspondence or reprints contact: Martin Charron, MD, Division of Nuclear Medicine, Department of Radiology, Children’s Hospital of Philadelphia, 34th and Civic Center Blvd., Philadelphia, PA 19104.
E-mail: charron{at}email.chop.edu


