


Article Figures & Data
Figures
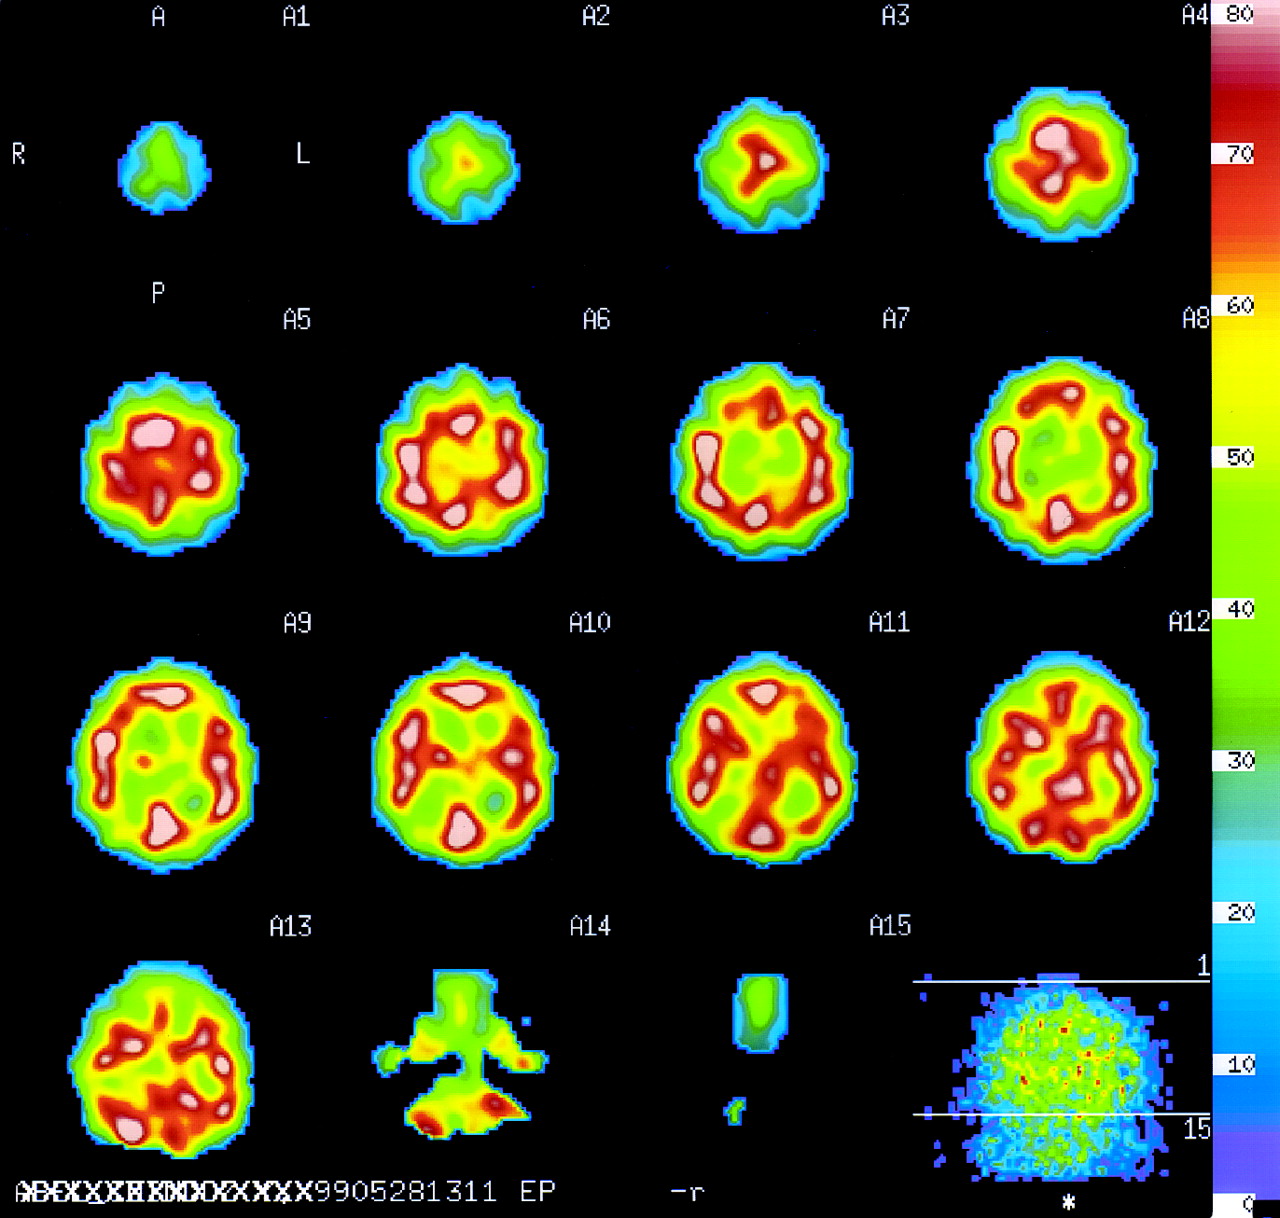
- FIGURE 1.
133Xe SPECT images of healthy volunteer. Results are presented as successive transaxial planes from top to bottom. Brain volume is included in 12 consecutive planes. First plane shows planar orientation (right [R], left [L], anterior [A], and posterior [P]). Last plane shows brain volume of analysis. Pixel values of regional CBF are color coded and express quantitative measurement in mL/min/100 g tissue equivalent.
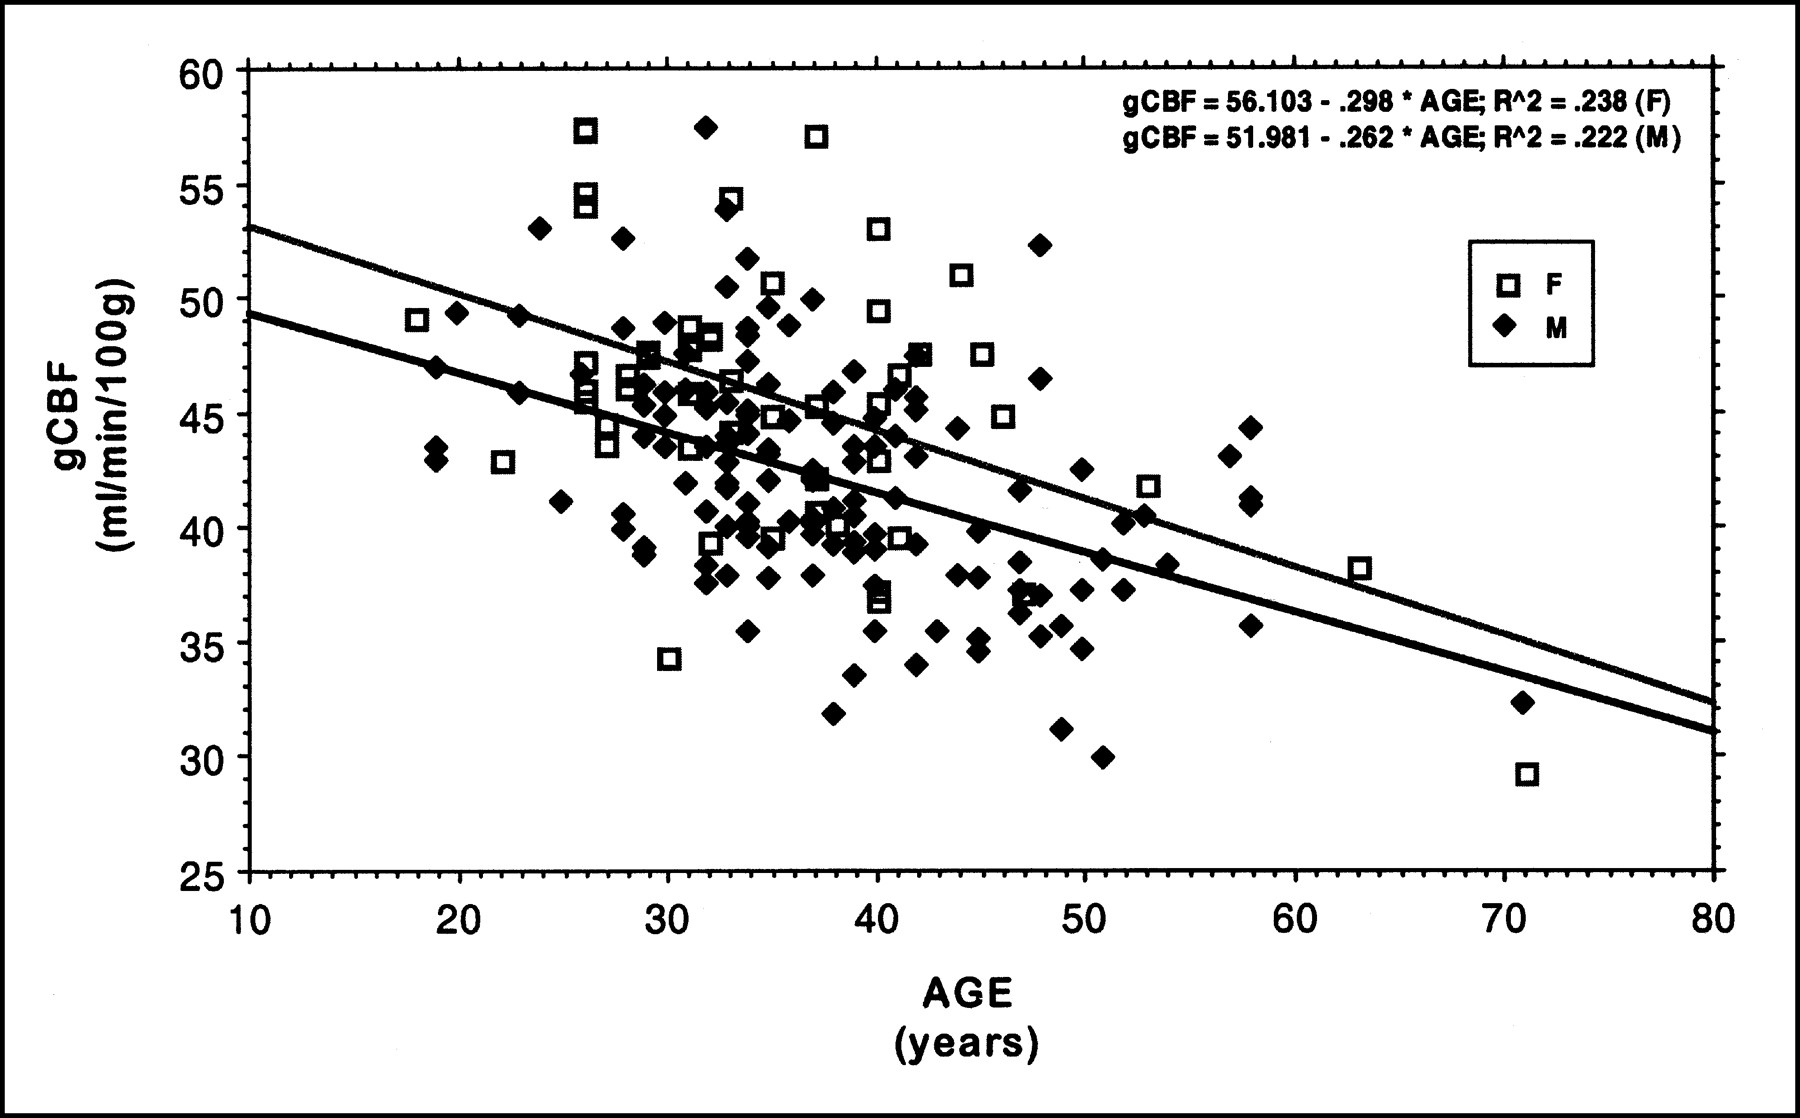
- FIGURE 2.
Linear regression of gCBF as function of age for men (M) and women (F), separately.
- FIGURE 3.
Box plot graph of T-score (T-SC) adjusted for sex as function of age.


Tables
Sex Age classification YHA 29–38 y 39–48 y >48 y Men n 16 66 37 18 Mean ± SD 46.7 ± 5.1 43.4 ± 4.4 39.9 ± 4.1 38.5 ± 5.3 Women n 14 21 13 3 Mean ± SD 49.0 ± 5.0 45.6 ± 5.2 44.5 ± 5.5 36.4 ± 6.4 Data are gCBF in mL/min/100 g tissue.
Sex MHB Educational level (y) F MT BG9 TMT NINC MED COR MED COR A B Both n 133 167 167 166 167 167 164 Mean ± SD 27.3 ± 4 14.7 ± 3.0 753 ± 193.4* 93.1 ± 4.3 638 ± 150* 12.9 ± 1.8* 28 ± 5.3*,† 25.9 ± 7.8* 57.2 ± 19* 20.6 ± 2.9‡ Women n 38 48 48 47 48 48 48 Mean ± SD 27.12 ± 3.7 14.6 ± 2.8 717 ± 148 94.1 ± 2.5 621 ± 126 12.7 ± 1.8 29.8 ± 5.6 24.6 ± 6.4 52.3 ± 17.1 21.3 ± 2.45 Men n 95 119 119 119 119 119 116 Mean ± SD 27.23 ± 3.9 15.0 ± 3.2 763 ± 188 92.6 ± 4.5 637 ± 155 13.1 ± 1.5 27.7 ± 4.6 26.3 ± 7.2 58.8 ± 18.6 20.6 ± 2.9 Sex Age (y) Weight (kg) Height (cm) BMI Lean mass (g) Fat mass (g) % Fat Both n 167 166 167 166 164 164 164 Mean ± SD 34.7 ± 6.6 73.8 ± 13.1* 174.8 ± 9.1* 24.0 ± 3.1* 55,355 ± 9,942* 16,040.9 ± 5,490.1 21.6 ± 5.9*,† Women n 48 48 48 48 47 47 47 Mean ± SD 35.2 ± 6.5 60.1 ± 7.7 165.2 ± 6.2 22.0 ± 2.3 41,951 ± 3,886 16,290 ± 4,032 26.6 ± 4.6 Men n 119 119 119 118 117 117 117 Mean ± SD 33.4 ± 6.8 78.1 ± 10.5 178.2 ± 7.1 24.6 ± 3.1 59,834 ± 5,909 15,556 ± 5,450 19.4 ± 4.8 Sex Glucose (4.2–6.0 mmol/L) Triglycerides (0.4–2.1 mmol/L) Total cholesterol (<6.5 mmol/L) LDL (<4 mmol/L) HDL (>0.9 mmol/L) Both n 164 164 164 164 164 Mean ± SD 5.2 ± 0.4* 1.2 ± 0.6 5.4 ± 1.1* 3.5 ± 1* 1.4 ± 0.3† Women n 48 48 48 48 48 Mean ± SD 5.1 ± 0.4 1.0 ± 0.5 5.2 ± 1.0 3.2 ± 0.8 1.6 ± 0.3 Men n 116 116 116 116 116 Mean ± SD 5.2 ± 0.4 1.2 ± 0.6 5.3 ± 1.0 3.5 ± 1.0 1.2 ± 0.2 - TABLE 5
Cognitive Performance, Physical Characteristics, and Laboratory Findings of YHA Cohort
Category YHA women (n = 14) YHA men (n = 16) Cognitive performance MHB 26.7 ± 3.4 26.5 ± 3.8 Educational level (y) 14.1 ± 2.9 15.8 ± 3 F_MED 701 ± 174 668 ± 158 F_COR 93.3 ± 2.27 92.6 ± 3.4 MT_MED 587 ± 125 585 ± 149 MT_COR 13.1 ± 1.5 12.9 ± 2.1 BG9 31.2 ± 6.6 30.1 ± 4.8 TMTA 22.9 ± 6.6 23.1 ± 5.4 TMTB 48.6 ± 19.1 54 ± 19.1 NINC 20.7 ± 3 22.1 ± 2.9 Physical characteristics Age (y) 25.6 ± 2.6 24.5 ± 3.6 Weight (kg) 59.3 ± 7.8 72.8 ± 10.6 Height (cm) 164.1 ± 4.3 177.2 ± 6.6 Body mass index 22.0 ± 2.4 23.2 ± 3 Lean mass (g) 41,589 ± 4,023 57,607 ± 7,147 Fat mass (g) 15,890 ± 4,682 12,833 ± 4,412 % Fat 26.2 ± 5.2 17.2 ± 4.4 Laboratory findings Glucose (mmol/L) 4.9 ± 0.4 5.1 ± 0.4 Triglycerides (mmol/L) 0.99 ± 0.31 0.98 ± 0.50 Total cholesterol (mmol/L) 4.74 ± 1.14 4.88 ± 1.00 LDL (mmol/L) 2.781 ± 0.750 3.174 ± 0.963 HDL (mmol/L) 1.663 ± 0.341 1.258 ± 0.190 Data are mean ± SD.
In this issue


Jump to section
Related Articles
Cited By...
- Accuracy of Parenchymal Cerebral Blood Flow Measurements Using Pseudocontinuous Arterial Spin-Labeling in Healthy Volunteers
- Brain-Derived Neurotrophic Factor Val66Met Polymorphism Affects Resting Regional Cerebral Blood Flow and Functional Connectivity Differentially in Women Versus Men
- Negative neurofunctional effects of frequency, depth and environment in recreational scuba diving: the Geneva "memory dive" study