


Abstract
Dementia is becoming a major health problem as the population of the Northern Hemisphere ages. Early differential diagnosis between normal cognitive decline and dementia is particularly difficult. If psychometric evaluation can contribute to the diagnosis, quantitative cerebral functional imaging would play an important role. We therefore proposed, first, to constitute a normative dataset that could later be used to identify subjects at risk for neurodegenerative processes and, second, to describe the risk of abnormal global cerebral blood flow (gCBF) by defining categories based on the standardized cutoff scores of a young, healthy population (T-score). Methods: Of a total of 203 healthy volunteers, 187 were included in the protocol, which included evaluation of medical history, neurologic and neuropsychologic status, and body composition; analysis of blood; and measurement of gCBF by means of 133Xe SPECT. Results: With ANOVA analysis using age and sex as between-subject factors and gCBF as a within-subject factor, a significantly higher gCBF was found in women than in men. In addition, a linear reduction as a function of age was observed for both sexes (−0.3%/y). T-score was determined for the 18- to 28-y-old age group, for whom gCBF was found to be 46.7 ± 5.1 mL/min/100 g tissue in men and 49.0 ± 5.0 mL/min/100 g tissue in women. The age-dependent decrease could thus be expressed in T-scores and, in the 29- to 38-y-old, 39- to 48-y-old, and >48-y-old age groups, averaged −0.63, −1.29, and −1.92, respectively, in men and −0.63, −0.83, and−2.40, respectively, in women. Cognitive performance, body composition, and blood analysis revealed the expected significant effects from sex and age. Conclusion: The large-scale reference database of gCBF measurements constituted from a healthy, well-controlled population enabled age and sex stratification, which showed significant differences between the sexes and a significant decline as a function of age. T-scores were determined and warrant further studies on the prospective identification of early dementia by 133Xe SPECT in elderly individuals.
Dementia affects approximately 5% of the population aged 65 y old or older (1,2). From a recent prospective study with a 5-y follow-up, the annual incidence of dementia was determined to be 1.3%, and the incidence varied with age and sex from 0.23% per year in all men to 6.6% per year in women aged 90 y old or older (3). Alzheimer’s disease (AD) is considered the most common cause of dementia in older people and exacts a substantial cost from society (4).
Normal cognitive decline with aging has been recognized and includes slowing of processing speed and impairment of some aspects of executive functioning, especially working memory (1). These age-related effects need to be differentiated from the cognitive decline present in AD. A neuropsychologic evaluation can contribute to this differential diagnosis during the course of the disease, but optimal management requires an early diagnosis and assessment of dementia. Brain imaging techniques may play a critical role in such an assessment. Numerous authors agree that a high correlation exists between clinically diagnosed AD and reduced cerebral blood flow (CBF) or cerebral glucose metabolism. Recently, Crawford (5) even suggested that reduced CBF may be a required cofactor in the development of AD.
We hypothesized that quantitative assessment of CBF may be valuable for screening individuals for potential degenerative processes. Therefore, we proposed to constitute a normative dataset that could later be used to identify individuals at risk for neurodegenerative processes. We also proposed to describe the risk of abnormal CBF by defining categories based on standardized cutoff scores. For this purpose, we used the T-score, an extension of the z score, which is the most commonly used standardized index in life sciences and expresses each individual’s score relative to the mean and SD of a matched population. In this study, a large-scale reference database of global CBF (gCBF) measurements was constituted from a healthy, well-controlled population stratified by age and sex. On that basis, gCBF standardized values were computed. Furthermore, the assessment of the reference healthy population was optimized by evaluating the cognitive performance of all subjects by means of neuropsychologic testing.
MATERIALS AND METHODS
Subjects
Through advertisement, 203 healthy volunteers were recruited from the Geneva University Hospital and from the local recreational scuba-diving community. All volunteers were informed of the research content and the approval of the ethical committee (Department of Clinical Neurosciences, Geneva University Hospital, Geneva, Switzerland) and gave written informed consent to participate. The protocol included evaluation of medical history, neurologic and neuropsychologic status, body composition (using dual x-ray absorptiometry, bioimpedance, and 40K anthropogammametry analysis (6)); analysis of blood (glucose, high-density lipoprotein [HDL], low-density lipoprotein [LDL], cholesterol, and triglycerides); and measurement of gCBF. Only the 187 volunteers who met the following defined criteria were included in the study: no diagnosis of depression or dementia; no psychiatric disease, neurologic disease, blindness, diabetes, hypertension, vascular disease, arteriosclerosis, or history of decompression illness; no current use of antipsychotic, antidepressant, anticonvulsant, antiparkinsonian, or antidiabetic drugs; and no current use of narcotics, methyldopa, clonidine, acetazolamide (Diamox; Lederle, Zug, Switzerland), Codergocrini Mesilas (Hydergine; Novarta Pharma, Basel, Switzerland), or cognition-enhancing medication.
Neuropsychologic Evaluation
Neuropsychologic testing was performed to gather information on cognitive functioning. The tests assessed the speed and flexibility of information processing, perceptual-motor abilities, spatial discrimination, and memory. The Trail-Making test (TMT) (7) requires speed, visual scanning, and the ability to sequentially connect numeric symbols in a simple task (part A) or more complex alphanumeric symbols in a task that requires flexibility (part B). The time to complete part A (TMTA) and part B (TMTB) was considered in this test. An adaptation of the Thurstone test (8) was used to evaluate spatial discrimination and speed of information processing. Performance is assessed in terms of the number of correct responses (BG9). Two subtests of the Attention Evaluation Battery (9) were selected; the former measures speed of analysis and flexibility processes (F) and the latter evaluates working memory abilities (MT). In both subtests, performance is assessed in terms of both median response time (F_MED and MT_MED) and number of correct items (F_COR and MT_COR). The inclusion condition of the Process Dissociation procedure (S. Adam and M. Van Der Linden, written communication, 2000) was used to evaluate recall from memory and was expressed as number of items correctly recalled (NINC). Finally, the Mill Hill multiple-choice vocabulary scale (10) was used as a measure of semantic knowledge, which was assessed in terms of the number of items correctly discriminated (MHB).
Imaging Technique
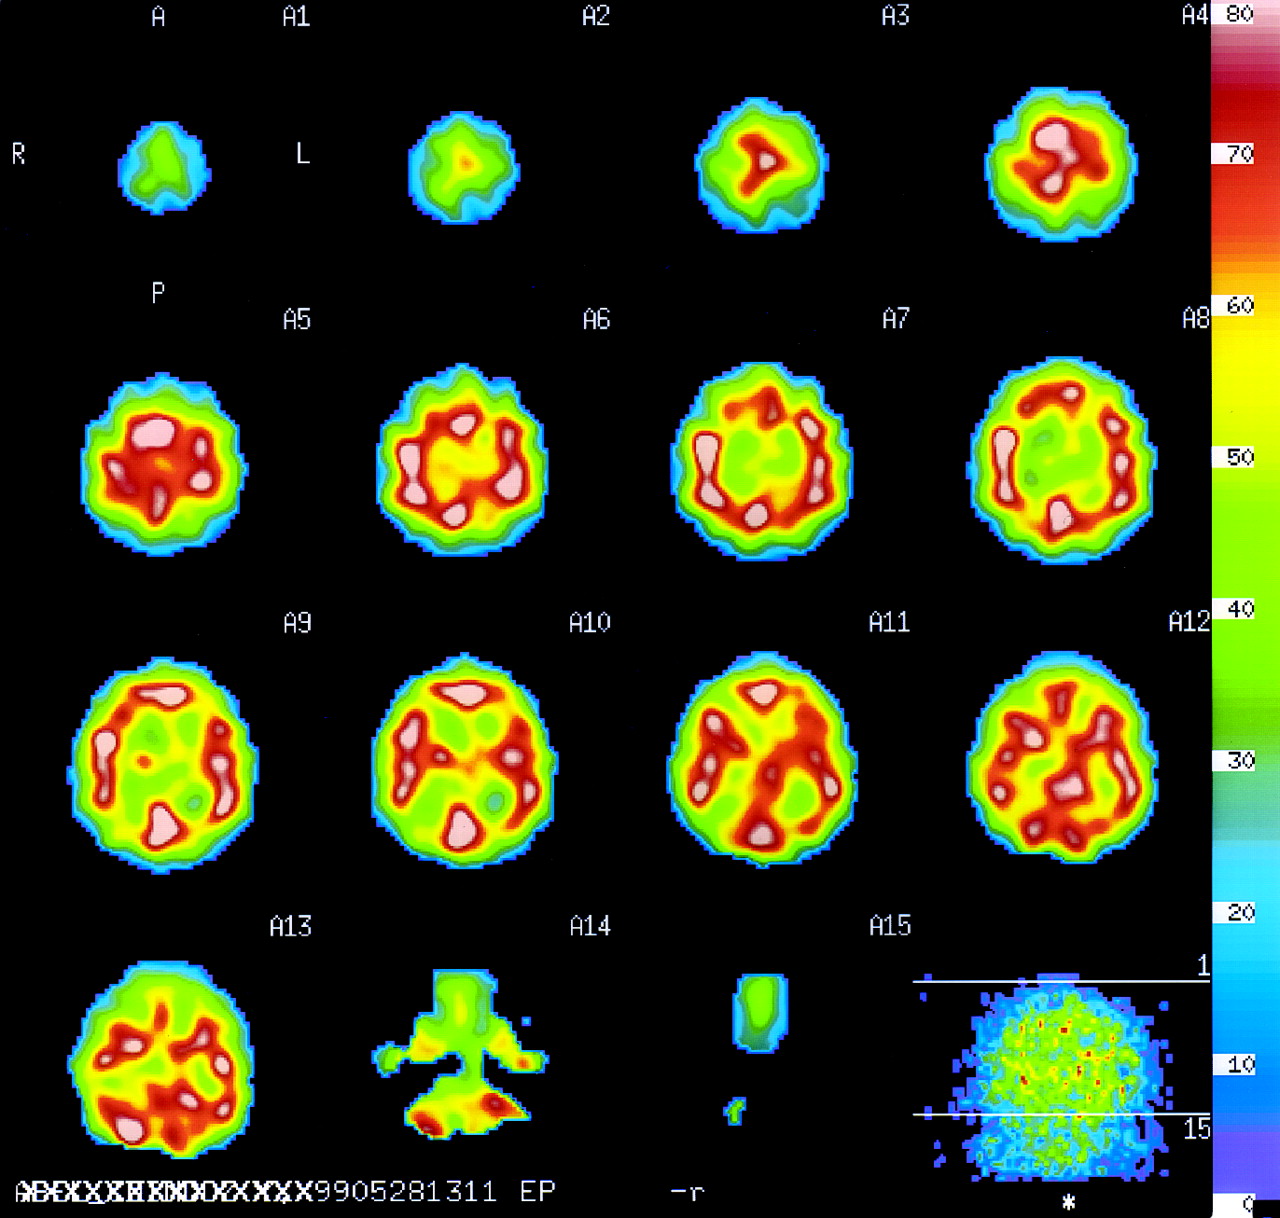
Inhaled-133Xe SPECT was used to measure brain perfusion (11–13). The gas 133Xe was obtained from a commercial source (DuPont Pharma, Winterthur, Switzerland/Heider AG, Winterthur, Switzerland) and was administered to the volunteers using a dispenser system (XAS SM32C; Ceretronix, Randers, Denmark). SPECT was performed using a triple-head CGA-9300 camera (Toshiba, Tokyo, Japan) and dedicated protocols that enabled the simultaneous determination of CBF in all brain regions in a single 10-min acquisition. Parallel-hole, low-energy, superhigh-sensitivity collimation dedicated to xenon dynamic SPECT acquisition was used. The volunteers were in the dorsal decubitus position, with eyes closed and ears plugged, in a quiet room with low ambient light. After 2 min of training to familiarize the volunteers with the inhalation system, they were asked to rest and breath quietly for 11 min. During the first minute, imaging was simultaneous with inhalation of 740 MBq (20 mCi) 133Xe. After diffusion, the remaining 10 min of imaging were dedicated to tracer elimination (washout period). Data were acquired with 360° of rotation, step-and-shoot mode (step angle, 6°; rotation time, 30 s), a 64 × 64 matrix, and a zoom of ×1.5. Images were reconstructed with a prefiltering Butterworth (order 8, with 0.15 cutoff Nyquist frequency) and a ramp filter but without attenuation correction, as recommended by Toshiba. Clearance curves were used to determine the regional CBF in mL/min/100 g of cerebral tissue using the calculation method of Kanno and Lassen (14). Then, the early-picture protocol (Toshiba), consisting of observation of a single picture integrated over the first 2-min interval, was applied. This method was sufficiently reproducible and provided a coefficient of variation of 6.3% (15). Contiguous images were reconstructed in the sagittal, coronal, and transaxial planes from the orbitomeatal line with a slice thickness of 1 pixel (8.5 mm). The voxel size was 8.53 mm. CBF measurements were expressed in terms of gCBF. Representative images are shown in Figure 1.

133Xe SPECT images of healthy volunteer. Results are presented as successive transaxial planes from top to bottom. Brain volume is included in 12 consecutive planes. First plane shows planar orientation (right [R], left [L], anterior [A], and posterior [P]). Last plane shows brain volume of analysis. Pixel values of regional CBF are color coded and express quantitative measurement in mL/min/100 g tissue equivalent.
Statistical Analysis
The reference sample was defined as volunteers 18–28 y old and will be referred to as the young healthy adult (YHA) sample. The remainder of the population was divided into 3 age groups: 29–38 y old, 39–48 y old, and >48 y old.
Using this YHA reference sample, the T-score of each individual was computed as follows:
 where T-sc gCBF is the T-score of a given individual; observed gCBF value is the measure of gCBF for the given individual; mean gCBF YHA is the mean gCBF value of the reference sample (YHA); and SD gCBF YHA is the SD measured in the reference sample (YHA).
Age was chosen as the criterion for grouping the volunteers so that the sensitivity of the T-score in identifying age-related changes could be determined. Body mass index was defined as weight/(height2). Statistical analysis was performed with STATISTICA (StatSoft, Inc., Tulsa, OK) for Windows 2000 (Microsoft, Redmond, WA).
For the overall cohort and for the YHA group, 2-way ANOVA with age (18–28 y old, 29–38 y old, and 39–48 y old) and sex as between-subject factors was first performed on gCBF measurements. The >48-y-old group was not included in those analyses because it contained too few women. Regression analysis was used to assess the relationship between age and gCBF for each sex. Two-way ANOVA with a 3 × 2 design was then performed separately for cognitive performance, anthropometric measurements, and laboratory findings.
RESULTS
Functional Brain Imaging
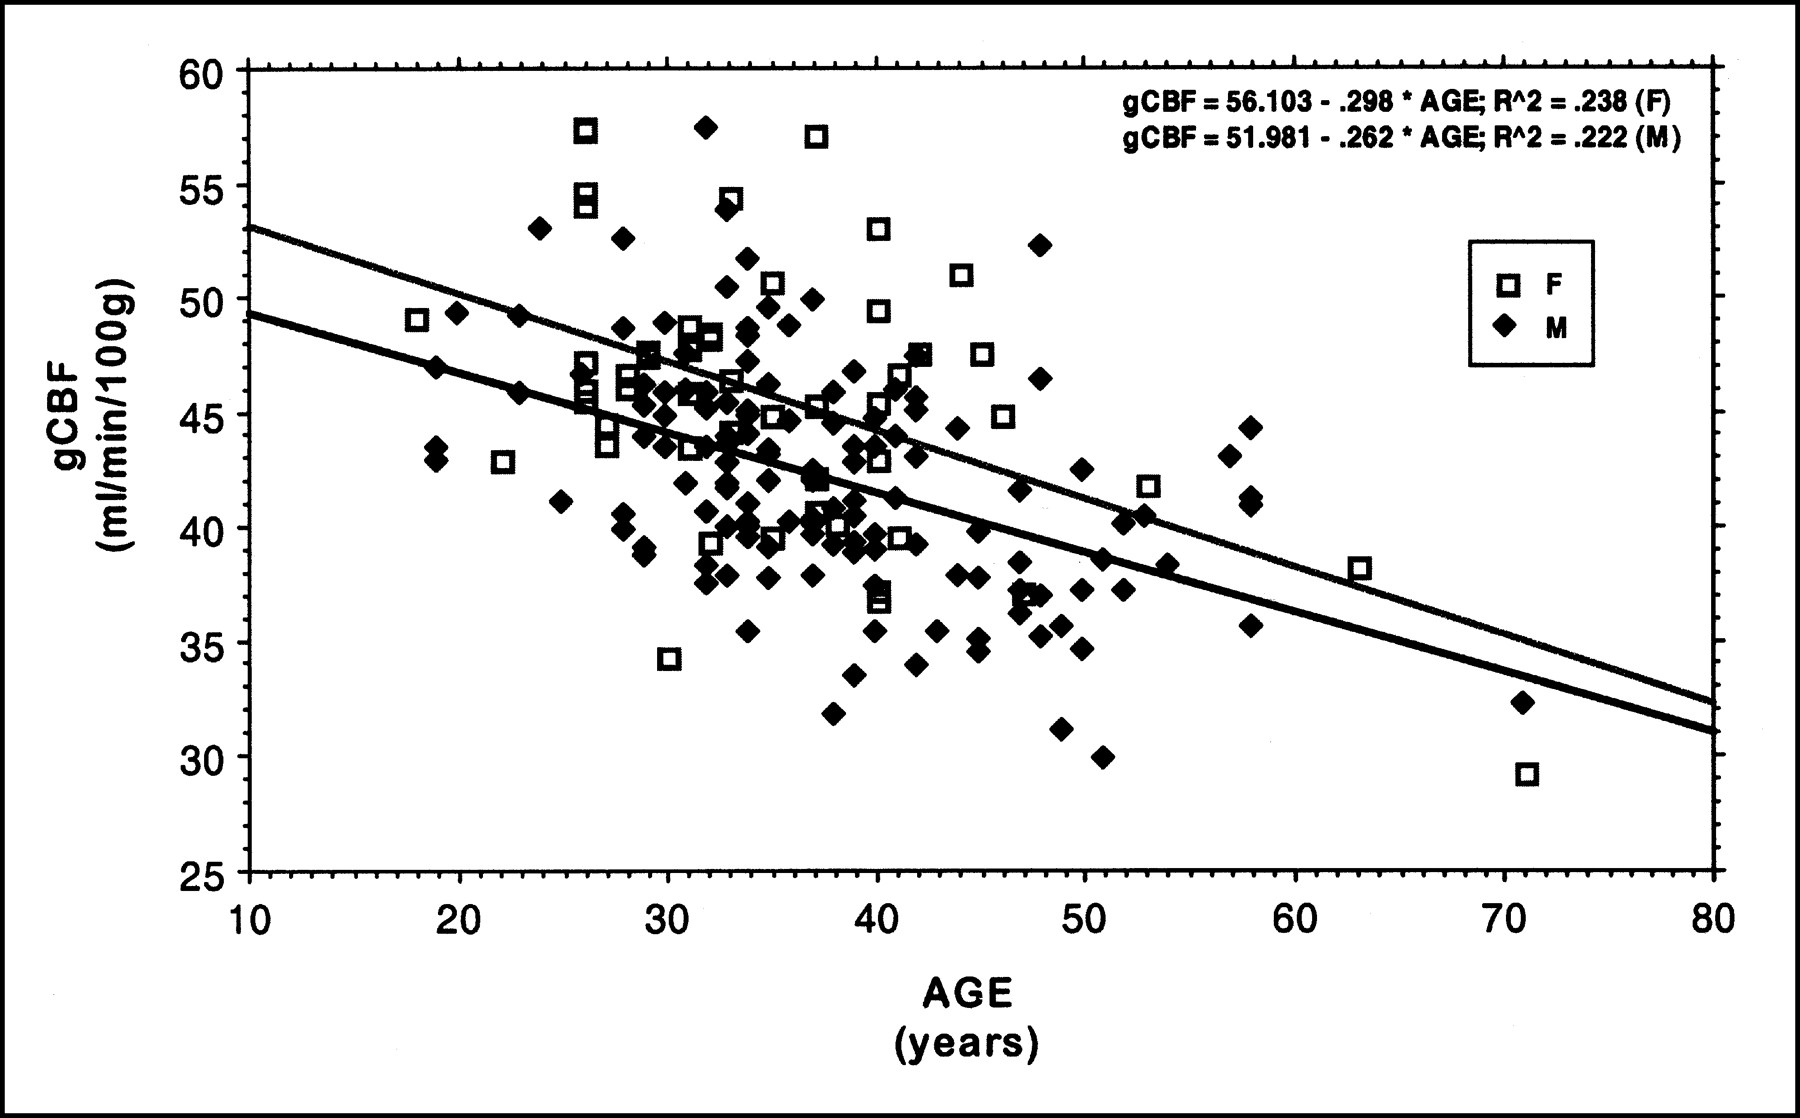
ANOVA analysis using age and sex as between-subject factors and gCBF as a within-subject factor found that age (F2,161 = 12.34, P < 0.001) and sex (F1,161 = 12.69, P < 0.001) had a significant effect. Namely, women showed a higher gCBF (45.6 ± 5.9 mL/min/100 g) than did men (42.2 ± 5.0 mL/min/100 g), and those values were significantly reduced with advancing age. No age × sex interaction was found. Moreover, as displayed in Figure 2, a significant linear reduction as a function of age was observed for both sexes (for men, R2 = 0.222, P < 0.001; for women, R2 = 0.238, P < 0.001). When age groups were considered, the age-dependent decrease in gCBF remained (Table 1) and could be expressed in T-scores. In the 29- to 38-y-old, 39- to 48-y-old, and >48-y-old age groups, the T-scores averaged −0.63, −1.29, and −1.92, respectively, in men and −0.63, −0.83, and−2.40, respectively, in women.

Linear regression of gCBF as function of age for men (M) and women (F), separately.
Determination of gCBF Measurements per Group of Age and Sex
The box plot of sex-adjusted T-scores in Figure 3 shows the regular decline in gCBF as a function of age and enabled us to hypothesize that with a cutoff value of −3.5 for the T-score, we would obtain a relative frequency of 4.5% for abnormality in the >48-y-old group (containing individuals from 50 to 71 y old). This frequency corresponds to the prevalence of dementia in the general population. Nevertheless, when the YHA group was considered, sex or age had no significant effect on gCBF.

Box plot graph of T-score (T-SC) adjusted for sex as function of age.
Cognitive Performance
ANOVA using age and sex as between-subject factors and cognitive performance as a within-subject factor found significant effects mainly from age and more selectively from sex. In other words, older subjects were slower in their reaction times on MT_MED (F2,161 = 3.9, P < 0.05), F_MED (F2,161 = 8.2, P < 0.001), TMTA (F2,161 = 6.7, P < 0.005), and TMTB (F2,161 = 3.44, P < 0.05). Nevertheless, older subjects performed less accurately on MT_COR (F2,161 = 6.9, P < 0.005) but not on F_COR. Both significant main effects of age and sex were identified on BG9 (for age, F2,161 = 6.6, P < 0.005; for sex, F1,161 = 5.8, P < 0.05), which showed reduced performance both for men and for older groups. One interaction was found with main effects of age and sex on NINC (F2,158 = 4.4, P < 0.05), which showed decreased scores for men with advancing age. No significant effects were found on educational level and semantic knowledge (MHB), suggesting that the observed differences could not be explained by confounding effects of education and vocabulary. Mean values and SDs for cognitive performance are presented in Table 2.
Cognitive Performance of Cohort Included in Age × Sex ANOVA
Physical Characteristics and Laboratory Findings
Mean values and SDs are presented in Tables 3 (physical characteristics) and 4 (laboratory findings). ANOVA using age and sex as between-subject factors and physical characteristics as a within-subject factor found the effects of sex on weight (F1,160 = 101.5, P < 0.001), height (F1,160 = 104.1, P < 0.001), and body mass index (F1,160 = 25.5, P < 0.001) to be significant. Significant main effects of both age and sex were observed on lean mass (for age, F2,158 = 3.1, P < 0.05; for sex, F1,158 = 334.7, P < 0.001) and percentage of fat (for age, F2,158 = 3.2, P < 0.05; for sex, F1,158 = 64.6, P < 0.001). No significant effects were found on fat mass. In contrast, ANOVA performed on laboratory findings showed significant main effects of age on glucose (F2,158 = 5.2, P < 0.01), cholesterol (F2,158 = 8.3, P < 0.001), and LDL (F2,158 = 9.1, P < 0.001). A significant main effect of sex was observed on HDL (F1,158 = 62.8, P < 0.001). No significant effects on triglycerides were found. Table 5 presents the overall data for the YHA group used to define the T-score. These values are unremarkable or within reference ranges. Furthermore, body composition and, in particular, percentage of body fat mass had no significant impact on gCBF when adjusted for age.
Physical Characteristics of Cohort Included in Age × Sex ANOVA
Laboratory Findings of Cohort Included in Age × Sex ANOVA
Cognitive Performance, Physical Characteristics, and Laboratory Findings of YHA Cohort
DISCUSSION
SPECT functional brain imaging is now recognized as a powerful clinical and research tool because of its modern instrumentation enabling, in particular, quantitative measurement of CBF with 133Xe (13). The importance of our study rests on the careful and extensive screening of a large sample to define a healthy population for each sex, the determination of T-scores for each sex as a possible clinical parameter to assess neurodegenerative diseases, and the comparison of neuropsychologic performances using an extensive battery of tests.
For more than 20 y, many studies have been performed to assess variations in CBF, the cerebral metabolic rate of glucose (CMRglu), or oxygen use with age. Unfortunately, although an age-related decline has been documented by some authors (16–30), others have found no such decline (30–36). Suboptimal technology that could not measure global brain activity may partially explain the negative results noted in the publications of the late 1970s and early 1980s. In more recent studies that did not show a decline in gCBF or CMRglu with age, the mode of subject selection, the pooling of sex in the analysis, and the limited number of subjects should be underlined. Kushner et al. (33) investigated 13 young and 17 elderly (aged 47–73 y) healthy volunteers with FDG PET. Tempel and Perlmutter (35) measured gCBF with H215O in 26 subjects aged 20–72 y. Similarly, Swartz et al. (36) observed in their cohort of 32 women and 15 men not only no age-related decline in gCBF as measured by 133Xe SPECT but also no difference between the sexes. On the contrary, Yoshii et al. (26) found, with 18F-FDG PET, that global CMRglu declined as a function of age and was higher in women than in men. The percentage of difference between the sexes in young adults was 0.8%, which compares favorably with the 1% observed in our YHA population, considering that the authors defined young adults as individuals < 50 y old. With 133Xe SPECT, Devous et al. (25) not only observed an age-related decline in CBF but also showed that CBF was higher in women of all ages. For the assessment of CBF, 133Xe was chosen because it remains the most accurate way to perform quantitative measurements with SPECT, it does not require blood sampling, it does not rely on intermediate biologic processes (37,38), and it is not associated with non–flow-dependent focal retention (39), as are the technetium-labeled compounds ethylcysteinate dimer or hexamethylpropyleneamine oxime. The contradictory observations and negative results of these studies may also stem from a small sample size and a wide age range. Because of our large population, our results strongly support an age-related decline in gCBF and a sex-related difference in gCBF, as suggested previously.
Age-related and sex differences have been studied for many years in the psychologic literature. Although effects related to age are well documented, less consistent results have been obtained for the identification of sex differences. Speed of processing, executive functioning, and some aspects of memory are well known to be reduced in aging. Sex differences are often discussed in the literature in terms of better processing of verbal information in women and visuospatial information in men. We therefore expected age and sex to affect those variables. In our study, expected age reductions were observed for variables measuring effortful recall from memory (NINC) and working memory (MT_MED, MT_COR), speed of processing (TMTA, BG9), and flexibility (TMTB, F_MED), which could be identified as a crucial component in executive functioning. Sex differences were more controversial. Better performance for women was found in speed of processing but also in recall from memory with advancing age (NINC). The fact that the latter test requires processing of verbal information could explain the observed advantage. In contradiction to the expected results, no clear information could be identified in disfavor of women, particularly in visuospatial processing.
In one study, CBF and CMRglu were observed to increase as children grew older, with a peak in activity at approximately the age of 6–9 y (40). Then, after a slight decline that might not be statistically significant because of the small sample, the peak was followed by a plateau in young adults and then by a regular decline with aging. We hypothesized that neurodegenerative diseases could be screened using a normative dataset, with cutoffs defined in terms of standardized cutoff scores to a reference group. The relationship between a low CBF or CMRglu value and the presence of dementia has already been established, but there is still no defined classification for the subject investigated. The determination of a T-score for gCBF measurement may therefore become important for further investigating the ability of CBF to assess the risk of dementia. The T-score represents a young adult z score and is expressed as SDs dependent on a specified value for a parameter as measured for a young adult healthy reference group. The advantage of the T-score is that it is independent of measurement units and can be used across different instruments if their reference parameters are derived from the same group of healthy volunteers. Thus, further studies are needed for 2 reasons: first, to determine regional CBF T-scores in the YHA population so that the relationship between psychometric performances and rCBF can be studied and, second, to validate gCBF as a screening criterion for the early diagnosis of dementia.
CONCLUSION
The large-scale reference database of gCBF measurements constituted from a healthy, well-controlled population enabled an age and sex stratification that showed a significant difference between the sexes and a significant decline as a function of age. T-scores were determined and warrant further studies on the prospective identification of early dementia by 133Xe SPECT in elderly individuals.
Acknowledgments
The authors thank Mohamed Allaoua, Luc Terraneo, Yannick Sermet, and Christina Laemmli for their contribution to data collection, image processing, and clinical interpretation. This study was supported by the Gustave Prevot Foundation.
Footnotes
Received Oct. 28, 2000; revision accepted Feb. 15, 2001.
For correspondence or reprints contact: Daniel Olivier Slosman, MD, Division of Nuclear Medicine, Geneva University Hospital, 1211 Geneva 14 Switzerland.
REFERENCES
In this issue


Jump to section
Related Articles
Cited By...
- Accuracy of Parenchymal Cerebral Blood Flow Measurements Using Pseudocontinuous Arterial Spin-Labeling in Healthy Volunteers
- Brain-Derived Neurotrophic Factor Val66Met Polymorphism Affects Resting Regional Cerebral Blood Flow and Functional Connectivity Differentially in Women Versus Men
- Negative neurofunctional effects of frequency, depth and environment in recreational scuba diving: the Geneva "memory dive" study