


Abstract
We evaluated the accuracy of PET/CT with 68Ga-PSMA-HBED-CC—a 68Ga-conjugated ligand of human prostate-specific membrane antigen (PSMA)—to localize cancer in the prostate and surrounding tissue at initial diagnosis. Methods: Twenty-one patients with biopsy-proven prostate cancer underwent 68Ga-PSMA-HBED-CC (68Ga-PSMA) PET/CT at a median of 4 d (range, 0–47 d) before radical prostatectomy. Based on a 6-segment model, the Gleason score and proportion of tumor tissue within each segment (segmental tumor burden, or STB) as determined by histopathology (STBHP) were correlated with SUVmax and STB as determined by different SUV cutoffs for 68Ga-PSMA PET (STBPET1–6). Furthermore, the involvement of seminal vesicles and other extracapsular extension were assessed by histopathology and PET/CT. Results: Histopathology-positive segments (n = 100 of 126; 79%) demonstrated a significantly higher mean ± SD SUVmax (11.8 ± 7.6) than histopathology-negative segments (4.9 ± 2.9; P < 0.001). Receiver-operating-characteristic analysis revealed an optimal SUVmax cutoff of 6.5 for discrimination of histopathology-positive segments from histopathology-negative segments (area under the curve, 0.84; P < 0.001), which gave 67% sensitivity, 92% specificity, a 97% positive predictive value, a 42% negative predictive value, and 72% accuracy. STBPET3 as determined by (2 × blood SUV) + (2 × SD) correlated best with STBHP (Pearson ρ = 0.68; P < 0.001; mean difference ± SD, 19% ± 15%). PET/CT correctly detected invasion of seminal vesicles (n = 11 of 21 patients; 52%) with 86% accuracy and tumor spread through the capsule (n = 12; 57%) with 71% accuracy. Conclusion: 68Ga-PSMA PET/CT accurately detected the location and extent of primary prostate cancer. Our preliminary findings warrant further investigation of 68Ga-PSMA PET/CT in conjunction with needle biopsy.
At diagnosis of prostate cancer, patient risk is determined by several factors, including plasma levels of prostate-specific antigen (PSA), Gleason score (GS), and the diagnostic tumor extent. Various imaging techniques are used for local staging and biopsy guidance. Multiparametric MRI shows promising results for localizing prostate cancer and improves the accuracy of ultrasound-guided biopsy (1,2). Despite important advances such as standardized reporting, considerable interobserver variability remains a major drawback for MRI (3), resulting in the overall heterogeneous accuracy reported in the literature (4). PET/CT with radiolabeled choline analogs is widely used in clinical practice for prostate cancer staging. In a prospective study, 18F-fluoroethylcholine PET demonstrated higher accuracy than MRI for the detection of primary prostate cancer; however, specificity was limited by choline uptake in benign lesions (5). PET with ligands for the prostate-specific membrane antigen (PSMA) might overcome this limitation. Indeed, PET with 68Ga-PSMA-HBED-CC—a radioconjugate composed of a PSMA-targeting ligand, Glu-urea-Lys(Ahx), conjugated to 68Ga via the acyclic radiometal chelator N,N′-bis[2-hydroxy-5-(carboxyethyl)benzyl]ethylenediamine-N,N′-diacetic acid (HBED-CC)—demonstrated superior tumor-to-background signal intensity and substantially higher detection rates than has been reported for other imaging modalities in patients with recurrent prostate cancer (6,7). However, the potential of 68Ga-PSMA-HBED-CC (68Ga-PSMA) PET/CT for detection of primary disease has not yet been systematically evaluated. On the basis of the present literature, we hypothesized that 68Ga-PSMA PET/CT accurately localizes primary tumor lesions in the prostate at initial diagnosis. We tested this hypothesis by comparing 68Ga-PSMA PET/CT findings for intraglandular cancer at initial diagnosis with results from histologic staging after prostatectomy.
MATERIALS AND METHODS
Patients
Between January 2014 and April 2015, 21 consecutive patients with a diagnosis of prostate adenocarcinoma by needle biopsy underwent 68Ga-PSMA PET/CT at our university clinic for staging before radical prostatectomy. As defined in our prospective clinical protocol, preoperative PET/CT was performed on patients with a PSA level higher than 20 ng/mL (n = 12), a biopsy GS of 7 or higher (n = 17), bone pain (n = 3), or a combination of these risk factors (n = 10). The 68Ga-PSMA PET/CT took place less than 50 d before radical prostatectomy in all cases. The exclusion criteria were any local or systemic treatment for prostate cancer before radical prostatectomy, and needle biopsy less than 7 d before 68Ga-PSMA PET/CT. The protocol was approved by the local ethics committee, and all patients gave written informed consent for entry into this retrospective analysis, including consent to the publication of their case details.
68Ga-PSMA Ligand and PET/CT Imaging
PSMA-HBED-CC was labeled with 68Ga3+ obtained from a 68Ge/68Ga generator system (GalliaPharm; Eckert & Ziegler AG) using an automated synthesis module (GRP; Scintomics GmbH) and prepacked cassettes (ABX GmbH) as described by Weineisen et al. (8). Whole-body 68Ga-PSMA PET/CT emission images were acquired using a Biograph 64 TruePoint PET/CT scanner (n = 14; 67%; Siemens Medical Solutions) or a Discovery 690 (n = 7; 33%; GE Healthcare). Emission recordings were initiated at a mean ± SD of 58 ± 12 min (range, 45–80 min) after almost simultaneous intravenous administration of 68Ga-PSMA along with 20 mg of furosemide. The patients received a mean of 192 ± 48 MBq of 68Ga-PSMA (range, 104–276 MBq). Diagnostic CT scans (100–190 mAs, depending on the scanned organ region; 120 kV) were acquired with intravenous injection of an iodine-containing contrast agent (Imeron 300, 2.5 mL/s; Bracco) at a dose adjusted for body weight. An attenuation map derived from contrast-enhanced diagnostic CT was used for PET correction. PET images were reconstructed with a slice thickness of 5 mm along the z-axis, as a 168 × 168 matrix in the axial plane based on the TrueX algorithm (3 iterations, 21 subsets; Biograph 64) or as a 256 × 256 matrix based on the VPFX algorithm (2 iterations, 36 subsets; Discovery 690). To allow valid pooling of the results from 2 PET/CT instruments, phantom studies based on the NEMA NU2-2001 standard were conducted, and SUV conversion factors were calculated (Supplemental Fig. 1) (9). PSA level was measured in serum samples obtained from each patient on the day of the PET/CT scan.
Prostate Segments
Spatial correspondence was achieved using apex-to-base z-coordinates both for histopathology and for PET/CT analysis: slices 5 mm thick from both the apex and the base were discarded, and the remaining z-length was divided into 3 macroscopic slices of equal thickness (mean z-axis thickness per segment, 1.1 ± 0.3 cm; range, 0.6–1.8 cm). The central plane of each of the 3 slices was evaluated separately as subregions to the left and right of the urethra, so as to obtain a total of 6 segments (Supplemental Fig. 2). Diagnostic CT provided accurate z-coordinates and was used to locate prostate segments for PET analysis.
Histopathology
All patients underwent radical prostatectomy with resection of the seminal vesicles. Surgical specimens were reviewed for GS and proportion of tumor tissue within each segment (segmental tumor burden, or STB) as determined by histopathology (STBHP) in each of the 6 prostate segments. Grading was performed according to the International Society of Urological Pathology 2005 modified GS system (10). STBHP was estimated using a previously described point count method (11) that was adapted to our 6-segment model. Extracapsular extension of the tumor was diagnosed when cancer cells were detected in direct contact with adipocytes, within the perineural spaces of the neurovascular bundles, or within a desmoplastic stroma protruding outside the contours of the prostate. Seminal vesicle invasion was defined as infiltration by tumor cells into the muscular wall of the seminal vesicle. This histologic evaluation was performed by a pathologist specialized in uropathology, who was masked to the PET/CT data. To validate PSMA expression (positive or negative), ex vivo prostate samples from 2 patients were examined by immunohistochemistry using antibodies reacting with PSMA (anti-PSMA clone 3E6, 1:100; DAKO) as previously described (12). All slides were counterstained with hematoxylin (Vector Laboratories).
Image Analysis
The voxelwise SUVmax and SUVmean were automatically measured for each segment. A reference SUV was determined in liver, blood, and parotid glands on the basis of the following respective definitions: mean SUV in a 3-cm-diameter spheric volume of interest placed in the center of the right hepatic lobe (SUVliver) and in a 1-cm-diameter spheric volume of interest in the descending thoracic aorta, in accordance with PERCIST (13), and mean SUV in 1-cm-diameter spheric volumes of interest placed in the center of the right and left parotid glands. For tumor delineation, SUV cutoffs were calculated from the following empiric formulae: liver SUV + 2 × SD as defined by PERCIST, liver SUV, (2 × blood SUV) + (2 × SD), (2 × blood SUV) + (4 × SD), parotid SUV/2, and parotid SUV/3. Six regions of interest based on these cutoffs were automatically drawn within each segment.
Tumor cross-sectional areas as determined by the 6 SUV cutoffs defined above, as well as the area of the entire segment as determined on axial CT images, were recorded in cubic centimeters. The STB for the 6 SUV cutoffs (STBPET1–6) was calculated as a percentage by dividing the cross-sectional area of the tumor by the area of the entire segment. SUV measurements and automatic region-of-interest delineations were performed together by two of the authors, using image fusion software (Hybrid Viewer 2.0; Hermes Medical Solutions). Visual analysis of the involvement of seminal vesicles or surrounding soft tissue, as defined by the presence of focal 68Ga-PSMA uptake exceeding uptake in the ipsilateral obturator internus muscle (Supplemental Fig. 3), was performed together by two of the authors, who have more than 10 y of combined experience in the interpretation of PET/CT scans for tumor staging. The interpreters were masked to the results from histopathology and the clinical data.
Statistical Analysis
Results are presented as number and percentage, mean ± SD, or median and range. Mann–Whitney testing was used for unpaired comparisons between subgroups. Area under the receiver-operating-characteristic curve, 95% confidence interval, and corresponding P values were calculated for prediction of histopathology-positive disease. The optimal cutoff was defined by the Youden index. Performance was calculated using the optimal cutoff as determined by receiver-operating-characteristic analysis. Normal distribution of continuous variables was confirmed by Kolmogorov–Smirnov testing, and correlation was assessed using Pearson testing. Significance was set at a P level of 0.05. The SPSS software package (version 15.0; IBM) was used for statistical analyses.
RESULTS
Characteristics of Study Cohort
68Ga-PSMA PET/CT was performed at a median of 4 d (range, 0–47 d) before radical prostatectomy. Patient characteristics, including the National Comprehensive Cancer Network risk group, are presented in Supplemental Table 1. The postoperative GS was 6 in 3 patients (14%), 7 in 8 patients (38%), 8 in 3 patients (14%), and 9 in 7 patients (33%).
Accuracy for Detection of Positive Segments
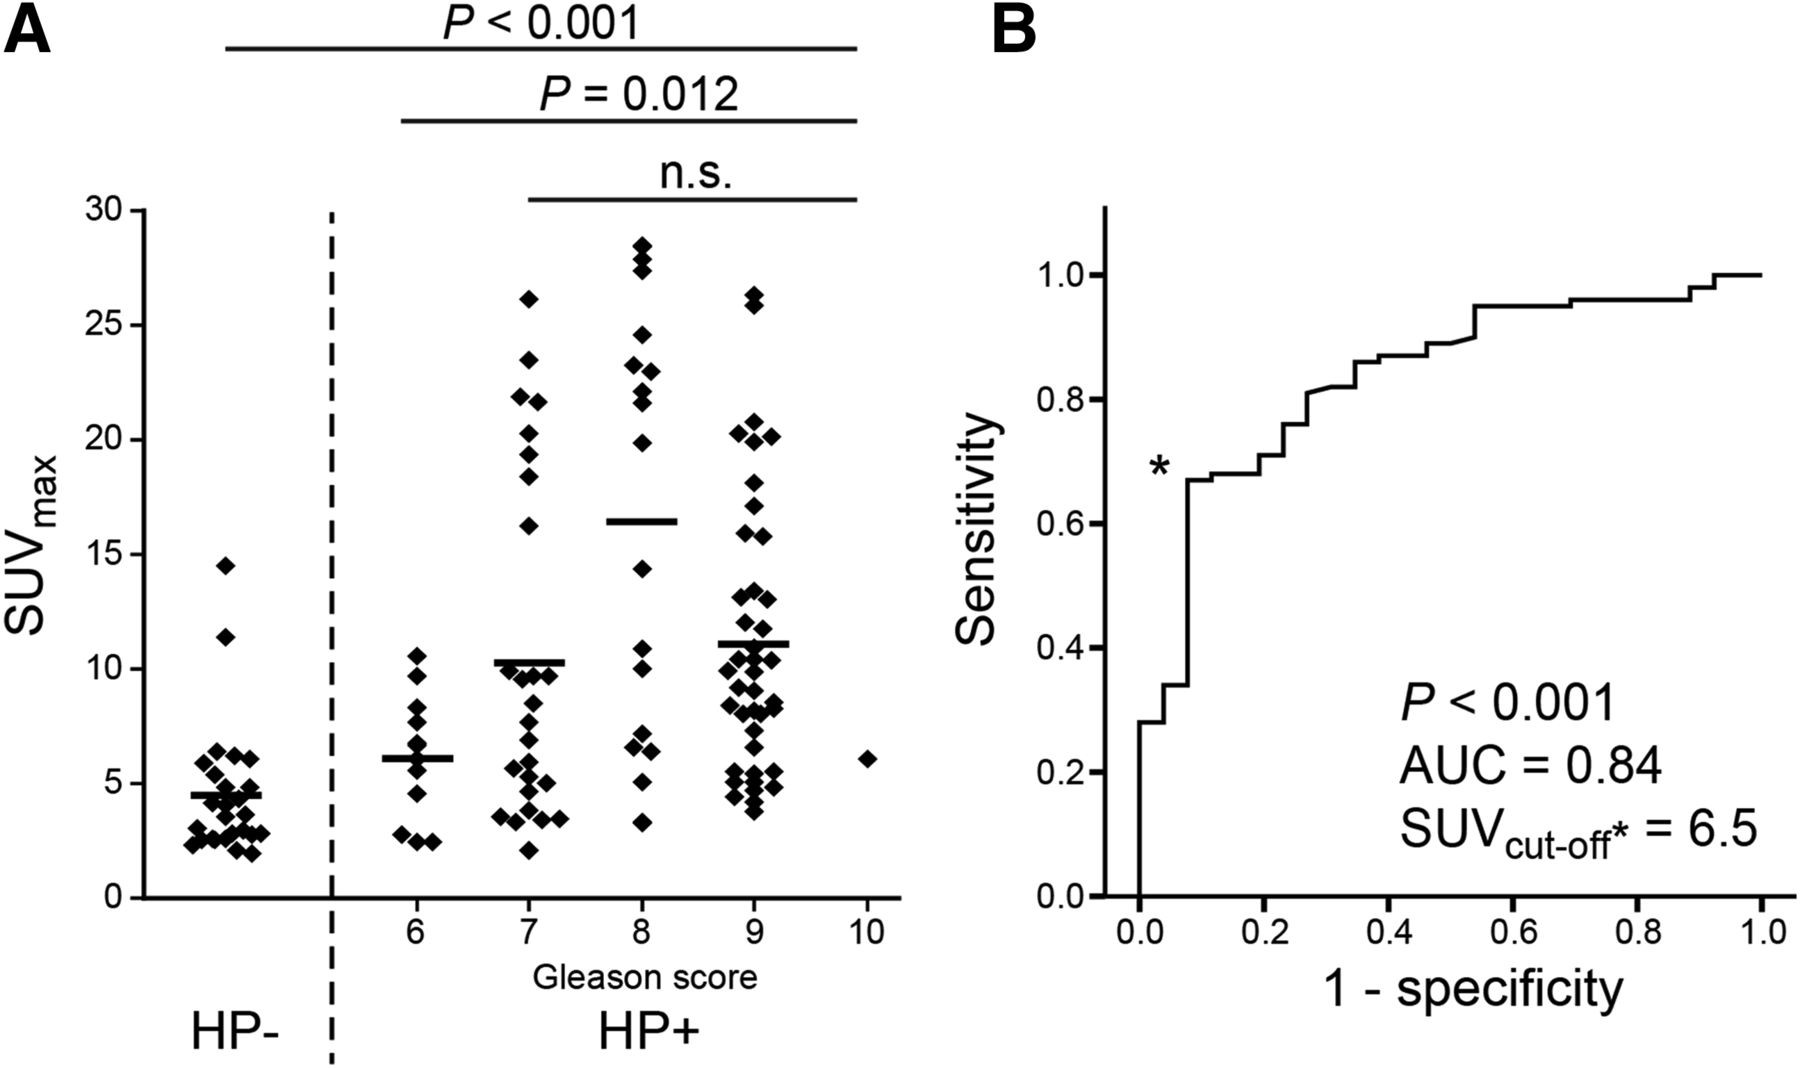
For nondiseased segments, the mean SUVmean was 2.2 ± 0.8, and the mean SUVmax was 4.9 ± 2.9. Histopathology-positive segments demonstrated a significantly higher average SUVmax (11.8 ± 7.6, P < 0.001; Fig. 1A). Patient-based mean tumor–to–nondiseased prostate SUV ratio (SUVmax and SUVmean) was 3.3, and mean tumor-to-blood SUV ratio was 10.0. Histopathology-positive segments with a GS of 6 had a significantly lower SUVmax (6.1 ± 2.7 vs. 12.0 ± 7.6, P = 0.012; Fig. 1A) and tumor-to-blood SUV ratio (4.2 vs. 8.2, P = 0.013) than did segments with a GS of 7 or more, although there was no significant difference in SUVmax between segments with a GS of 7 or more (each P > 0.05). The area under the curve for discrimination of high risk (GS ≥ 7) from low risk (GS < 7) segments was 0.81 (optimal SUVmax cutoff, 6.8). Receiver-operating-characteristic analysis revealed an area under the curve of 0.84 and an optimal SUVmax cutoff of 6.5 for the discrimination of histopathology-positive from -negative segments. With this cutoff, 68Ga-PSMA PET demonstrated 67% sensitivity, 92% specificity, a 97% positive predictive value, a 42% negative predictive value, and 72% accuracy for discrimination of histopathology-positive from -negative segments (Table 1). Thirty-three of 100 segments with histopathology-proven disease were PET-negative. False-negative results were found in 6 of 12 segments with a GS of 6 (50%), 12 of 27 segments with a GS of 7 (44%), 4 of 19 segments with a GS of 8 (21%), 10 of 41 segments with a GS of 9 (24%), and the one segment with a GS of 10. Mean STBHP was 31% ± 32% in PET false-negative segments versus 57% ± 31% in PET true-positive segments. Twenty-two of 33 PET false-negative segments (67%) had an STBHP of no more than 25%, as compared with 17 of 67 PET true-positive segments (25%). In one patient, the PET false-negative result was confirmed by PSMA immunohistochemistry for prostate cancer with partial neuroendocrine differentiation (Fig. 2). In one patient with a GS-7 tumor of the apex region, both basal segments were PET/CT false-positive, most likely because of urine activity and misalignment.

SUVmax for histopathology-positive (HP+) or -negative (HP−) segments. (A) HP+ segments were further categorized by GS. Single values are given for each segment (n = 126); mean for each category is shown by bars. Results from Mann–Whitney test are given (*P < 0.05). (B) SUVmax was tested for accuracy in discrimination of HP+ from HP− segments. Receiver-operating-characteristic curve, area under curve (AUC), and optimal SUVmax cutoff as determined by Youden index are given.
Accuracy of 68Ga-PSMA PET for Detection of Tumor Tissue per Segment
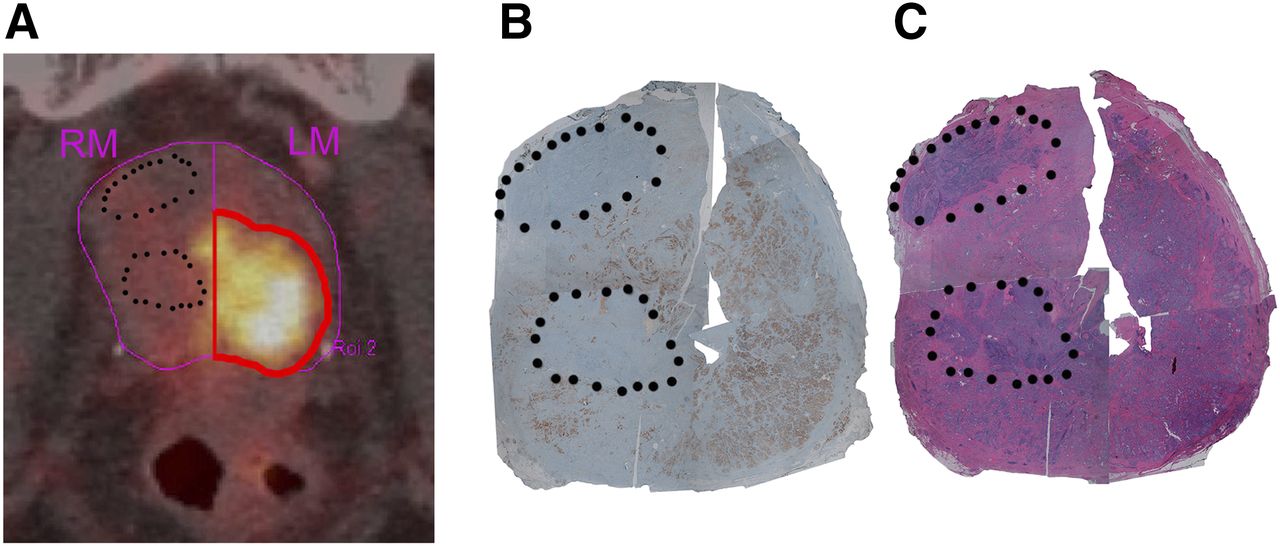
False-negative PET finding for acinar adenocarcinoma with partial neuroendocrine differentiation. 68Ga-PSMA PET/CT image (A), PSMA-stained slice (B), and hematoxylin-stained slice (C) for left mid (LM) and right mid (RM) segments are shown. PET SUVmax was 9.9 (true-positive) in LM segment. Tumor tissue with neuroendocrine differentiation and strong expression of neuroendocrine markers (chromogranin A, CD56; not shown) is delineated by black dots in RM segment. SUVmax was 5.5 (false-negative) in RM segment based on absence of PSMA expression in neuroendocrine prostate cancer lesions. STBPET3 (SUV ≥ 3.6) was 55% in LM segment (histopathology, 100%) and is delineated by red line.
Accuracy for Prediction of Segmental Tumor Burden
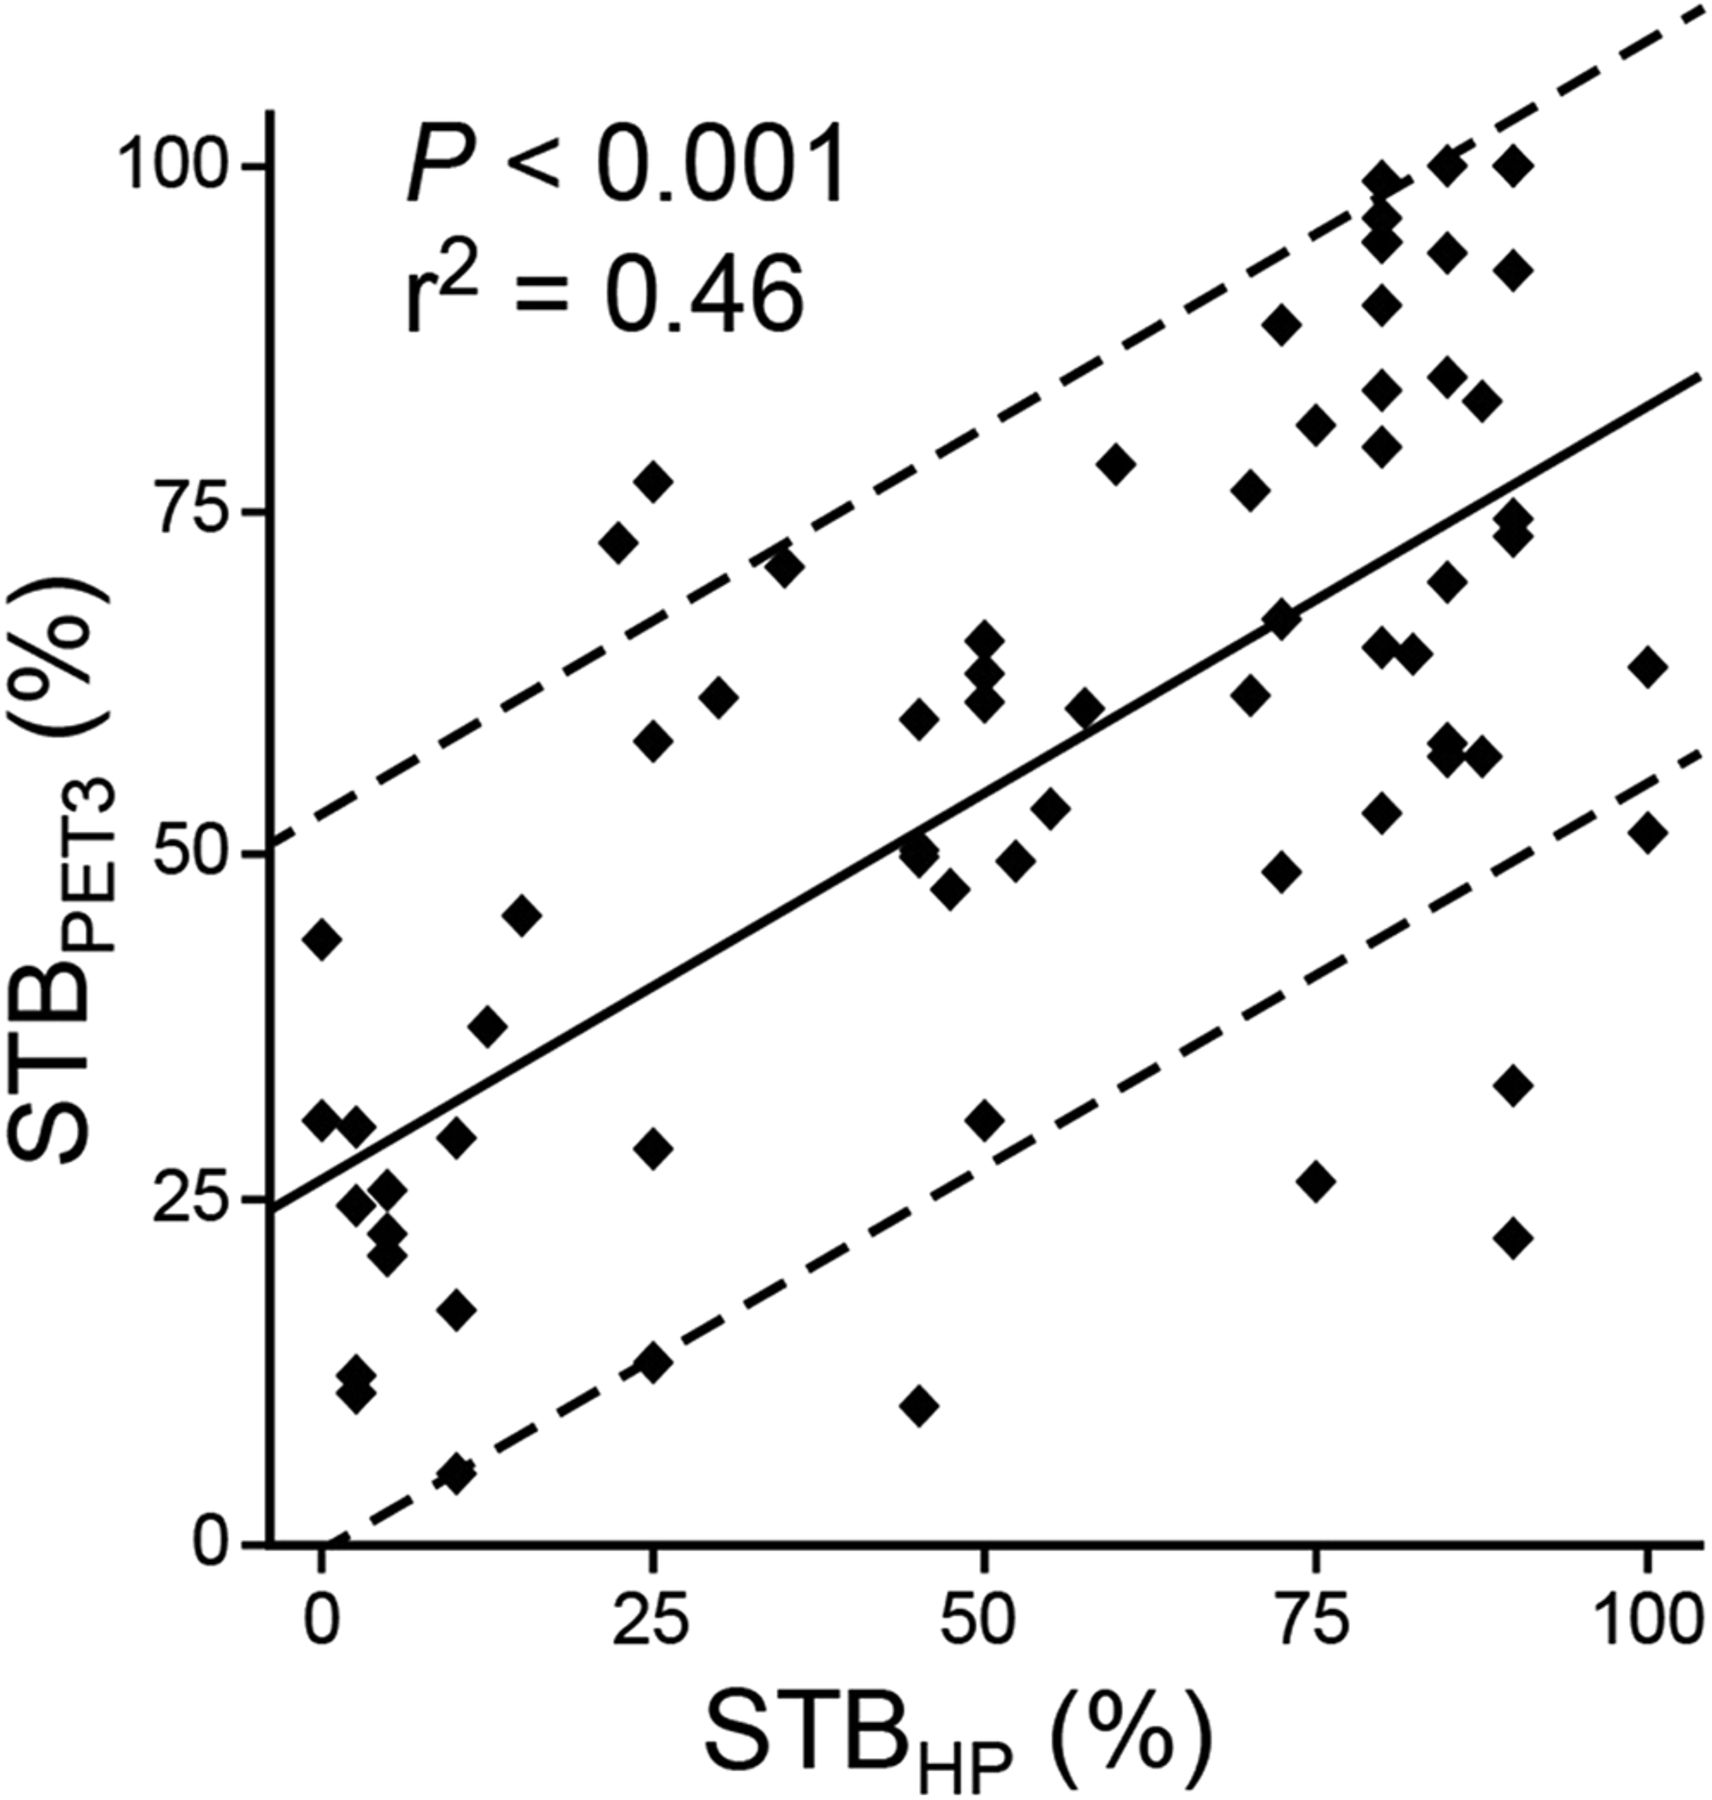
Several reference-based SUV cutoffs were applied to predict true STB (STBHP) in diseased segments (Table 2). Of the 6 algorithms, the STB delineated by an SUV exceeding (2 × blood SUV) + (2 × SD) (STBPET3) demonstrated the strongest correlation with STBHP (Pearson ρ = 0.68; P < 0.001). STBPET3 had a mean bias of 19% ± 15% relative to STBHP. Figure 3 shows a scatterplot of this correlation, including the resultant linear regression (±SD).
Correlation Between STBHP and STBPET1–6 in PET-Positive Segments (n = 69)

Scatterplot for STB in PET-positive segments as determined by STBPET3 and STBHP. STBPET3 is based on (2 × blood SUV) + (2 × SD cutoff). Regression line (±SD) and results from Pearson test are given. n = 69.
Accuracy on a Per-Patient Basis
The SUVmax of the entire prostate did not correlate with overall postsurgical GS (P = 0.48) but was significantly associated with individual PSA levels at the time of scanning (P = 0.028). On the basis of the optimal SUVmax cutoff defined above (6.5), 19 of 21 patients (90%) were overall PET-positive (Fig. 4). In 11 of the 19 PET-positive patients (58%), the location of the segment with the highest STB was concordant between STBPET3 and STBHP. In 8 of 19 PET-positive patients (42%), the location was discordant (STB mismatch).
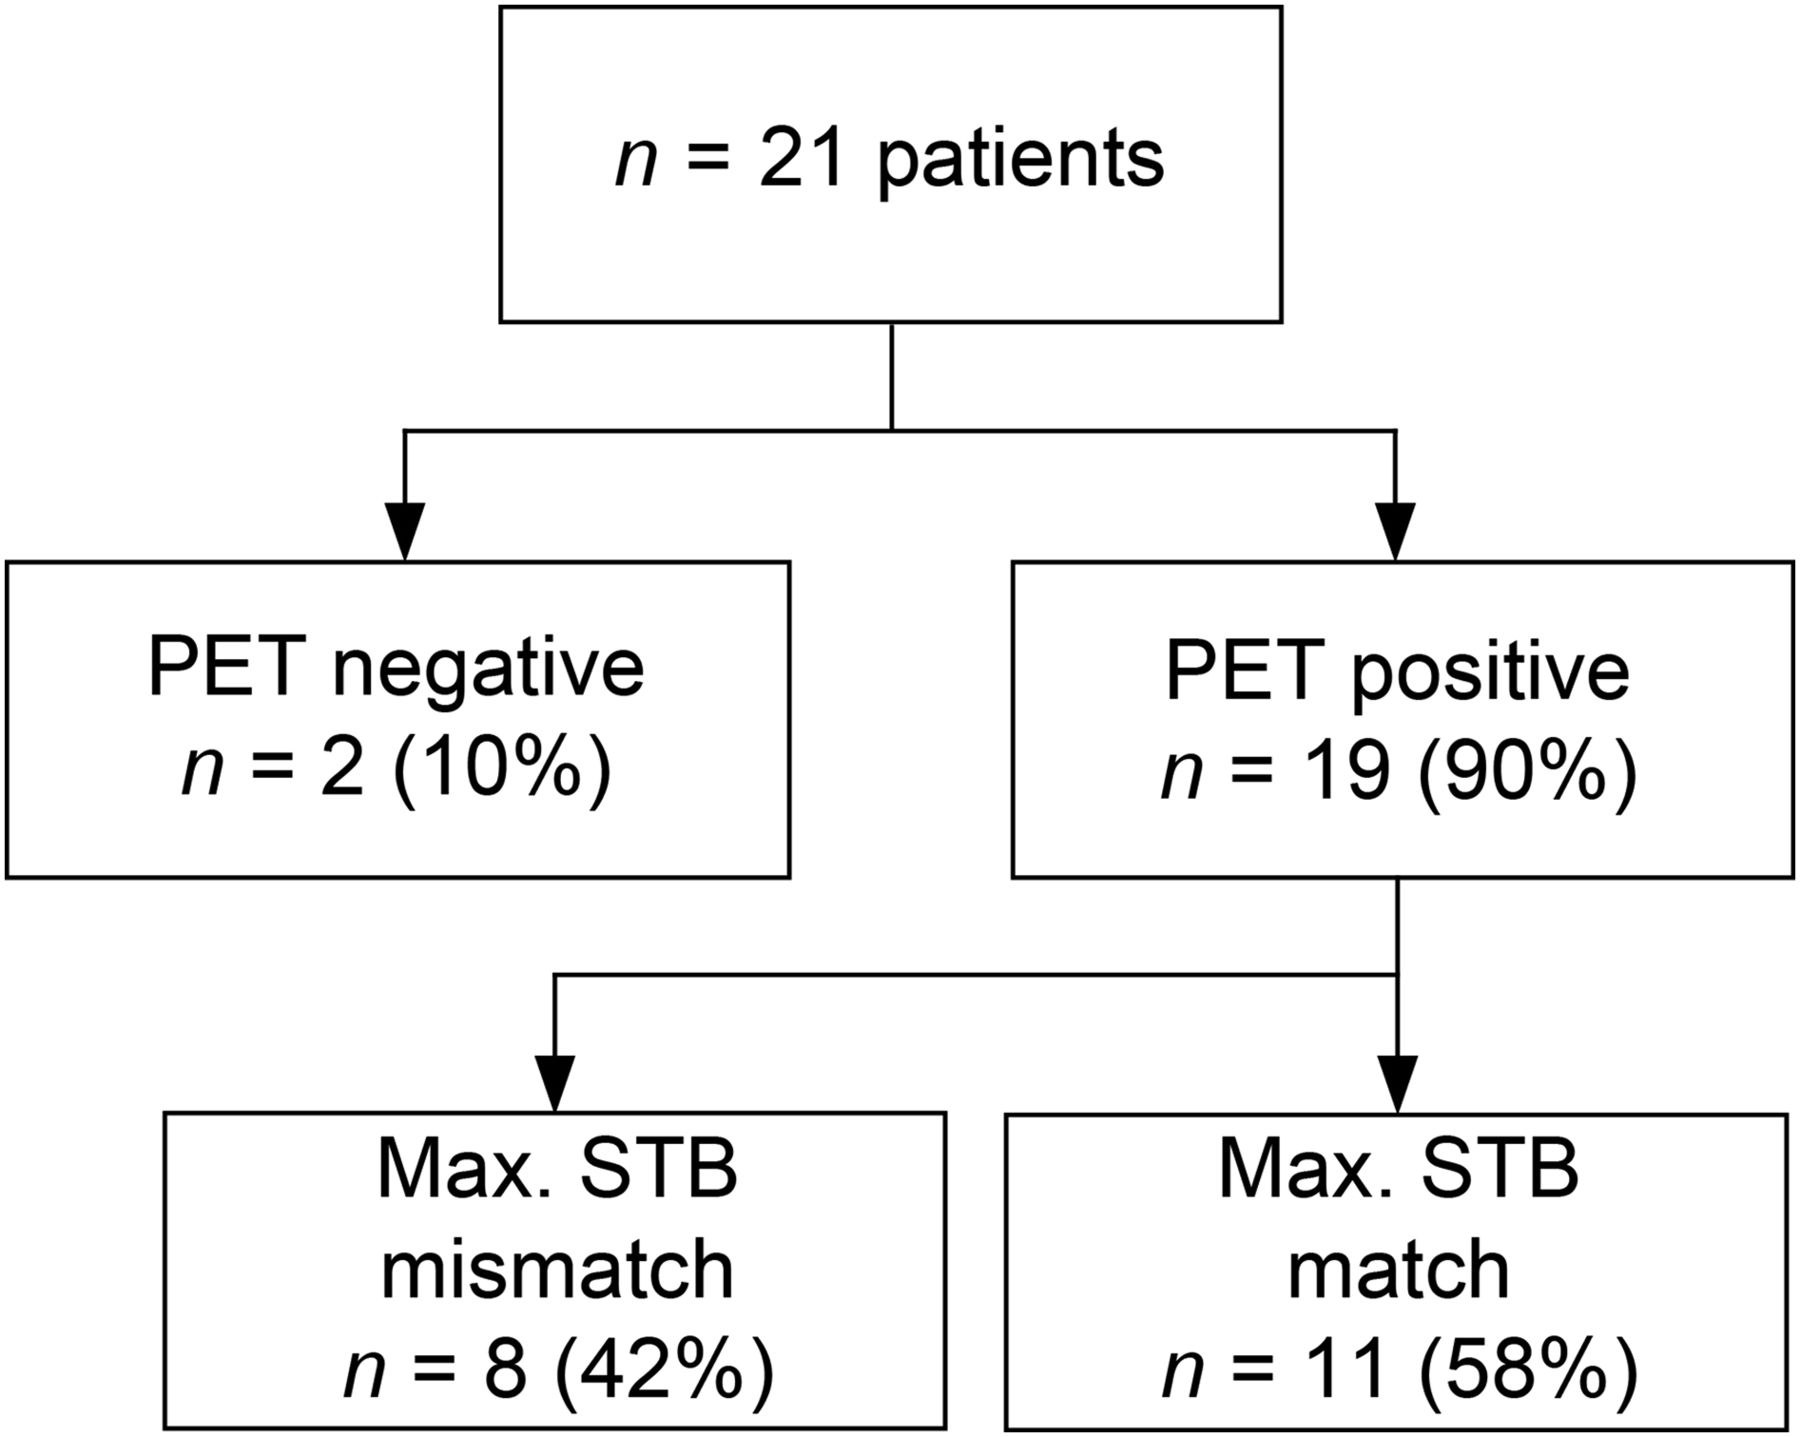
68Ga-PSMA PET/CT performance in 21 patients. Patients were grouped by optimal SUVmax cutoff as PET-positive or PET-negative. PET-positive patients were further parsed into those for whom PET and histopathology indicated highest STB in same glandular segment (maximum STB match) or in different segments (maximum STB mismatch).
PET/CT detected seminal vesicle infiltration with 73% sensitivity, 100% specificity, a 100% positive predictive value, a 77% negative predictive value, and 86% accuracy (Table 3). In all 3 patients with a false-negative PET/CT finding in this regard, infiltration was unilateral on histopathology. PET/CT detected spread through the capsule with 50% sensitivity and 71% accuracy (Supplemental Table 2). Tumor growth into the surrounding soft tissue was missed in 6 patients: 4 patients with GS7 and 1 each with GS8 and GS9, even though tracer uptake in the primary prostate cancer was markedly elevated (mean SUVmax, 20.0 ± 9.3).
Accuracy of 68Ga-PSMA PET/CT for Detection of Histopathologically Proven (HP+) Invasion of Seminal Vesicles
DISCUSSION
The present study on 21 patients with suspected prostate cancer demonstrated 68Ga-PSMA PET to have promising accuracy for the detection of tumor-affected regions of the prostate, based on the same 6-segment model as used for extended-sextant biopsy. Cancerous tissue proved to be present in almost all segments with high tracer uptake, as characterized by an SUVmax exceeding 6.5, thus giving a positive predictive value of greater than 95% for PET. On the other hand, 33 of 100 segments with histopathology-proven infiltrates from primary prostate cancer were PET-negative, resulting in a moderate sensitivity of 67%, which is nonetheless superior to the pooled sensitivity (54%–66%) reported on a regional or biopsy level for various MRI protocols in a systematic review from the National Institute for Health Research (4). PET false-negative findings were obtained most often in segments with a GS of 7 or less, and more than two thirds of our PET false-negative segments had an STB of less than 25%, thus representing unfavorable target regions for needle biopsy. Furthermore, 68Ga-PSMA PET had commendably high (86%) accuracy for the detection of seminal vesicle involvement, albeit with only 50% sensitivity for detecting other tumor spread through the capsule.
Before the advent of PSMA PET, 18F-choline was the primary PET/CT tracer for detection of prostate cancer. In a prospective study on 18F-choline PET in conjunction with MRI, Hartenbach et al. (5) found discrimination between lesions with a GS of more than 6 versus 6 or less based on mean lesional tracer uptake. In our analysis, 68Ga-PSMA PET similarly showed a significant difference in tracer uptake for segments with a GS of more than 6 versus 6 or less, although our cohort included relatively few samples that were a GS of 6 or less. The 18F-choline PET analysis of lesions larger than 5 mm in diameter demonstrated 68% accuracy, as compared with 72% accuracy for 68Ga-PSMA PET in our study. The slightly higher accuracy of 68Ga-PSMA PET might, notwithstanding group differences in patient cohort and sample analysis, be due to inherently superior tumor-to-background uptake for 68Ga-PSMA as compared with 18F-choline (6). Indeed, tumor-to-background uptake is critical for the diagnostic accuracy of radiolabeled PSMA ligands. Rowe et al., in their prospective analyses of the performance of PET/CT in conjunction with MRI using the 18F-labeled PSMA ligand 18F-DCFBC (N-[N-[(S)-1,3-dicarboxypropyl]carbamoyl]-4-18F-fluorobenzyl-l-cysteine) for detection of primary prostate cancer in 13 patients (14), reported lower accuracy for PET (57%) than for MRI (65%). Surprisingly, negative PET results were found in more than half their patients, and those with PET-positive disease demonstrated relatively low tumor uptake. In our study, the mean SUVmax in tumor-affected segments was about 10-fold the blood-pool activity, and some were 3-fold higher than the SUV in nondiseased segments of the prostate. This superior tumor-to-background uptake of 68Ga-PSMA likely resulted in increased accuracy for prostate cancer detection as compared with 18F-DCFBC. However, a significant proportion of primary tumors present with heterogeneous or overall low PSMA expression (Supplemental Fig. 4) (15). This discordance together with the limited spatial resolution of PET limits the accuracy of PSMA-based tumor characterization and might well have caused false-negative findings by 68Ga-PSMA PET/CT. Furthermore, primary lesions often coexist with hyperplasia, which is associated with increased PSMA expression (16). The high background signal of the prostate may mask the difference between histopathology-positive and -negative segments, especially in those segments with a GS of 6 or a low STB. This effect may have contributed to a decreased negative predictive value when compared with previous findings for prostate cancer metastases at biochemical recurrence (7). Nonetheless, we demonstrated for the first time, to our knowledge, that quantification of the extent of intraglandular tumor is feasible by applying a threshold for tracer uptake. Among several organs, blood demonstrated the lowest variance (Supplemental Table 3) and thus represents a stable reference for 68Ga-PSMA uptake. By using cutoffs derived from average blood SUV, we could correctly identify the particular segment with the highest postprostatectomy STB in more than half the patients. With high accuracy, 68Ga-PSMA PET identified diseased segments and specifically segments with a GS of 7 or higher (areas under the curve, 0.84 and 0.81, respectively). Only 2 patients (10%) were overall PET-negative. Semiquantitative imaging of tracer uptake in prostate cancer presents an advantage over other methods currently used for primary diagnosis or guidance of targeted biopsy. Since PET analysis based on a semiautomatic SUV cutoff does not depend on the investigator’s experience, it is less prone to interobserver disagreement as reported for MRI (3) and might easily be translated across multiple institutions. This advantage, together with the possibility of combining 68Ga-PSMA PET with MRI or ultrasound, emphasizes the great potential of 68Ga-PSMA imaging for biopsy guidance and diagnosis of primary prostate cancer (17,18).
The present study had several limitations. Data analysis was performed retrospectively. We analyzed 6 predefined axial planes of the prostate, such that prostate cancer lesions centered between these planes might have been missed or not adequately depicted in our analysis. Also, a change in prostate shape during surgery and subsequent tissue preparation may have led to spatial discordance between histopathology and PET/CT. On the other hand, we deliberately used a clear definition of slice location by z-coordinates and the same 6-segment model for standard extended-sextant biopsy in the regional analysis of PET and histopathology findings. Most patients in our cohort had high-risk to very high-risk prostate cancer, likely to overexpress PSMA (19), thus imparting higher accuracy to 68Ga-PSMA PET than might have been expected in patients with low-risk prostate cancer.
CONCLUSION
In patients with biopsy-proven prostate cancer, 68Ga-PSMA PET/CT identifies affected regions of the prostate with 67% sensitivity and 92% specificity. 68Ga-PSMA PET/CT further detects the intraglandular STB, as well as spread to seminal vesicles. Our preliminary data on a small set of patients encourage the future prospective investigation of PET-guided biopsy in order to overcome sampling bias in patients with suspected prostate cancer.
DISCLOSURE
The costs of publication of this article were defrayed in part by the payment of page charges. Therefore, and solely to indicate this fact, this article is hereby marked “advertisement” in accordance with 18 USC section 1734. No potential conflict of interest relevant to this article was reported.
Acknowledgments
We acknowledge manuscript revision by Dr. Paul Cumming.
Footnotes
Published online Jun. 3, 2016.
- © 2016 by the Society of Nuclear Medicine and Molecular Imaging, Inc.
REFERENCES
- Received for publication January 19, 2016.
- Accepted for publication May 2, 2016.


Jump to section
Related Articles
Cited By...
- Diagnostic Performance of [18F]AlF-Thretide PET/CT in Patients with Newly Diagnosed Prostate Cancer Using Histopathology as Reference Standard
- The Value of 68Ga-PSMA PET/MRI for Classifying Patients with PI-RADS 3 Lesions on Multiparametric MRI: A Prospective Single-Center Study
- Detection Efficacy of 18F-rhPSMA-7.3 PET/CT and Impact on Management in Patients with Biochemical Recurrence of Prostate Cancer After Radical Prostatectomy and Before Potential Salvage Treatment
- 68Ga-PSMA PET/CT Combined with PET/Ultrasound-Guided Prostate Biopsy Can Diagnose Clinically Significant Prostate Cancer in Men with Previous Negative Biopsy Results
- Head-to-Head Comparison of 68Ga-PSMA-11 with 18F-PSMA-1007 PET/CT in Staging Prostate Cancer Using Histopathology and Immunohistochemical Analysis as a Reference Standard
- Metaanalysis of 68Ga-PSMA-11 PET Accuracy for the Detection of Prostate Cancer Validated by Histopathology
- PSMA Ligand PET/MRI for Primary Prostate Cancer: Staging Performance and Clinical Impact
- Prostate Cancer Molecular Imaging Standardized Evaluation (PROMISE): Proposed miTNM Classification for the Interpretation of PSMA-Ligand PET/CT
- Will GRPR Compete with PSMA as a Target in Prostate Cancer?
- 68Ga-PSMA-11 PET/CT in Newly Diagnosed Carcinoma of the Prostate: Correlation of Intraprostatic PSMA Uptake with Several Clinical Parameters
- Intraindividual Comparison of 18F-PSMA-1007 PET/CT, Multiparametric MRI, and Radical Prostatectomy Specimens in Patients with Primary Prostate Cancer: A Retrospective, Proof-of-Concept Study
- 68Ga-PSMA-11 PET/CT Interobserver Agreement for Prostate Cancer Assessments: An International Multicenter Prospective Study
- PSMA Ligands for PET Imaging of Prostate Cancer
- Prostate-Specific Membrane Antigen Ligands for Imaging and Therapy