


Abstract
11C-Pittsburgh compound-B (11C-PiB) is the benchmark radiotracer for imaging of β-amyloid (Aβ) plaque in Alzheimer disease (AD). 18F-labeled Aβ tracers subsequently developed for clinical use show higher nonspecific white matter binding and, in some cases, lower cortical binding in AD that could lead to less accurate interpretation of scans. We compared the cortical and white matter binding of a new 18F-labeled Aβ tracer, 18F-AZD4694 (recently renamed NAV4694), with 11C-PiB in the same subjects. Methods: Forty-five participants underwent PET imaging with 11C-PiB and 18F-AZD4694 (25 healthy elderly controls [HCs], 10 subjects with mild cognitive impairment, 7 subjects with probable AD, and 3 subjects with probable frontotemporal dementia). Images were coregistered so that region-of-interest placement was identical on both scans, and standardized uptake value ratios (SUVRs) using the cerebellar cortex as a reference region were calculated between 40 and 70 min after injection for both tracers. Results: 18F-AZD4694 showed reversible binding kinetics similar to 11C-PiB, reaching an apparent steady state at 50 min after injection. Both radiotracers showed a similar dynamic range of neocortical SUVR (1.1–3.3 and 1.0–3.2 SUVR for 11C-PiB and 18F-AZD4694, respectively) and identical low nonspecific white matter binding, with frontal cortex–to–white matter ratios of 0.7 ± 0.2 and 1.3 ± 0.2 for both radiotracers in HCs and AD subjects, respectively. There was an excellent linear correlation between 11C-PiB and 18F-AZD4694 neocortical SUVR (slope of 0.95, r = 0.99, P < 0.0001). Conclusion: 18F-AZD4694 displays imaging characteristics nearly identical to those of 11C-PiB. The low white matter and high cortical binding in AD indicate that this tracer is well suited to both clinical and research use.
Imaging of β-amyloid (Aβ) in vivo with PET provides an important new tool for the evaluation of the causes, diagnosis, and future treatment of dementias, where Aβ may play a role (1). Studies with 11C-Pittsburgh compound-B (11C-PiB), the first and most widely studied PET Aβ ligand, indicate that Aβ imaging may allow the earlier diagnosis of Alzheimer disease (AD) (2,3) and better differential diagnosis of dementia (2,4). 11C-PiB studies show robust cortical binding in almost all AD subjects (2,3) and correlate well with a reduction in cerebral spinal fluid Aβ42 (5) and AD histopathology (6–8). Increased 11C-PiB binding has shown high predictive value for progression from mild cognitive impairment (MCI) to AD (9,10).
On the basis of recent advances in neuroimaging and cerebral spinal fluid analysis, the research criteria for the diagnosis of probable AD have been revised to allow for earlier diagnosis and therapeutic intervention (11). Thus, as the criteria for the diagnosis of AD evolve, Aβ imaging is likely to have an increasingly important role in clinical practice provided it is accessible and affordable and the scans can be read in a consistent and reliable manner when used beyond academic centers of excellence (12).
Unfortunately, the 20-min radioactive decay half-life of 11C limits the use of 11C-PiB to centers with an on-site cyclotron and 11C radiochemistry expertise, making the access to 11C-PiB PET restricted and with costs prohibitive for routine clinical use (13). To overcome these limitations, several tracers labeled with 18F (half-life, 110 min)—which permits the centralized production and regional distribution, as currently practiced worldwide in the supply of 18F-FDG for clinical use—were synthesized and tested (14–18). Florbetapir, florbetaben, and flutemetamol have completed phase III clinical trials, and florbetapir has been approved by the Food and Drug Administration for use in humans to detect the presence of amyloid plaques (18–21). However, these 18F-labeled amyloid tracers have greater nonspecific white matter binding than 11C-PiB and some have lower cortical binding in AD patients. These characteristics may make visual interpretation of scans more challenging, particularly for the detection of low levels of cortical amyloid plaque, and increase the level of training and expertise required for accurate and consistent visual interpretation of scans in clinical practice.
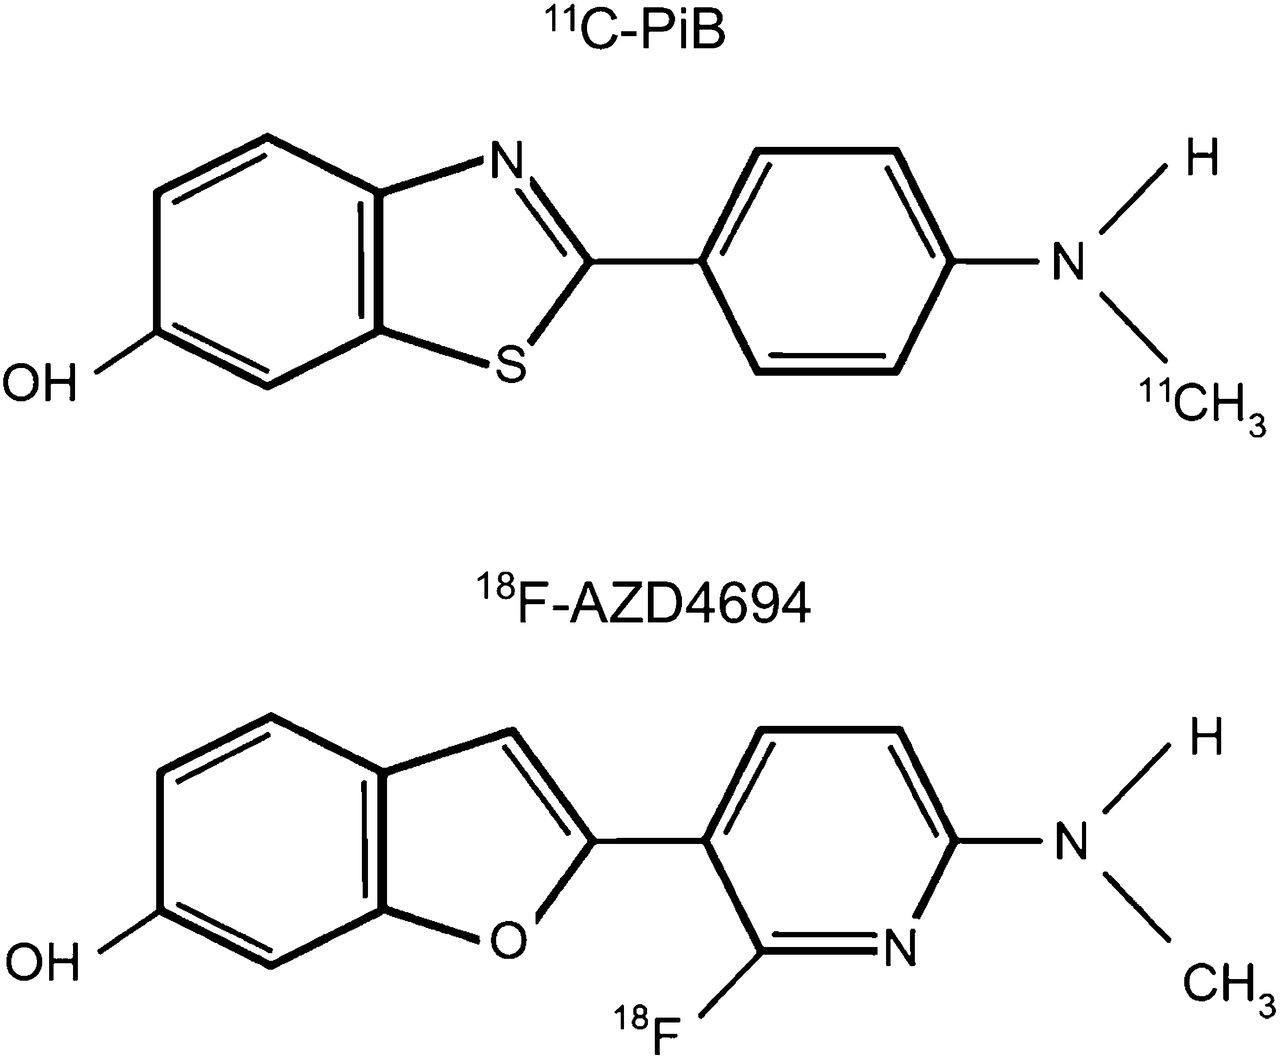
A preliminary study with a recently developed 18F-labeled amyloid tracer that has a close structural resemblance to 11C-PiB, 18F-AZD4694 (recently renamed NAV4694) (Fig. 1) (17), showed a robust separation between AD patients and healthy age-matched controls (HCs) and less white matter binding than reported with other 18F-labeled amyloid tracers. To further characterize 18F-AZD4694, the present study compared the cortical and white matter binding of 11C-PiB and 18F-AZD4694 in the same subjects.

Chemical structure of 11C-PiB and 18F-AZD4694.
MATERIALS AND METHODS
Study Participants
The study was approved by the Austin Health Human Research Ethics Committee. Written informed consent was obtained from all subjects before participation and also from the next of kin or caregiver for the subjects with dementia. Participants were clinically classified by consensus between a neurologist and a neuropsychologist. The study was prospective and included 25 HCs, 10 subjects meeting criteria for mild cognitive impairment (MCI) (22), 10 subjects with dementia, 7 subjects meeting the criteria of the National Institute of Neurological Disorders and Stroke and the Alzheimer's Disease and Related Disorders Association for probable AD (23), and 3 subjects meeting criteria for frontotemporal dementia (FTD) (24). Subjects were recruited from the Austin Health Memory Disorders Clinic and affiliated dementia specialist clinics and by advertising.
All subjects were older than 60 y, spoke fluent English, and had completed at least 7 y of education. No subjects had a history of or physical or imaging findings of other neurologic/psychiatric illness, current or recent drug or alcohol abuse/dependence, or any significant other disease or unstable medical condition. Total radiation exposure from this study fell within the Australian guidelines for research radiation exposure for subjects older than 60 y.
More than half of the participants (56%) underwent the 11C-PiB and 18F-AZD4694 PET studies on the same day, with 18F-AZD4694 administered 50 min after the 11C-PiB study acquisition was finished. The rest of the participants underwent the 11C-PiB and 18F-AZD4694 PET studies on separate occasions, with a median interval of 14 (±27) days (range, 1–93 d).
Participants were administered the Mini-Mental State Examination, were given a Clinical Dementia Rating score, and underwent a battery of neuropsychologic tests to ensure that they fulfilled diagnostic criteria for AD, MCI, or normality. A composite episodic memory score was calculated by taking the average of the z scores (generated using 65 low 11C-PiB HC with normal MR imaging findings as the reference) for the Rey Complex Figure Test (30 min) long delay and California Verbal Learning Test–Second Edition long delay, as previously described (25). A composite nonmemory cognition score was calculated by taking the average of the z scores for the Boston Naming Test, letter fluency, category fluency, Digit Span forward and backward, Digit Symbol-Coding, and Rey Complex Figure Test copy.
Image Acquisition
MR imaging consisted of a 3-dimensional T1-weighted magnetization-prepared rapid gradient-echo scan used for screening and coregistration with the PET images.
PiB and AZD4694 were radiolabeled at the Centre for PET, Austin Health, as previously described (2,17). Briefly, PiB was produced using the 1-step 11C-methyl triflate approach. The average radiochemical yield was 30% after a synthesis time of 45 min, with a radiochemical purity of greater than 98% and a specific activity of 30 ± 7.5 GBq/µmol. AZD4694 was produced by radiofluorination of the corresponding N-Boc–protected nitro precursor, followed by acidic deprotection with hydrochloric acid. Average radiochemical yield was 16% after a synthesis time of 65 min, with a radiochemical purity of greater than 98% and a specific activity of 555 ± 230 GBq/µmol. PET scans were acquired on a 3-dimensional Phillips Allegro scanner at the Austin Health Centre for PET. A transmission scan using a rotating 137Cs source was acquired for attenuation correction immediately before the emission scan. Participants underwent dynamic PET scans from 0 to 70 min after the injection 200 MBq of 18F-AZD4694 and static scans at 40–70 min after the injection of 370 MBq of 11C-PiB. Images were reconstructed using a 3-dimensional row-action maximum-likelihood algorithm.
Visual Inspection
Deidentified images were read separately by 3 independent readers masked to clinical diagnosis. Images were graded as no cortical binding, low cortical binding, or high cortical binding. The readers had variable experience with 11C-PiB image interpretation, but none had prior experience with 18F-AZD4964 PET. Transverse, sagittal, and coronal views were available for examination.
Image Analysis
Each individual’s PET and MR images were coregistered using SPM5 (26). Regions of interest (ROIs) were then drawn on the individual MR images and transferred to the coregistered PET images (Supplemental Fig. 1; supplemental materials are available online only at http://jnm.snmjournals.org). Mean radioactivity values were obtained from ROIs for cortical, subcortical, and cerebellar regions. White matter ROIs were placed at the centrum semiovale, and the cerebellar regions were placed over the cerebellar cortex with care taken to avoid white matter. No correction for partial volume was applied to the PET data.
Standardized uptake values (SUVs)—defined as the decay-corrected brain radioactivity concentration, normalized for injected dose and body weight—were calculated for all regions. These values were then used to derive the SUV ratio (SUVR) referenced to the cerebellar cortex (Supplemental Appendix 1), a region relatively unaffected by dense Aβ plaques in sporadic AD, for both 11C-PiB and 18F-AZD4694. Global Aβ burden was expressed as the average SUVR of the mean for the following cortical ROIs: frontal (consisting of dorsolateral prefrontal, ventrolateral prefrontal, and orbitofrontal regions), superior parietal, lateral temporal, lateral occipital, and anterior/posterior cingulate and precuneus. Distribution volume ratios (DVRs) for 18F-AZD4694 were determined through graphical analysis of the 70-min time–activity curves (Supplemental Appendix 1) (27). The global DVR was calculated with the same regions used for the global SUVR.
As previously described (9) and to identify a SUVR cutoff, a hierarchical cluster analysis was performed on the 25 HC participants that yielded a threshold for high or low global SUVR of 1.5 for both 11C-PiB and 18F-AZD4694.
Statistical Evaluation
The normality of distribution was analyzed using the Shapiro–Wilk test and visual inspection of variable histograms. Statistical evaluations between radiotracers were performed using a paired Student t test, and comparisons to establish differences between group means were performed with ANOVA. Effect size was measured with Cohen d (Supplemental Appendix 1). Categoric differences were evaluated using a Fisher exact test. Pearson product–moment correlation analyses were conducted between 11C-PiB and 18F-AZD4694 SUVR. Data are presented as mean ± SD unless otherwise stated.
RESULTS
Forty-five participants were evaluated with both radiotracers, and their demographics are detailed in Table 1. No serious adverse events related to the study drugs were observed or reported by any participants as a result of the 11C-PiB or 18F-AZD4694 scans, and no concerns were raised by the participants or their relatives.
Cohort Demographics
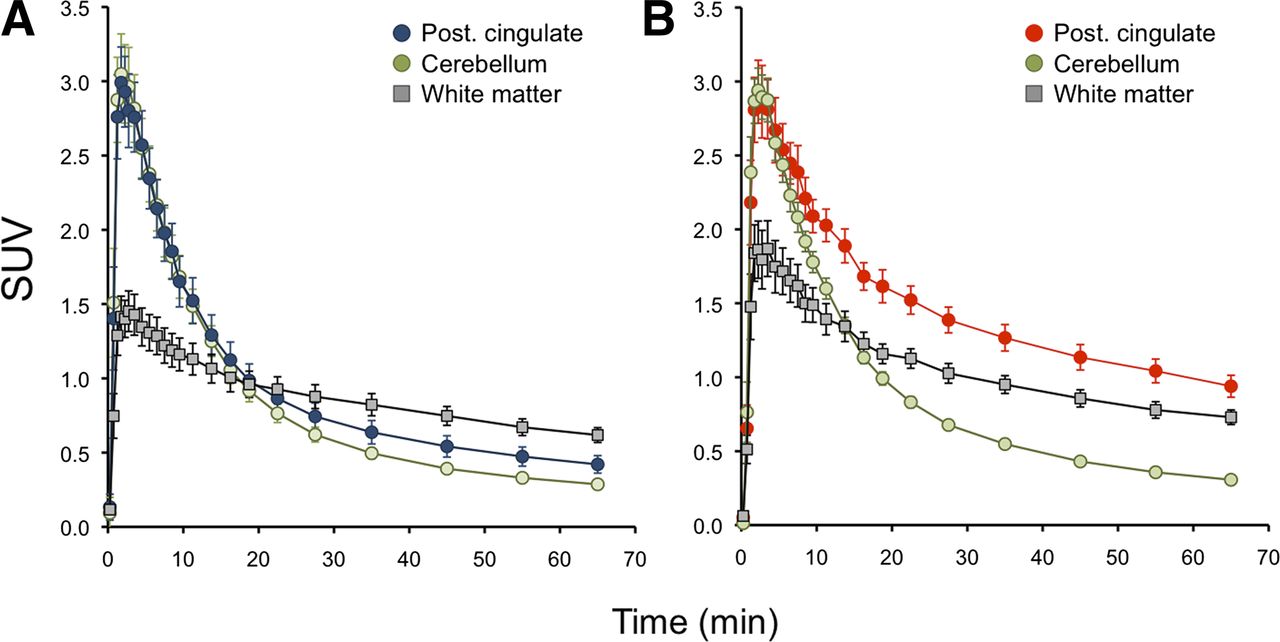
Brain radioactivity peaked between 3 and 6 min after injection of 18F-AZD4694. The binding appeared to be reversible, with rapid washout from all areas in controls other than white matter, clearing fastest from the cerebellar cortex (Fig. 2) in keeping with a previous report (17). The clearance rate and the SUV measurements in the cerebellar cortex showed no difference between subject groups, consistent with the absence of significant Aβ in this region. In AD patients, cortical binding exceeded white matter binding at all time points (Fig. 2). The cortical–to–cerebellar gray matter ratio (SUVR) reached an apparent steady state approximately 50 min after injection in HCs and AD subjects, as previously reported (17). Given the similar brain kinetics between 11C-PiB and 18F-AZD4694, the same period of 40–70 min after injection was selected for the comparison.

Time–activity curves for 18F-AZD4694 in HCs and AD subjects. Mean time–activity curves from 25 HCs (A) and 7 AD patients (B). In AD group, at all time points, cortical binding exceeds white matter binding.
There was an excellent linear correlation between DVR calculated from the 70-min dynamic scan and the SUVR calculated from the summed 40- to 70-min data of the 18F-AZD4694 scans (r = 0.95, P < 0.0001, where 18F-AZD4694 SUVR = 18F-AZD4694 DVR × 1.85 − 0.66).
On visual inspection, the summed 40- to 70-min images of all AD subjects showed extensive cortical 11C-PiB and 18F-AZD4694 binding that was greater in the frontal and posterior cingulate and precuneus cortex and slightly less in the lateral temporal and parietal cortex. There was relative sparing of the primary sensorimotor cortex, with no appreciable specific binding in the cerebellar cortex. No cortical binding was observed in the 3 FTD patients. Six of the 10 (60%) MCI subjects presented with 11C-PiB and 18F-AZD4694 binding similar to that observed in the AD group. Twenty-one of the 25 HCs presented no cortical or subcortical gray matter 11C-PiB or 18F-AZD4694 binding, and their scans were clearly distinguishable from subjects with AD. However, 4 (16%) HCs were visually classified as having cortical 11C-PiB binding, and cortical 18F-AZD4694 binding was also observed in the same 4 HCs.
The 11C-PiB and 18F-AZD4694 images were virtually indistinguishable by visual inspection (Fig. 3). Similar white matter binding was observed with both radiotracers. When quantified, there were no significant differences in white matter binding for each tracer in both HCs and AD subjects, with frontal cortex–to–white matter ratios of 0.72 ± 0.16 and 1.36 ± 0.22, respectively, for 11C-PiB and 0.71 ± 0.16 and 1.33 ± 0.22, respectively, for 18F-AZD4694.
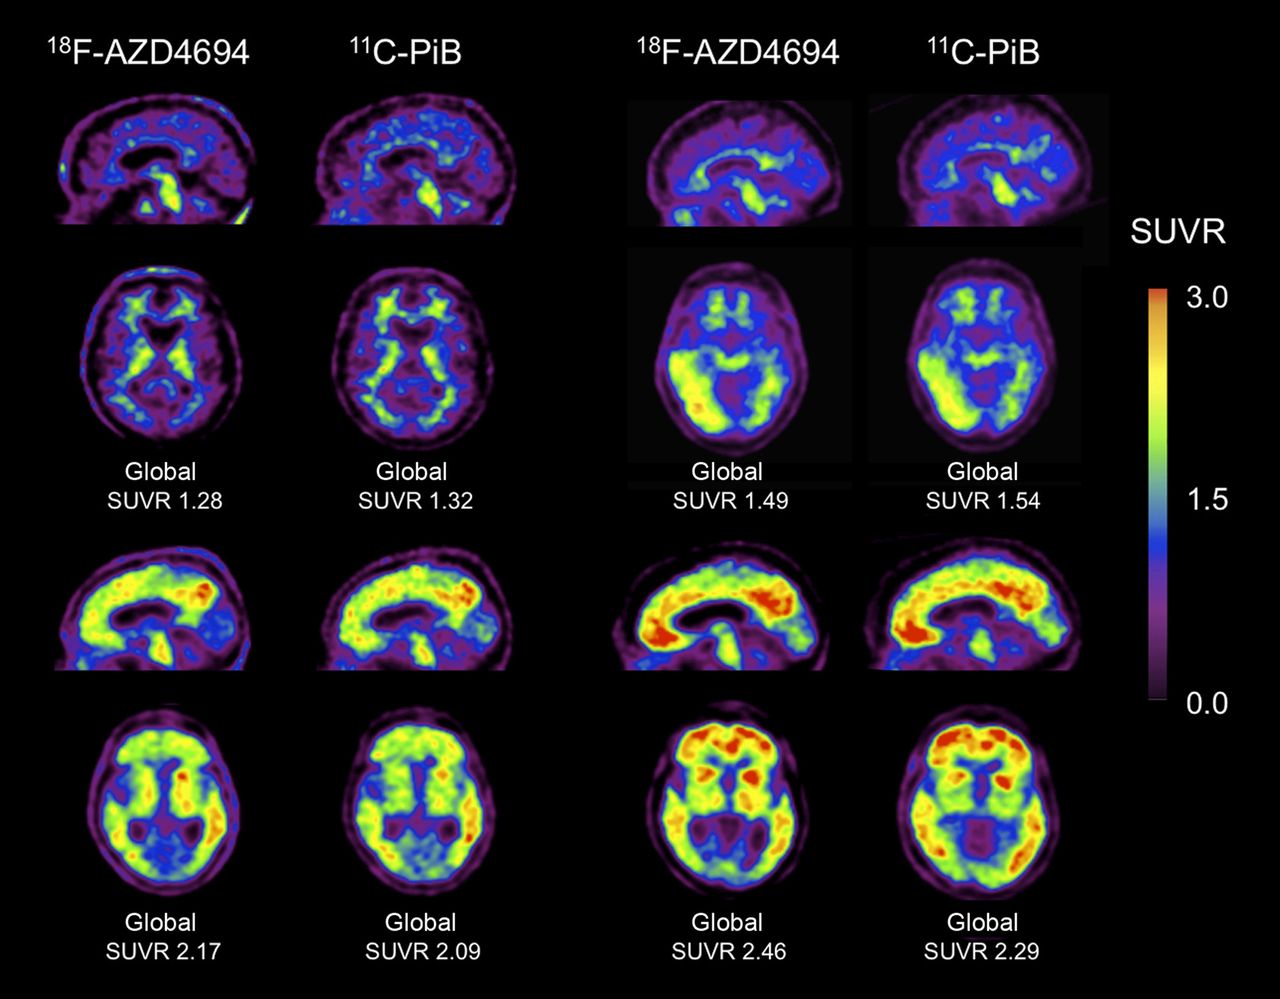
18F-AZD4694 and 11C-PiB PET imaging in 4 subjects representative of range of tracer binding. Four examples of sagittal and transaxial 18F-AZD4694 images adjacent to same-slice 11C-PiB images in same subject. Top 2 subjects were HCs, and bottom 2 both had clinical diagnosis of AD. 18F-AZD4694 and 11C-PiB images were acquired with same acquisition time frame, processed in the same manner, and are shown scaled to same SUVR maximum, illustrating near-identical appearance and dynamic range of SUVRs of 18F-AZD4694 to 11C-PiB. Low-level, predominantly right occipitotemporal cortical binding is equally well detected in asymptomatic, elderly subject (top right).
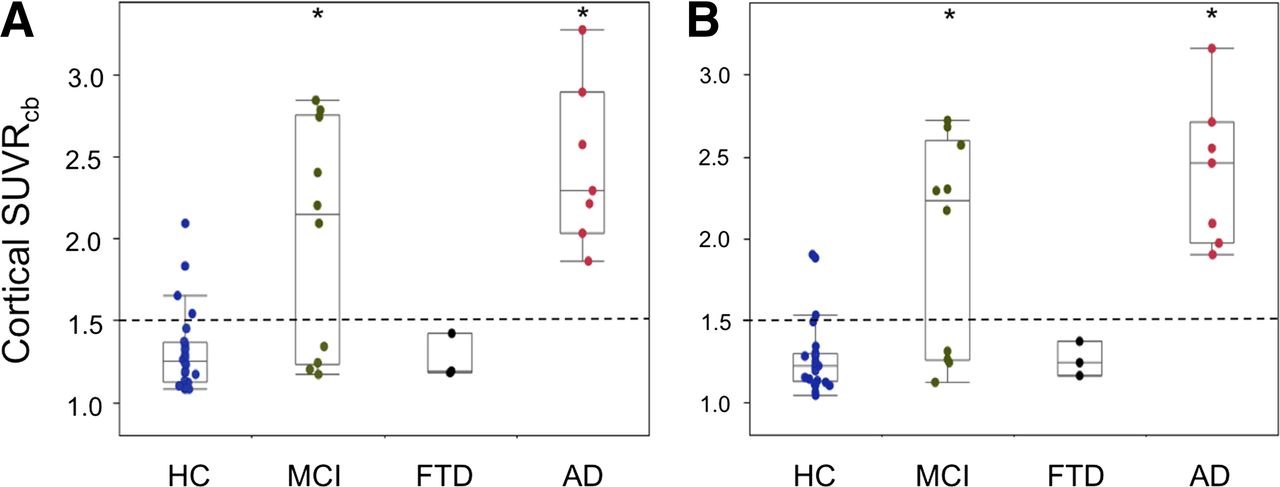
Figure 4 shows the global cortical SUVR for 11C-PiB and 18F-AZD4694. Global 11C-PiB SUVRs were 1.31 ± 0.25 in HCs, 2.00 ± 0.70 in MCI subjects, 2.45 ± 0.50 in AD subjects, and 1.26 ± 0.14 in FTD subjects. Similar values were obtained with 18F-AZD4694 for the same groups, with SUVRs of 1.27 ± 0.22 in HCs, 1.97 ± 0.66 in MCI subjects, 2.41 ± 0.45 in AD subjects, and 1.26 ± 0.11 in FTD subjects. Despite the similar SUVRs, when HCs were compared with AD subjects, 18F-AZD4694 yielded a slightly higher effect size (d = 2.6 and 2.9 for 11C-PiB and 18F-AZD4694, respectively). When the cutoff SUVR of 1.50 was applied, 4 (16%) HCs were considered to have high Aβ burden with 11C-PiB, whereas only 3 (12%) HCs were considered to have high Aβ burden with 18F-AZD4694. The discrepant HC had an SUVR of 1.54 for 11C-PiB and an SUVR of 1.49 for 18F-AZD4694. All gray matter regions in the AD group were significantly higher than those in the HC group. Table 2 lists the global and regional SUVRs for both radiotracers, along with the respective effect size for each region in the HC and AD groups. Percentage differences in cortical SUVRs between 11C-PiB and 18F-AZD4694 (1.5% and 1.2% for HC and AD groups, respectively) were well below our 3.5% test–retest reproducibility for 11C-PiB (9).

Global Aβ burden with 11C-PiB and 18F-AZD4694. Box plots of global Aβ burden in same HC, MCI, FTD, and AD participants assessed with 11C-PiB (A) or 18F-AZD4694 (B). Dotted line denotes 1.5 threshold between high and low radiotracer binding. *Significantly different from HC (P < 0.05).
Comparison of 18F-AZD4694 and 11C-PiB SUVRs and Effect Sizes (d) in HCs and AD Subjects
The Mini-Mental State Examination scores correlated with 11C-PiB global SUVRs (r = −0.66, P < 0.0001) and 18F-AZD4694 global SUVRs (r = −0.69, P < 0.0001) when all subjects were pooled together. Similarly, when pooled together, global SUVRs also correlated with episodic memory (r = −0.50, P = 0.0008 and r = −0.53, P = 0.0004 for 11C-PiB and 18F-AZD4694, respectively) and nonmemory scores (r = −0.57, P < 0.0001 and r = −0.61, P < 0.0001 for 11C-PiB and 18F-AZD4694, respectively). However, when cohorts were analyzed separately, there was no significant correlation in any group, with the exception of global 18F-AZD4694 SUVR and episodic memory scores in HCs (r = −0.44, P = 0.039). No such correlation was found for 11C-PiB (r = −0.33, P = 0.12).
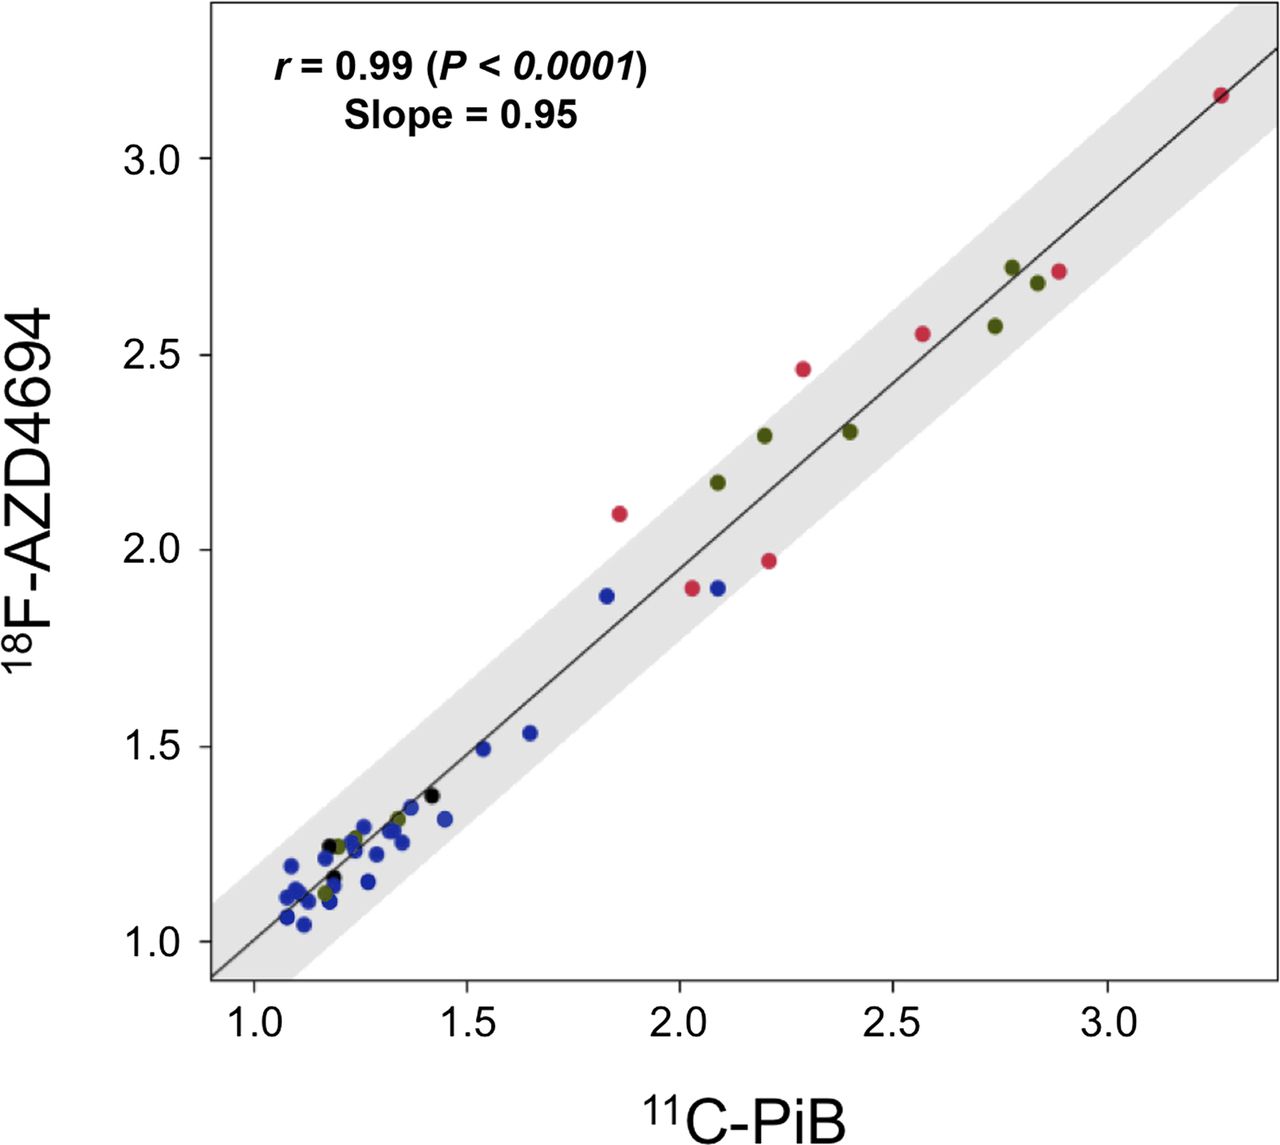
There was a high correlation between 11C-PiB and 18F-AZD4694 global SUVRs (r = 0.99, P < 0.0001) as described by the following equation: 18F-AZD4694 global SUVR = (11C-PiB global SUVR × 0.95) + 0.05 (Fig. 5). The high correlation between 11C-PiB and 18F-AZD4694 SUVR remained when the HC, MCI, and AD groups were examined separately (r = 0.96, P < 0.0001; r = 0.99, P < 0.0001; and r = 0.93, P = 0.0021, respectively). Regional cortical, subcortical, and white matter area SUVRs for 11C-PiB and 18F-AZD4694 were also highly correlated (Table 3).

Same subject correlation of global SUVR for 11C-PiB and 18F-AZD4694. High correlation is observed between 11C-PiB and 18F-AZD4694 (r = 0.99; P < 0.0001). Slope of 0.95 indicates that spectrum of 18F-AZD4694 value is almost identical to that for 11C-PiB. Red dots are AD subjects (n = 7), black are FTD subjects (n = 3), green are MCI subjects (n = 10), and blue are HCs (n = 25).
Regional Correlation Coefficients for 11C-PiB and 18F-AZD4694 SUVRs
DISCUSSION
Aβ imaging is a tool that has opened up new possibilities for the early detection, intervention, and prevention of dementia due to AD. In addition to an emerging role in dementia diagnosis in clinical practice, Aβ imaging is likely to play a critical role in the development of antiamyloid therapies, by improving subject selection at early phases of the disease and monitoring treatment response.
To our knowledge, this is the first report directly comparing 11C-PiB and 18F-AZD4694 in the same subjects, comprising the following 4 different clinical groups: HCs, MCI patients, FTD patients, and AD patients. As expected, the AD group showed higher Aβ burden than did HCs, as measured by both 11C-PiB and 18F-AZD4694 binding.
18F-AZD4694 provided a robust separation of AD patients from HCs. This separation was achieved either with visual image inspection or with a simple quantitative measure, the global SUVR (i.e., the ratio of cortical–to–cerebellar gray matter binding), derived from a scan with an acquisition length suitable for clinical imaging. It appears likely that scan duration can be reduced without compromising sensitivity or image quality, but this requires further investigation and validation. Furthermore, compared with 11C-PiB, both the use of 18F-labeled amyloid tracers and the decay half-life of 18F make centralized production with distribution to multiple PET sites possible, thereby improving access to Aβ imaging.
Visually, 16% of HCs were deemed positive for Aβ as assessed by both 11C-PiB and 18F-AZD4694, presenting an almost identical regional pattern of cortical binding. As in numerous reports, this finding suggests that Aβ deposition is an early feature of the disease preceding cognitive impairment (2,28–31). The prevalence of 18F-AZD4694–positive scan findings reported here is in accord with previous reports using 11C-PiB (2,28,29) and with postmortem studies that have documented moderate numbers of Aβ plaques in the cerebral cortex of about a quarter of nondemented persons older than 75 y (30,31).
The cortical distribution was almost identical for both tracers, displaying the same dynamic range of SUVRs, with mean global SUVR for AD being 87% greater than in HC with 11C-PiB and 90% greater with 18F-AZD4694. 18F-AZD4694 also had a slightly higher effect size than 11C-PiB (2.9 vs. 2.6, respectively).
The relatively low degree of nonspecific binding to white matter in 18F-AZD4694 studies distinguishes this compound from the 18F amyloid radiotracers that are currently in late-stage clinical trials or approved for clinical use (2,15,16,18,32). Similar cortical–to–white matter ratios were obtained for both 11C-PiB and 18F-AZD4694 in HCs and AD subjects, and the ratio in AD is substantially higher than those reported for other 18F amyloid radiotracers (2,15,16,18,32).
Likewise, the slope of the linear correlation of 18F-AZD4694 to 11C-PiB of 0.95 is higher than those reported for florbetapir (with reported slopes ranging from 0.33 to 0.64) (33,34) and florbetaben (slope of 0.71) (35), and this translates to a wider dynamic range with greater percentage difference between the mean global SUVRs of HCs and AD cohorts and greater image contrast between HC and AD.
Given this low, nonspecific white matter binding and the high cortical binding in AD, visual reading of scans may be less challenging for 18F-AZD4694 than for the other 18F amyloid radiotracers. In AD, 18F-AZD4694 PET images clearly show high radiotracer binding in extensive areas of gray matter well in excess of white matter binding. In contrast, other 18F amyloid radiotracers show cortical binding frequently similar to, rather than greater than, the nonspecific white matter binding, leading to the recommendation that the criteria for a positive florbetapir scan finding for cortical amyloid include loss of the gray–white matter demarcation in 2 or more areas of the brain (14). A direct comparison of 18F-AZD4694 to other 18F-labeled amyloid tracers is required to determine what impact this difference has on the accuracy of visual interpretation and ability to detect small changes in brain amyloid load over time or with treatment.
CONCLUSION
Our results demonstrate that 18F-AZD4694 is highly correlated with 11C-PiB and therefore should reliably detect Aβ deposition in the brain and be useful in the early and differential diagnosis of AD. 18F-AZD4694 provides images that appear similar to those of 11C-PiB, without the limitation of the short 11C radioactive decay half-life that precludes the application of 11C-PiB in clinical practice. The striking similarity with 11C-PiB suggests that the results from longitudinal studies that are clarifying the relationship between Aβ accumulation and cognitive decline, and asserting the value of Aβ imaging as a predictor of cognitive decline and progression to clinical AD, can be directly translated to 18F-AZD4694. The high cortical binding in AD and low nonspecific white matter binding also suggests that 18F-AZD4694 images may be more easily and reliably read in clinical practice than other 18F-labeled PET tracers for brain amyloid.
DISCLOSURE
The costs of publication of this article were defrayed in part by the payment of page charges. Therefore, and solely to indicate this fact, this article is hereby marked “advertisement” in accordance with 18 USC section 1734. Christopher C. Rowe was a consultant for Astra Zeneca. Drs. Samuel Svensson and Zsolt Cselényi are or were employees of Astra Zeneca at the time of this study. This work was supported in part by a grant from Astra Zeneca and by the Austin Hospital Medical Research Foundation. No other potential conflict of interest relevant to this article was reported.
Acknowledgments
We thank Prof. Michael Woodward, Dr. John Merory, Dr. Peter Drysdale, Dr. Sylvia Gong, Kenneth Young, Fiona Lamb, Jessica Sagona, and the Brain Research Institute for their assistance with this study.
Footnotes
Published online Apr. 10, 2013.
- © 2013 by the Society of Nuclear Medicine and Molecular Imaging, Inc.
REFERENCES
- Received for publication October 16, 2012.
- Accepted for publication December 4, 2012.


Jump to section
Related Articles
Cited By...
- A head-to-head comparison of multiple amyloid PET radiotracers for Down syndrome clinical trials
- Evaluation of plasma p-tau217 for detecting amyloid pathology in a diverse and heterogeneous community-based cohort
- Traumatic brain injury and Alzheimers Disease biomarkers: A systematic review of findings from amyloid and tau positron emission tomography (PET)
- The RSNA QIBA Profile for Amyloid PET as an Imaging Biomarker for Cerebral Amyloid Quantification
- Plasma p-tau181/A{beta}1-42 ratio predicts A{beta}-PET status and correlates with CSF-p-tau181/A{beta}1-42 and future cognitive decline
- Plasma p217+tau vs NAV4694 amyloid and MK6240 tau PET across the Alzheimer continuum
- Determining Amyloid-{beta} Positivity Using 18F-AZD4694 PET Imaging
- Prediction of the Clinical SUV Ratio in Amyloid PET Imaging Using a Biomathematic Modeling Approach Toward the Efficient Development of a Radioligand
- Standardized Expression of 18F-NAV4694 and 11C-PiB {beta}-Amyloid PET Results with the Centiloid Scale
- Visualization and Quantification of 3-Dimensional Stereotactic Surface Projections for 18F-Flutemetamol PET Using Variable Depth
- 18F-THK5351: A Novel PET Radiotracer for Imaging Neurofibrillary Pathology in Alzheimer Disease
- Performance of 11C-Pittsburgh Compound B PET Binding Potential Images in the Detection of Amyloid Deposits on Equivocal Static Images
- Automated Quantification of 18F-Flutemetamol PET Activity for Categorizing Scans as Negative or Positive for Brain Amyloid: Concordance with Visual Image Reads
- Molecular Imaging of Alzheimer Disease Pathology
- Practical utility of amyloid and FDG-PET in an academic dementia center