


Abstract
In vivo imaging of human epidermal growth factor receptor type 2 (HER2) expression may allow direct assessment of HER2 status in tumor tissue and provide a means to quantify changes in receptor expression after HER2-targeted therapies. This work describes the in vivo characterization of the HER2-specific N-2-(4-18F-fluorobenzamido)ethyl]maleimide (18F-FBEM)–ZHER2:342 Affibody molecule and its application to study the effect of 17 (dimethylaminoethylamino)-17-demethoxygeldanamycin (17-DMAG) on HER2 expression by PET. Methods: To assess the correlation of signal observed by PET with receptor expression, we administered the tracer to athymic nude mice bearing subcutaneous human breast cancer xenografts with different levels of HER2 expression. To study the downregulation of HER2, we treated the mice with 4 doses (40 mg/kg) of 17-DMAG, an inhibitor of heat-shock protein 90, known to decrease HER2 expression. The animals were scanned before and after treatment. After the last scan, the mice were euthanized and tumors were frozen for receptor analysis. Results: The tracer was eliminated quickly from the blood and normal tissues, providing high tumor-to-blood and tumor-to-muscle ratios as early as 20 min after injection. The high-contrast images between normal and tumor tissue were recorded for BT474 and MCF7/clone18 tumors. Low but still detectable uptake was observed for MCF7 tumors, and none for MDA-MB-468. The signal correlated with the receptor expression as assessed by immunohistochemistry, Western blot, and enzyme-linked immunosorbent assay. The levels of HER2 expression estimated by post-treatment PET decreased 71% (P < 4 × 10⁻⁶) and 33% (P < 0.002), respectively, for mice bearing BT474 and MCF7/clone18 tumors. These changes were confirmed by the biodistribution studies, enzyme-linked immunosorbent assay, and Western blot. Conclusion: Our results suggest that the described 18F-FBEM–ZHER2:342 Affibody molecule can be used to assess HER2 expression in vivo by PET and monitor possible changes of receptor expression in response to therapeutic interventions.
Human epidermal growth factor receptor type 2 (HER2, ErbB2, neu) is a well-established tumor biomarker that is overexpressed in a wide variety of carcinomas including breast, ovary, prostate, and lung cancer (1,2). Because HER2 overexpression plays an important role in aggressive tumor behavior and poor clinical outcome (3), early-stage detection and quantification of HER2 is clinically relevant and can be used for selection of optimal therapy for individual patients.
Heat-shock protein 90 (Hsp90) is a molecular chaperone highly expressed in most tumor cells. It is required for the stability and function of many client proteins that promote cancer cell growth and survival (4). Hsp90 inhibitors, by interfering with the chaperone activity, result in targeting of client proteins to the proteasome for degradation. Because HER2 is one of the Hsp90 client proteins, it can be indirectly downregulated by Hsp90 inhibitors such as the naturally occurring ansamycin antibiotic geldanamycin known for its tumoricidal potential (5) or the recently developed 17(dimethylaminoethylamino)-17-demethoxygeldanamycin (17-DMAG), which is a hydrophilic geldanamycin derivative that can be administered orally with good bioavailability and better activity in vitro and in vivo than its predecessor, 17(allylamino)-17-demethoxygeldanamycin (17-AAG) (6). In vivo downregulation of HER2 in human tumor xenografts after treatment with 17-AAG was reported by Smith-Jones et al. (7) and, later, by Orlova et al. (8). These geldanamycin analogs are currently being tested in phase I clinical trials (9).
Thus far, the HER2 expression pattern has been routinely determined by ex vivo analysis of tissue samples using fluorescence in situ hybridization or immunohistochemistry. These methods, although commonly used in clinical practice, have several limitations. Most notably, they require tissue removal from the body, which restricts their analysis only to the sampled parts and may not properly represent the overall tumor characteristics. Variability in scoring between these techniques, whether as a result of true heterogeneity or artifacts in preparation, has led to decreased reliability of the final HER2 status determination (10,11).
Introducing a new methodology for in vivo quantification of HER2 receptors using PET would present a complementary, noninvasive option to obtain real-time information that not only could facilitate selection of patients for HER2-targeted therapy (3,12) but also could provide information on the immediate response to therapeutic interventions, both in primary lesions and in distant metastases. This feedback would allow adjustment of the dose and treatment schedule for individual patients, based on the actual status of the HER2 receptors. PET, with its high sensitivity, high spatial resolution, and proven quantification abilities, could also reduce the number of false-negative or false-positive results from the currently used methods: fluorescence in situ hybridization and immunohistochemistry.
Several molecular probes based on antibodies have recently been tested in experimental animal tumor models, but a PET tracer for routine clinical use has not yet been developed. The clinical application of antibodies (∼150 kDa) to molecular imaging is limited because of their large size, resulting in low tumor penetration and slow clearance. Often, several days are needed to obtain reasonable tumor-to-blood ratios, making most short-lived PET radionuclides inapplicable. Several different ligands have been developed and extensively studied over the last few years to circumvent these problems. Among these ligands are antibody fragments and engineered variants such as F(ab′)2, F(ab′), single-chain Fv, diabodies, and minibodies (13).
Recently, a new class of relatively small (∼6.5 kDa) proteins has become available for studies, and several groups are now using Affibody molecules to image HER2 (14,15) or epidermal growth factor receptor–positive tumors (16). The small size, resulting in rapid blood clearance, good tumor penetration, and high binding affinity to selected targets, makes Affibody molecules ideal candidates for imaging purposes. HER2-specific Affibody molecules, which bind with picomolar affinity to a HER2 epitope distinct from those involved in binding of trastuzumab or pertuzumab, have been labeled with several radioisotopes, including 99mTc, 111In, 68Ga, 90Y, and 125I (8,17–19). A methodology for labeling Affibody molecules with 18F has recently been developed in our laboratory (14,20). We have reported great potential for N-2-(4-18F-fluorobenzamido)ethyl]maleimide (18F-FBEM)–ZHER2:342 Affibody molecules in the in vivo monitoring of HER2 expression by PET. Cheng et al. (15) used a similar approach to test various clones of anti-HER2 Affibody molecules and obtained comparable results.
In the current study, we tested the hypothesis that the use of 18F-FBEM–ZHER2:342 Affibody molecules would enable quantitative assessment of HER2 downregulation after anti-HER2 therapy. To our knowledge, we are the first to show that semiquantitative analysis of PET data can be used to assess different levels of HER2 expression and to monitor changes in expression in response to 17-DMAG treatment in mice bearing xenograft tumors.
MATERIALS AND METHODS
General
Unless otherwise specified, all reagents were of analytic grade and were obtained from commercial sources. The ZHER2:342–Cys Affibody molecules were kindly provided by our Cooperative Research and Development Agreement partner in Sweden (Affibody AB). 18F radionuclide was produced via the 18O(p,n)18F nuclear reaction in the Clinical Center of the National Institutes of Health cyclotron facility by irradiating 18O-enriched water. 18F-FBEM–ZHER2:342 Affibody was prepared as previously described (20). 17-DMAG was purchased from InvivoGen as lyophilized purple powder and reconstituted with 0.9% sodium chloride for injection.
Cell Lines
Human breast (BT474, MDA-MB-361, MCF7, and MDA-MB-468) cancer cell lines that express different levels of HER2 were purchased from the American Type Culture Collection. The breast cancer cell line stably transfected with HER2 (MCF7/clone18) was kindly provided by Drs. John W. Park and Byron Hann, University of California, San Francisco. The cells were cultured in RPMI 1640 medium (BT474 and MDA-MB-468) and in Dulbecco modified Eagle medium (MCF7, MDA-MB-361, and MCF7/clone18) supplemented with 10% (v/v) heat-inactivated fetal bovine serum (GIBCO) and penicillin/streptomycin (a 100 U/mL concentration of each). Cells were grown as a monolayer at 37°C in a humidified atmosphere containing 5% CO2. In the case of MCF7/clone18 transfectants, the culture medium also contained 400 μg of Geneticin (GIBCO) per milliliter.
Tumor Model
All animal studies were conducted in accordance with the principles and procedures outlined in the Guide for the Care and Use of Laboratory Animals (21) and were approved by the Institutional Animal Care and Use Committee of the National Institutes of Health. Cells suspended in Matrigel (BD Bioscience) were implanted subcutaneously into the shoulder region of 5- to 7-wk-old female athymic nude mice: 4.5 × 10⁶ MDA-MB-361, MCF7, MDA-MB-468, or MCF7/clone18 cells or 5.5 × 10⁶ BT474 cells. Estrogen pellets (1.72 mg; Innovative Research of America) were implanted 48 h before tumor cell inoculation and remained in place until the end of the study. Tumors (100–250 mg) developed after 3–5 wk. The mice were treated with 4 doses (intravenous, 40 mg/kg) of 17-DMAG, an inhibitor of Hsp90, to monitor the downregulation of HER2 receptors. The animals were dosed at 12, 36, 48, and 60 h after the first PET scan and then were imaged again before 72 h.
Biodistribution Studies
18F-FBEM–ZHER2:342 Affibody (3.7–4.4 MBq, 3.4–4.0 μg, 100 μL) was injected into the tail vein of mice bearing BT474 and MCF7/clone18 tumors. Groups of 6–7 mice were sacrificed, and their major organs were dissected and weighed 2 h after injection. The radioactivity uptake in the tissues was measured, along with a standard of the injected dose, using a γ-counter. The results were expressed as percentage injected dose (%ID) per gram of tissue.
PET Studies
The mice were anesthetized using isoflurane/O2 (1.5%−5% v/v), placed prone in the center of the field of view of the scanner, and given an injection of 18F-FBEM–ZHER2:342 Affibody (3.7–4.4 MBq, 3.4–4.0 μg, 100 μL) via the tail vein. PET scans were performed using the Advanced Technology Laboratory Animal Scanner (ATLAS) (22). Whole-body (4 bed positions, each 15 min) or dynamic data acquisition (6 or 12 frames, 10 min per frame) was started about 2 min after radiotracer injection and was recorded with a 100- to 700-keV energy window. In some cases, additional static scans (15 min) were obtained 1 h after tracer injection. The choice of time points was based on previous studies in which uptake maximized at 1 h after injection and then maintained a plateau until 2 h (14). The images were reconstructed by a 2-dimensional ordered-subsets expectation maximum algorithm, and no correction was applied for attenuation or scatter. For each scan, regions of interest were drawn over the tumor, normal tissue, and major organs. The maximum counts per pixel within the tumor or organs were obtained from the multiple regions of interest (counts/s/cm3). The results were calculated as %ID/g by means of a calibration constant obtained from scanning the 18F source of known activity, assuming a tissue density of 1 g/mL, and dividing by the injected dose, decay-corrected to the time of scanning.
Fluorescence-Activated Cell Sorter (FACS) Analysis
Subconfluent cell cultures were incubated with 50 μg of Affibody molecules per microliter or just with growth medium before fixation for 1 h at 37°C. Then, the cells were washed twice with phosphate-buffered saline (PBS−) and detached with Cellstripper (Cellgro). For every sample, 1 × 10⁶ cells were collected, fixed with 4% formaldehyde, and incubated for 1 h on ice. The cells were then washed 3 times with PBS− and resuspended in stain buffer (PBS− plus 5% fetal bovine serum and 0.5% Triton X-100 [Union Carbide]). Subsequently, the cells were covered and incubated on ice for 30 min, and afterward the appropriate dilution of goat–anti-Affibody antibody was added for 45 min to cells treated beforehand with Affibody molecules. The cells were then washed once and resuspended in 200 μL of stain buffer, followed by a 30-min incubation with secondary rabbit-antigoat-AlexaFluor488 conjugated antibody (Molecular Probe). For HER2 detection, cells, after permeabilization, were incubated for 45 min with antimouse Neu(24D2)-fluorescein isothiocyanate monoclonal antibody or with IgG1-fluorescein isothiocyanate mouse isotypic control (Santa Cruz Biotechnology, Inc.).
After antibody staining, all cells were washed with stain buffer 2 times and resuspended in 300 μL of PBS− for data acquisition. All solutions were kept on ice.
Flow cytometry was done using a FACS Calibur instrument (BD Biosciences). CellQuest Pro software was used for data acquisition and FlowJo software for analysis (Tree Star Inc.). For each sample, 10,000 events were recorded, and the population corresponding to single cells was gated and analyzed as a histogram plot.
Enzyme-Linked Immunosorbent Assay (ELISA)
Cell Lysates.
The cell cultures were harvested by Cellstripper and washed 3 times in PBS to determine the HER2 protein level in cell lines. Then, the cell pellets were resuspended in a proper amount of resuspension buffer provided with the ELISA kit (Calbiochem). For each 100 μL of cell suspension, 20 μL of antigen extraction agent (also provided with the kit) were added, and the cells were incubated at 4°C for 20 min with gentle agitation and then centrifuged at 13,000 rpm for 15 min. The supernatant was collected and stored at −80°C.
Preparation of Tumor Tissue.
The mice were sacrificed by cervical dislocation, and the tumors were isolated, frozen on dry ice, and stored at −80°C. Afterward, the specimens were weighed and sliced into small pieces. Then, tumor tissue was homogenized on ice, using a Polytron homogenizer, and lysed in resuspension buffer provided with the ELISA kit. Cell debris was removed through centrifugation of the suspensions at 13,000 rpm (4°C) for 15 min. The supernatants were collected and stored at −80°C. Before use, the protein concentration was estimated by the bicinchoninic acid assay kit (Pierce), according to the manufacturer's protocol. The HER2 protein level was measured by an ELISA kit, according to the manufacturer's recommended procedure. Results are expressed in nanograms of HER2 per milligram of protein. The data are presented as the mean of 2 replicates, with each experiment repeated 3 times.
Western Blot Analysis
All reagents for NuPAGE and Western blots were from Invitrogen. Total cellular protein (30 μg for all analyses) was mixed with sample buffer and incubated at 70°C for 10 min. Thirty-microliter aliquots were resolved on 4%−12% NuPAGE Novex tris-acetate gel by electrophoresis. Thereafter, proteins were transferred to a nitrocellulose membrane, which was subsequently blocked for 1 h at room temperature with 5% nonfat milk blocking buffer and then incubated with rabbit polyclonal antibody (anti-HER2) or a loading control, the mouse monoclonal antibody anti-α-Tubulin (clone DM1A) (Cell Signaling Technology), at 4°C overnight. After extensive washing with tris-buffered saline tween, membranes were incubated with the secondary antibodies HRP-conjugated goat antirabbit and antimouse IgG1 for 1 h at room temperature. After final washing, proteins were visualized with a chemiluminescence detection system (Pierce) and subsequent exposure to the Kodak Molecular Imaging System. Protein band densities were analyzed using the spot density analysis software provided with the image station.
Immunohistochemical Detection of HER2
HER2 was analyzed immunohistochemically in paraffin sections using HercepTest, a Food and Drug Administration–approved assay for identification of tissue overexpressing p185 HER2 (K5205; Dako), in accordance with the manufacturer's protocol and scoring guidelines. The percentage of positive tumor cells was determined by experienced pathologists from the Pathology/Histotechnology Laboratory of the National Cancer Institute at Frederick.
Statistical Analysis
Data are presented as mean ± SD. Statistical comparisons were made using the Student t test. A P value of less than 0.05 was considered significant.
RESULTS
Association Between Tracer Uptake and HER2 Expression
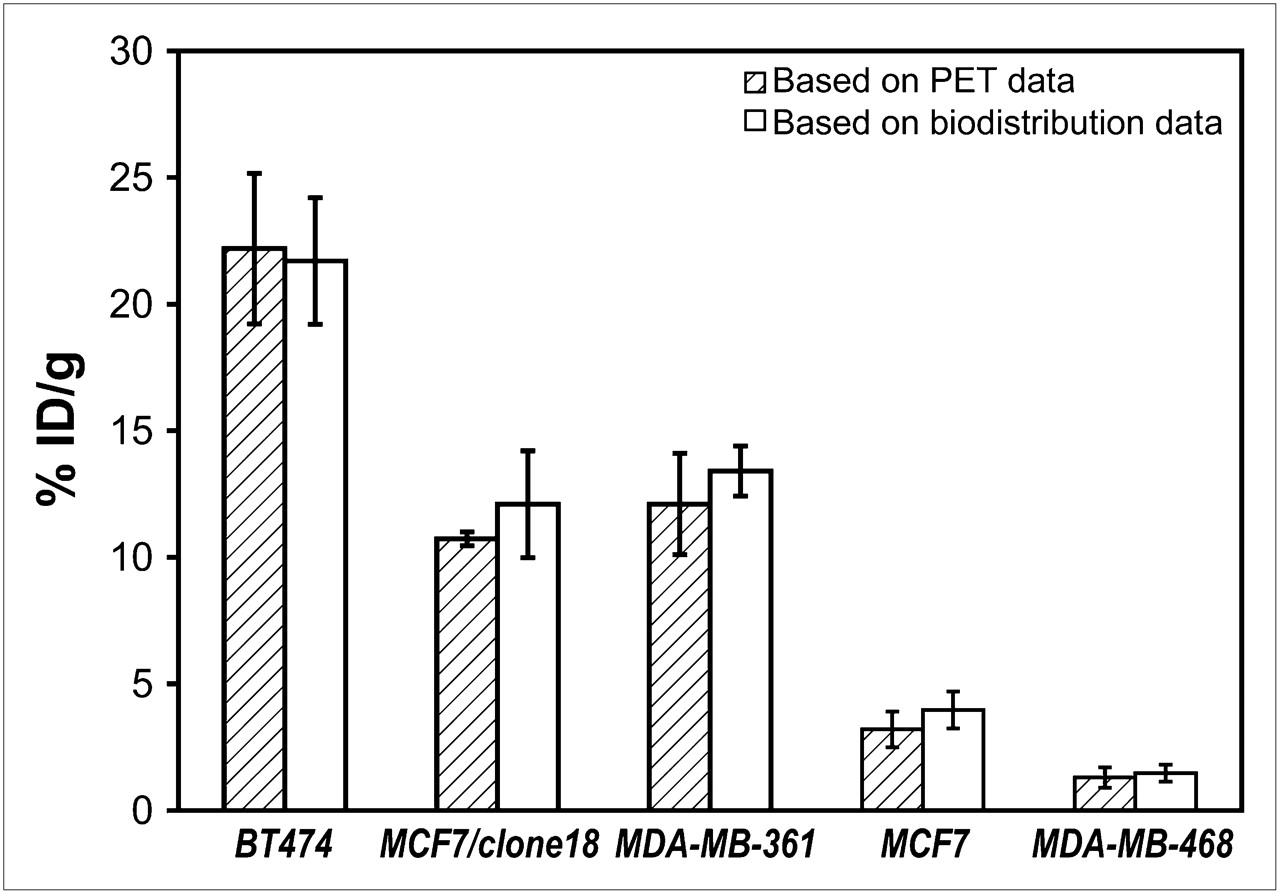
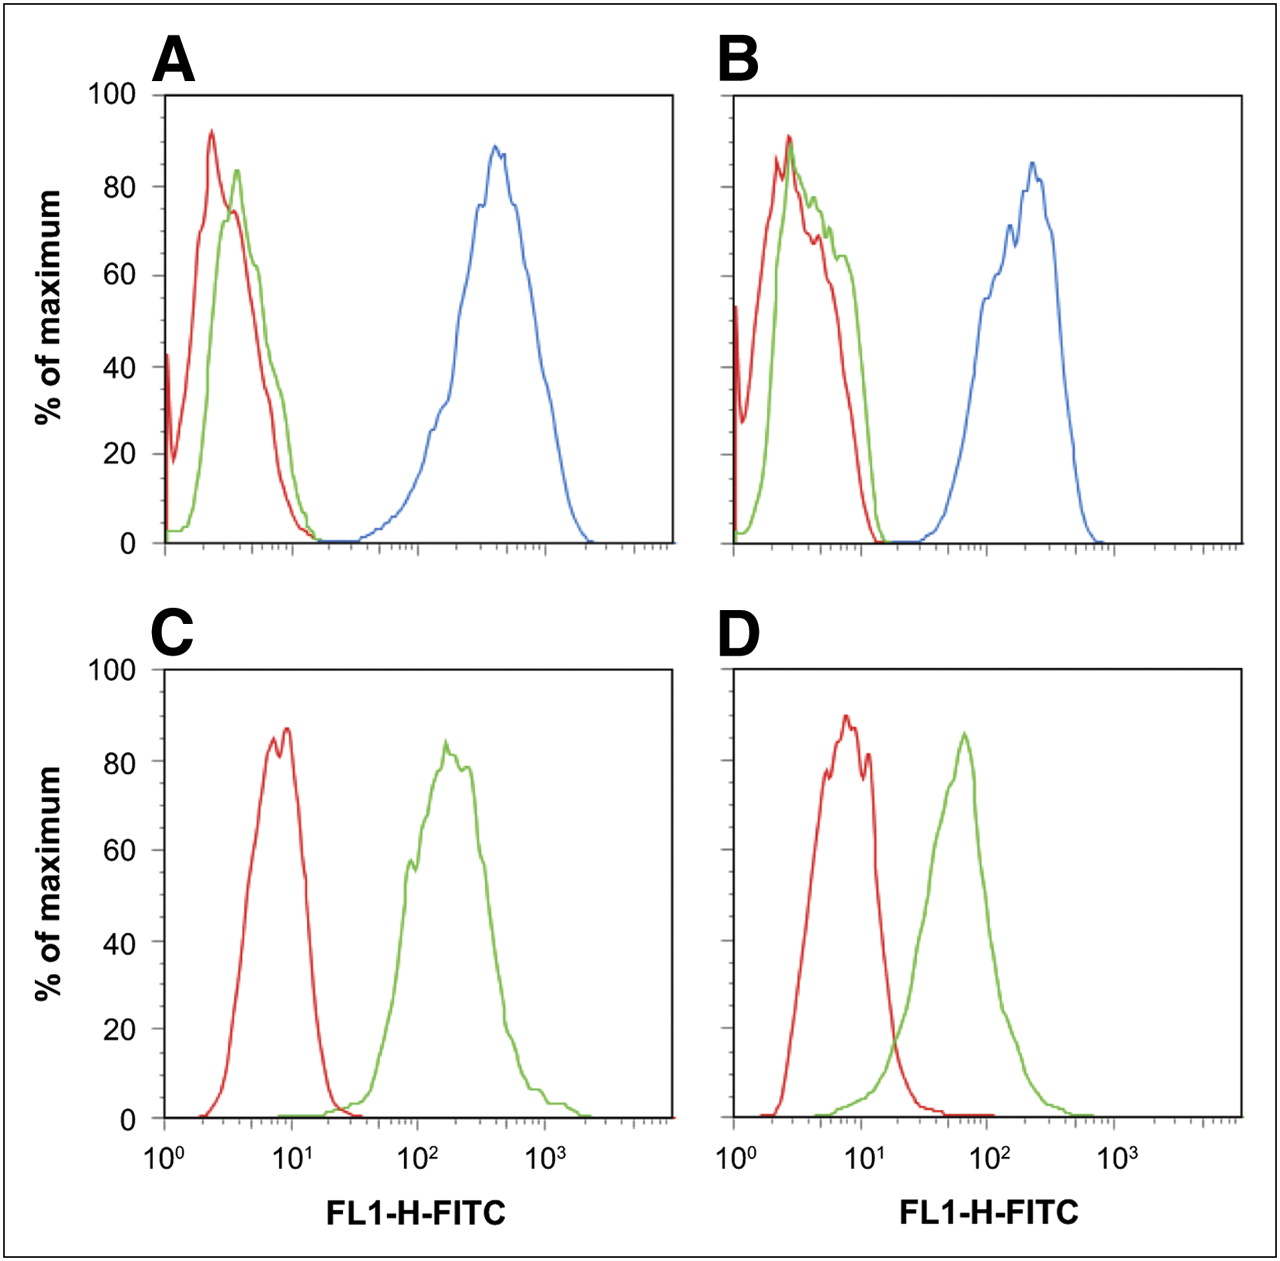
To assess the correlation between 18F-FBEM–ZHER2:342 Affibody uptake and HER2 receptor density in vivo, we administered the tracer into mice bearing subcutaneous tumors with 5 levels of HER2 expression: BT474 (very high), MCF7/clone18 (high), MDA-MB-361 (medium), MCF7 (low), and MDA-MB-468 (negative). For all animals, 15-min static images were recorded 1 h after tracer injection. Afterward, tumor uptake was evaluated by semiquantitative analysis of PET images and confirmed by the biodistribution studies (Fig. 1). Good agreement was found between the results obtained by these 2 methods. These results also correlated well with the HER2 density corresponding to each particular tumor model, except for MCF7/clone18, for which the specific uptake of 18F-FBEM–ZHER2:342 Affibody was much lower than we expected, based on ex vivo analysis of HER2 expression as measured in the cells and tissue lysates by ELISA (Table 1). Because this discrepancy could result from a different affinity of tracer binding to MCF7/clone18 cells, we checked 18F-FBEM–ZHER2:342 Affibody binding to MDA-MB-361 and MCF7/clone18 cells in vitro by FACS analysis (Fig. 2). The results showed higher binding of Affibody molecules to MCF7/clone18 than to MDA-MB-361 cells. These data corresponded to the HER2 expression measured in in vitro and ex vivo samples by ELISA and FACS, suggesting that the lower than expected observed accumulation of the tracer in MCF7/clone18 tumors is not caused by receptor-binding characteristics but most likely by differences in tumor microenvironment.

Comparison of quantification results obtained from PET region-of-interest analysis of tumors with different HER2 expression and direct γ-counter measurements, 1 h after 18F-FBEM–ZHER2:342 Affibody injection (n = 4–6).

Flow cytometry histograms of HER2 receptor expression on MCF7/clone18 (A) and MDA-MB-361 (B) cell lines and of Affibody molecule binding to MCF7/clone18 (C) and MDA-MB-361 (D) cell lines. Each experiment was repeated 3 times; a representative histogram is shown for each cell line. Red curves in A and B correspond to nonstained control cells, green to isotypic control, and blue to HER2. In C and D, red curves correspond to isotypic control and green to Affibody binding.
Expression of HER2 in Breast Carcinoma Cells and Tissue Lysates
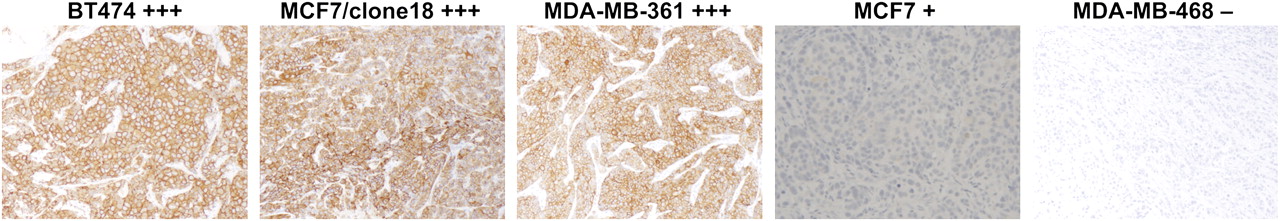
To check the feasibility of PET analysis as complementary to immunohistochemistry in routine clinical application, we also analyzed the same tissue samples by a standard immunostaining assay, HercepTest, according to score guidelines. Images of representative tumor cryosections stained for HER2 expression are shown in Figure 3. The receptor expression was found to be relatively homogeneous throughout the field of the sections. The immunohistochemistry scores were +3 for BT474, MCF7/clone18, and MDA-MB-361 cell lines and +1 for MCF7; MDA-MB-468 cells were assessed as HER2-negative.

Immunohistochemical visualization of HER2 receptors in breast cancer tissues with different HER2 expression. HercepTest score for each cell line is shown.
Studies of Tracer Distribution
Two-hour dynamic studies on mice bearing BT474 tumors were done to assess the kinetics of 18F-FBEM–ZHER2:342 Affibody accumulation in the tumors. The results showed that high-contrast PET image data can be collected 1 h after tracer injection. At that time, tumors were clearly distinguishable and tumor accumulation was the dominant feature. The biodistribution of the radioactivity 2 h after tracer injection was studied in mice bearing BT474, MCF7/clone18, and MCF7 tumors through monitoring by PET. The results agreed with previously published data (14). The biodistribution of the tracer as determined by γ-counter (Fig. 4) showed a high activity accumulation in BT474 tumors (21.3 ± 3.7 %ID/g) and in MCF7/clone18 tumors (14.8 ± 2.0 %ID/g) and was clearly lower (P < 0.004) in MCF7 tumors (4.2 ± 0.7 %ID/g). The highest normal-tissue concentration of radioactivity was found in the kidneys. However, uptake of 18F-FBEM–ZHER2:342 Affibody was significantly lower in the kidneys than in the tumors of BT474 and MCF7/clone18 tumor-bearing mice and corresponded to 11.1 ± 2.7 %ID/g (P < 0.02) and 5.8 ± 2.1 %ID/g (P < 0.0002), respectively. Even for MCF7 tumor-bearing mice, the signal detected in the tumors and in the kidneys, although less pronounced because of the low expression of HER2 receptors on those tumors (Table1), was significantly different (P < 0.05). Representative dynamic and whole-body coronal images of mice bearing xenografts with different HER2 expression are shown in Figure 4. Images with high tumor-to-background contrast were recorded for BT474 tumors, and it was still possible to detect MCF7 tumors with low HER2 expression.

Representative coronal images obtained from 1-h dynamic study (A), coronal images obtained from whole-body study (B), and graph of biodistribution study (C) 2 h after 18F-FBEM–ZHER2:342 Affibody molecule injection in nude mice carrying xenografts with different levels of HER2 expression (n = 6–7).
Monitoring Changes in HER2 Expression in Response to 17-DMAG
The effect of therapeutic regimens on HER2 expression after 17-DMAG treatment was compared in mice bearing BT474 and MCF7/clone18 tumors.
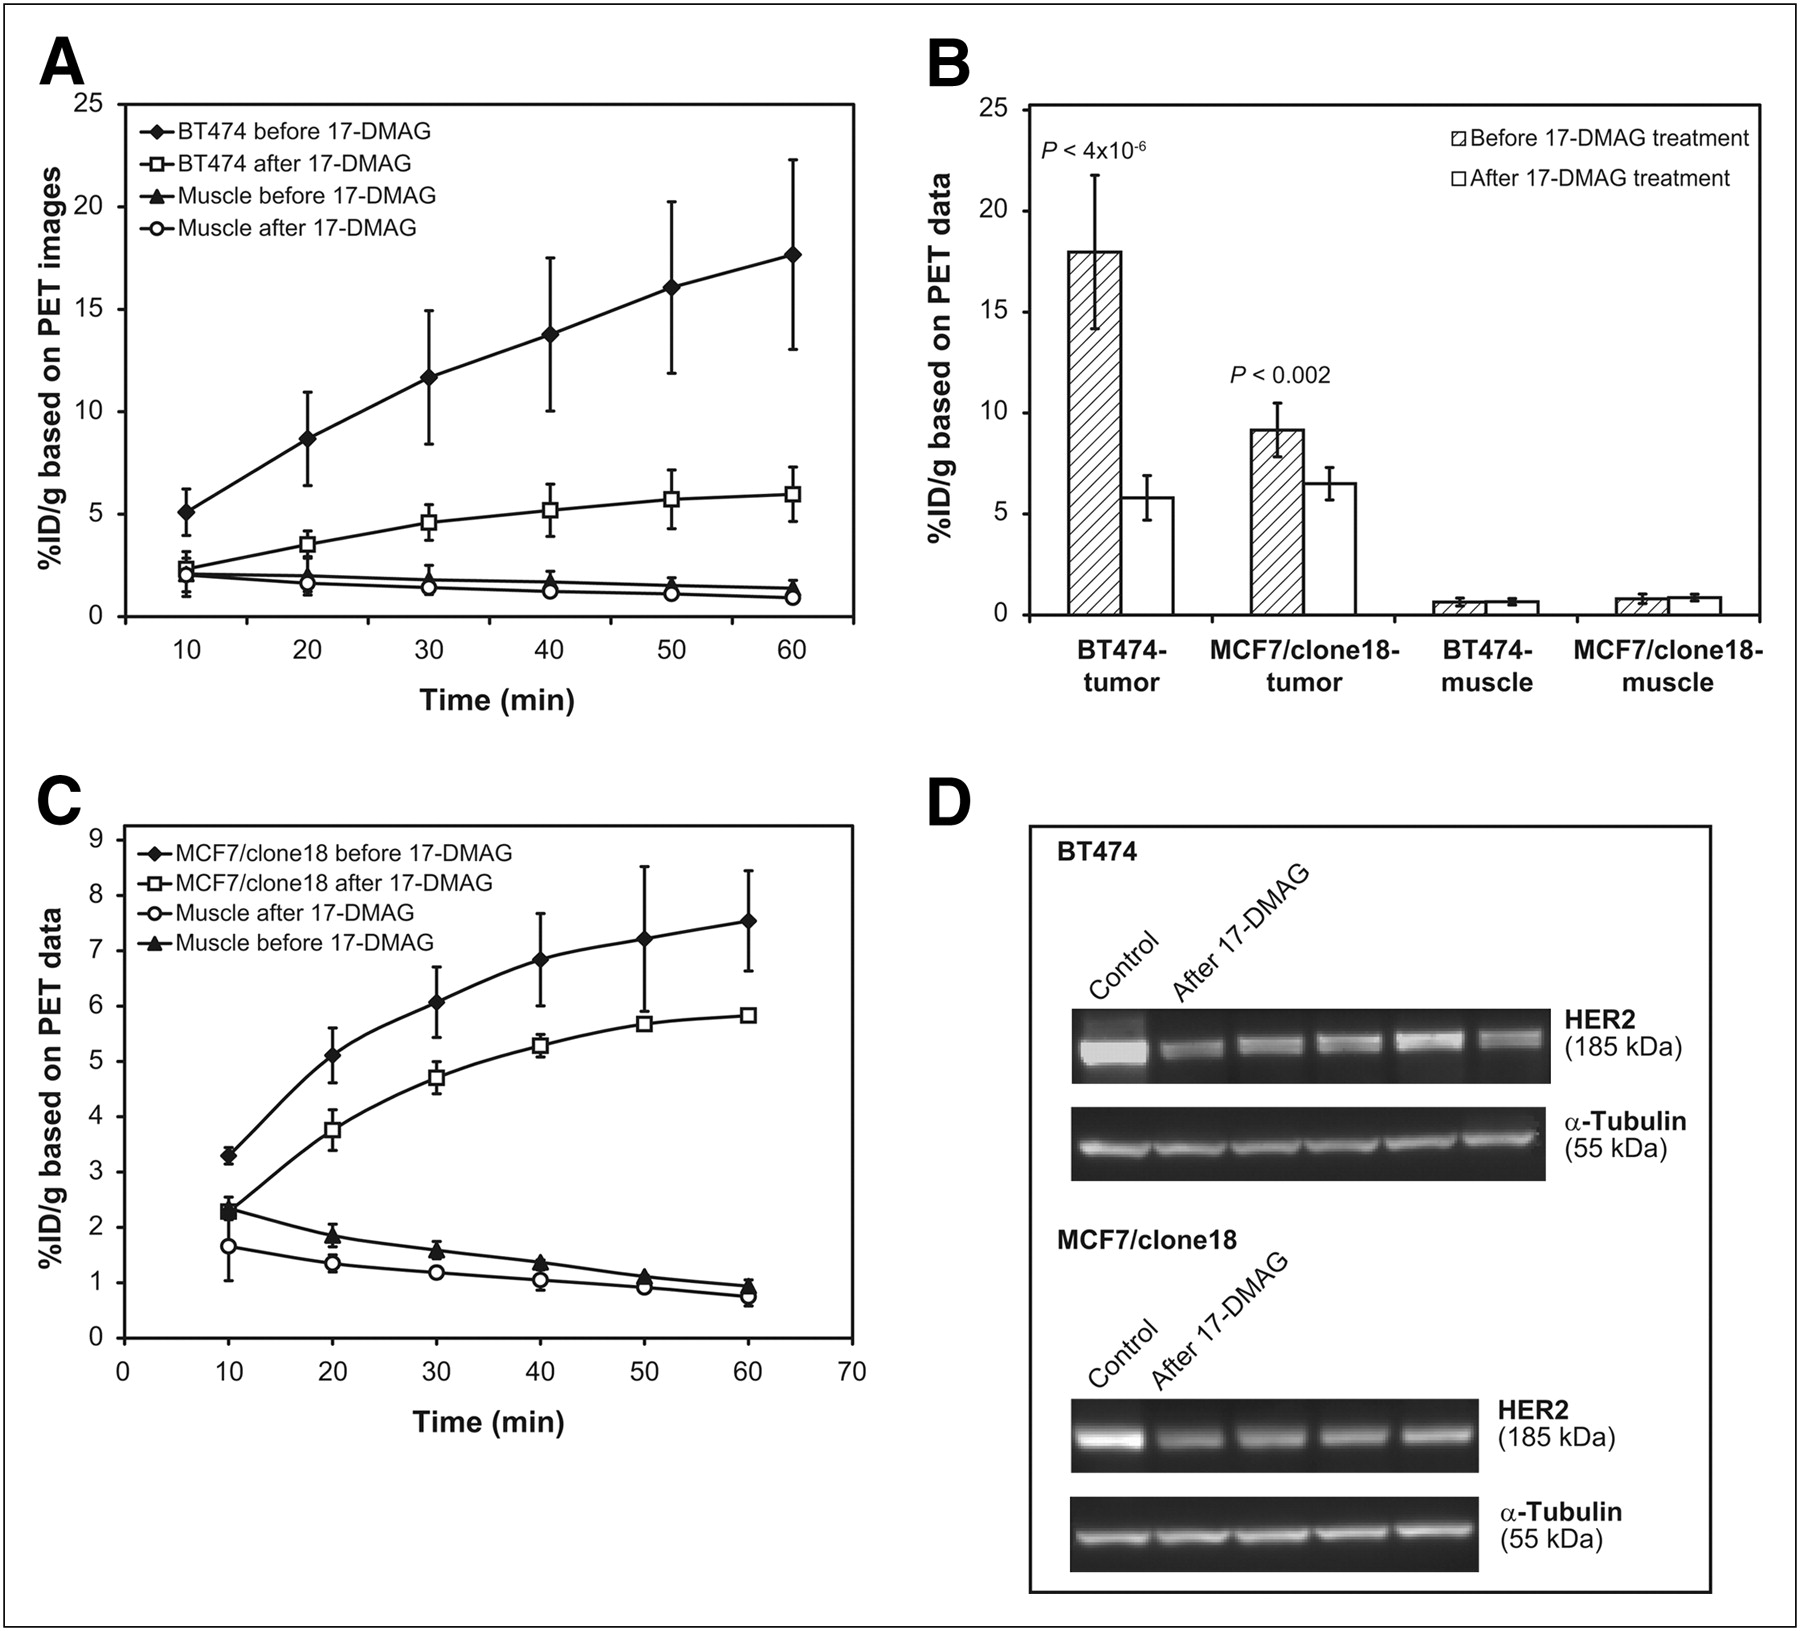
Dynamic scanning was performed by acquiring a continuous series of 6 frames after tracer injection before and after 17-DMAG treatment. Next, 15-min static images were taken. In each case, a region of interest was placed around the tumor and muscle tissue and a time–activity curve or radioactivity concentration was calculated (Fig. 5). We decided to use maximal tumor uptake instead of mean tumor uptake, because the maximal tumor uptake measurement is free of user-dependent variation in defining regions of interest and is less susceptible to the effects of the necrosis that appears when tumors grow or respond to treatment during the monitoring time. Interestingly, based on image contrast, no particular differences in tumor uptake were observed before and after treatment (even though the animals received a high dose of the drug). However, the subsequent numeric analysis of recorded images clearly showed different 18F-FBEM–ZHER2:342 Affibody accumulations, confirming that the HER2 receptor expression had declined, compared with the pretreatment level. After 4 doses of 17-DMAG (40 mg/kg), tracer uptake was 71% lower (P < 4 × 10⁻⁶) in animals bearing BT474 tumors than in nontreated animals. The tumor response was less effective in mice bearing MCF7/clone18 tumors (only a 33% decrease, P < 0.002). Final uptake of the tracer, determined by analysis of the images, was the same for both tumor models. To confirm these data, HER2 expression in the tissues extracted from the same tumors was also measured ex vivo by ELISA, immunoblot analysis, and an immunostaining assay using HercepTest. The numeric analysis is presented in Table 2, and the representative Western blots for BT474 and MCF7/clone18 tumor models are shown in Figure 5. In this case, we also obtained some unexpected results. According to the immunohistochemistry results, BT474 tumors expressing a high level of HER2 protein showed the same strong membrane and cytoplasmic staining corresponding to a score of 3+ before and after treatment, whereas ex vivo analyses of BT474 tumor tissue lysates by Western blot and ELISA indicated that treatment with 17-DMAG resulted in significant downregulation of HER2 protein.

Monitoring of effect of 17-DMAG on HER2 expression in mice bearing BT474 and MCF7/clone18 tumors. (A and C) Time–activity curves for tumor and muscle before and after 17-DMAG treatment in mice bearing BT474 tumors (A) and MCF7/clone18 tumors (C) (60-min dynamic studies; each frame, 10 min). (B) Analysis of 15-min static images after dynamic studies. (D) Western blots of HER2 in BT474 and MCF7/clone18 tissue lysates before (control; left lane) and after (remaining lanes) treatment of mice with 17-DMAG. α-Tubulin was used as loading marker.
Numeric Analysis of HER2 Expression Levels Obtained by Different Methods Before and After 17-DMAG Treatment
DISCUSSION
Molecular imaging of specific markers may provide information on both the expression of targeted molecules and the early assessment of response to a particular therapeutic intervention. Particularly PET, as a functional imaging technology, can provide rapid, reproducible, and noninvasive in vivo assessment of the receptor expression. Radioligands for in vivo imaging of HER2 by PET have been developed by several groups. Robinson et al. labeled a divalent antibody (C6.5) fragment with 124I and showed that it could be used for the imaging of HER2-positive tumors with a clinical PET/CT scanner (23). Garmestani et al. labeled intact trastuzumab with 86Y or 111In (24), whereas Olafsen et al. used trastuzumab to create a minibody and labeled it with 64Cu (25). The resulting radioconjugate was successfully applied to image HER2 in tumor xenografts by small-animal PET. Smith-Jones et al. used an F(ab′)2 fragment of trastuzumab labeled with 68Ga for PET (7). Their report presents the first attempt to monitor in vivo changes of HER2 expression after therapeutic intervention.
Many reports describing the application of Affibody molecules for imaging and therapy of HER2-positive tumors have been published by the Swedish group (8,26–28). To our knowledge, we were the first to independently confirm the uniquely advantageous characteristics of these molecules as a HER2 targeting agent, especially for diagnostic application. By labeling the Affibody molecule containing a C-terminal cysteine (ZHER2:342-Cys) with 18F, we have created a new tracer that will allow the application of a well-established PET methodology to quantify HER2 expression in vivo. As described in our recent publication (14), the elimination half-life of about 36 min and high accumulation of the radioactivity in HER2-positive tumors, as compared with the background, facilitated the imaging studies. Our findings were then confirmed by Cheng et al., who also labeled Affibody molecules with 18F (15).
In this work, we have tested the sensitivity of our approach combining 18F-labeled Affibody molecules and the PET technique to detect differences in HER2 expression levels and to monitor changes in HER2 expression after therapeutic intervention. To assess the correlation of signal observed by PET with receptor expression, we administered the new tracer to athymic nude mice bearing subcutaneous tumors with 5 levels of HER2 expression. The results showed that 18F-FBEM–ZHER2:342 Affibody rapidly accumulated in HER2-positive tumors and was eliminated quickly from the blood and normal tissues, providing high tumor-to-blood and tumor-to-muscle ratios as soon as 20 min after injection. Notably, it was also possible to detect MCF7 tumors expressing a low level of HER2. The only other organs with higher accumulation than the tumors were the kidneys, indicating that clearance occurred exclusively via the renal tract. However, for monitoring breast tumors and even distant metastasis (except for adrenal and liver), reconstruction artifacts resulting in difficulties visualizing target will be negligible.
Semiquantitative PET analysis of tumors showed that the signal recorded by PET depended on the number of receptors expressed in those particular cell lines, as assessed by ex vivo methods. We found that PET data analysis corresponds well with the biodistribution results for each studied tumor model and depended on the HER2 expression, except for MCF7/clone18. The level of tracer binding in vivo in these tumors was comparable to the binding obtained in MDA-MB-361 xenografts (Fig. 1) despite the fact that the receptor expression in the latter was 3-fold lower (Table 1). In vitro FACS analysis of cell lysates (Fig. 2) showed that this divergence could not be explained by lower affinity of Affibody molecules to MCF7/clone18 cells. A similar discrepancy was observed by McLarty et al. (29). In these studies, the radioactivity uptake in MCF7/clone18 xenografts after injection of 111In-DTPA-trastuzumab was 2-fold lower than that observed in MDA-MB-361 cells, suggesting a nonlinear relationship between the imaging data and the actual concentration of the receptors. The authors also showed that the correlation can be disturbed by nonspecific binding. In our recent work, we investigated nonspecific binding of 18F-FBEM–ZHER2:342 Affibody in both HER2-positive tumors after presaturation of the receptors with nonlabeled Affibody and HER2-negative tumor xenografts (14). Because our results showed the same level of binding in both cases, we assumed that nonspecific binding should be similar for other subcutaneous tumor xenografts and we decided to forego these experiments in the present work. It is likely that the lower than expected accumulation of radioactivity in MCF7/clone18 tumors could be due to vascular and microenvironmental abnormalities leading to inefficient penetration of the tracer. More rigorous PET studies allowing multicompartment kinetic analysis of the data might circumvent this problem.
Concluding that the signal from our tracer detected by PET in tumor tissue depends on different levels of HER2 expression, we moved on to evaluate its utility in monitoring changes in HER2 expression after treatment. It is known that 17-AAG and 17-DMAG cause downregulation of HER2 by interfering with the protective chaperone activity of Hsp90. Thus, to induce downregulation of HER2 in human breast cancer xenografts, we gave the animals 4 doses of 17-DMAG. This treatment, as applied to BT474 and MCF7/clone18 tumor-bearing mice, resulted in, respectively, 71% and 33% decreases in HER2 expression as observed by PET. Essentially the same reduction was observed by ex vivo assays, indicating that PET represents an attractive, noninvasive alternative for monitoring therapy effects on HER2 expression and for optimizing the treatment schedule for individual patients. The results obtained for BT474 agreed well with the pharmacodynamic data previously reported by Smith-Jones et al. (7), who used 17-AAG and the same tumor model. Their study demonstrated an 80% reduction in HER2 expression in BT474 xenografts, which lasted approximately 36 h, after which recovery in expression was observed. The same group has shown that downregulation of HER2, as measured by decreased uptake of F(ab′)2 fragments of trastuzumab, was more predictive than 18F-FDG PET of a response to 17-AAG therapy in mice (30). Orlova et al. (8), using 111In-DOTA-ZHER2:342-pep2, observed a 2.3- to 3.4-fold decrease of signal from tumor volume on γ-camera images of mice bearing SKOV-3 tumors treated with 17-AGG.
We are not aware of any reports comparing the immunohistochemistry analysis with the more quantitative global ex vivo analysis of HER2 expression. Our studies indicated a significant discrepancy between the results obtained by HercepTest and ELISA or Western blot. For example, the pathology report based on guideline scores for HercepTest listed MDA-MB-361 tumors as 3+ HER2-positive, even though our detailed ex vivo analysis showed a medium level of receptor expression, suggesting that the score should be 2+. Similar disagreement between immunohistochemistry scoring of HER2 expression using ELISA and Western blot was observed in BT474 tumors treated with 17-DMAG. Strong membrane and cytoplasmic staining corresponding to a score of 3+ was seen on both treated and nontreated tumors, whereas ex vivo analyses of the same tissues indicated that 17-DMAG caused a significant decrease of HER2 expression in the treated tumors. This inconsistency indicated that immunohistochemistry analysis has a subjective character that can be further distorted by the heterogeneity of HER2 expression in individual tumors.
Our approach using PET for in vivo assessment of HER2 expression may assist diagnosis of breast cancer and improve the outcome of HER2-targeted therapies. Immunohistochemistry and fluorescence in situ hybridization analyses are usually restricted to a limited tissue sample obtained at a single time. After initial diagnosis, follow-up biopsies are routinely not performed, and currently, there is no means to obtain information on how long it takes a therapeutic agent such as Herceptin to reach the target, how effective it is, and how long its effect lasts. Moreover, the high level of discordance between these 2 methods has been documented in several studies (31,32). Discordance rates may be as high as 20% when HER2 testing is performed in low volume and at local laboratories (33). As we have shown in this work, PET using 18F-labeled Affibody molecules was sufficiently sensitive to detect a 2- to 3-fold decrease in HER2 expression, whereas immunohistochemistry not only was less sensitive but also misclassified some tumors with intermediate levels of HER2 as highly overexpressing. Such inaccurate estimates of HER2 expression by immunohistochemistry analysis might lead to misdiagnosis and severe clinical consequences. Therefore, PET may provide a considerable advantage and become an attractive alternative for assessing HER2 expression quantitatively, objectively, and noninvasively, allowing several scans to be performed over the course of therapy.
CONCLUSION
Our results indicate that HER2 expression in vivo and its possible changes in response to therapeutic interventions can be monitored by PET using 18F-FBEM–ZHER2:342 Affibody. This approach represents an attractive, noninvasive alternative for monitoring therapeutic effects on HER2 expression and for optimizing the treatment schedule for individual patients.
Acknowledgments
We appreciate the support of experts from Affibody AB and SAIC Frederick, Inc.; the technical assistance of Yesenia Rodriguez and Aliesia Holly; and constructive discussions with Lucia Martiniova and one of the creators of ATLAS, Jürgen Seidel. The content of this publication does not necessarily reflect the views or policies of the Department of Health and Human Services, nor does mention of trade names, commercial products, or organizations imply endorsement by the U.S. government. This research was supported in part by the Center for Cancer Research (an intramural research program of the National Cancer Institute), the National Institute of Biomedical Imaging and Bioengineering, a Breast Cancer Research Stamp Fund awarded through competitive peer review, and federal funds from the National Cancer Institute, National Institutes of Health (contracts N01-CO-12400 and N01-CO-12401).
Footnotes
-
COPYRIGHT © 2009 by the Society of Nuclear Medicine, Inc.
References
- Received for publication September 1, 2008.
- Accepted for publication December 19, 2008.


Jump to section
Related Articles
Cited By...
- Affibody-Based PET Imaging to Guide EGFR-Targeted Cancer Therapy in Head and Neck Squamous Cell Cancer Models
- HER3-Mediated Resistance to Hsp90 Inhibition Detected in Breast Cancer Xenografts by Affibody-Based PET Imaging
- Preclinical and clinical applications of specific molecular imaging for HER2-positive breast cancer
- Preclinical Evaluation of 18F-Labeled Anti-HER2 Nanobody Conjugates for Imaging HER2 Receptor Expression by Immuno-PET
- In Vivo Fluorescence Lifetime Imaging for Monitoring the Efficacy of the Cancer Treatment
- Positron Emission Tomography Imaging with 18F-Labeled ZHER2:2891 Affibody for Detection of HER2 Expression and Pharmacodynamic Response to HER2-Modulating Therapies
- Three Methods for 18F Labeling of the HER2-Binding Affibody Molecule ZHER2:2891 Including Preclinical Assessment
- Interrogating Tumor Metabolism and Tumor Microenvironments Using Molecular Positron Emission Tomography Imaging. Theranostic Approaches to Improve Therapeutics
- 18F-Fluorobenzoate-Labeled Cystine Knot Peptides for PET Imaging of Integrin {alpha}v{beta}6
- Cholesterol Loading and Ultrastable Protein Interactions Determine the Level of Tumor Marker Required for Optimal Isolation of Cancer Cells
- PET of HER2-Positive Pulmonary Metastases with 18F-ZHER2:342 Affibody in a Murine Model of Breast Cancer: Comparison with 18F-FDG
- Potential of PET to Predict the Response to Trastuzumab Treatment in an ErbB2-Positive Human Xenograft Tumor Model
- ErbB-2 Blockade and Prenyltransferase Inhibition Alter Epidermal Growth Factor and Epidermal Growth Factor Receptor Trafficking and Enhance 111In-DTPA-hEGF Auger Electron Radiation Therapy
- Evaluation of the Anti-HER2 C6.5 Diabody as a PET Radiotracer to Monitor HER2 status and Predict Response to Trastuzumab Treatment
- Targeting of HER2-Expressing Tumors Using 111In-ABY-025, a Second-Generation Affibody Molecule with a Fundamentally Reengineered Scaffold
- Molecular Imaging of HER2-Expressing Malignant Tumors in Breast Cancer Patients Using Synthetic 111In- or 68Ga-Labeled Affibody Molecules
- Micro-SPECT/CT with 111In-DTPA-Pertuzumab Sensitively Detects Trastuzumab-Mediated HER2 Downregulation and Tumor Response in Athymic Mice Bearing MDA-MB-361 Human Breast Cancer Xenografts
- Aiming for a Direct Hit: Combining Molecular Imaging with Targeted Cancer Therapy