


Abstract
The aim of chemotherapy for mesothelioma is to palliate symptoms and improve survival. Measuring response using CT is challenging because of the circumferential tumor growth pattern. This study aims to evaluate the role of serial 18F-FDG PET in the assessment of response to chemotherapy in patients with mesothelioma. Methods: Patients were prospectively recruited and underwent both 18F-FDG PET and conventional radiological response assessment before and after 1 cycle of chemotherapy. Quantitative volume-based 18F-FDG PET analysis was performed to obtain the total glycolytic volume (TGV) of the tumor. Survival outcomes were measured. Results: Twenty-three patients were suitable for both radiological and 18F-FDG PET analysis, of whom 20 had CT measurable disease. After 1 cycle of chemotherapy, 7 patients attained a partial response and 13 had stable disease on CT assessment by modified RECIST (Response Evaluation Criteria in Solid Tumors) criteria. In the 7 patients with radiological partial response, the median TGV on quantitative PET analysis fell to 30% of baseline (range, 11%–71%). After 1 cycle of chemotherapy, Cox regression analysis demonstrated a statistically significant relationship between a fall in TGV and improved patient survival (P = 0.015). Neither a reduction in the maximum standardized uptake value (P = 0.097) nor CT (P = 0.131) demonstrated a statistically significant association with patient survival. Conclusion: Semiquantitative 18F-FDG PET using the volume-based parameter of TGV is feasible in mesothelioma and may predict response to chemotherapy and patient survival after 1 cycle of treatment. Therefore, metabolic imaging has the potential to improve the care of patients receiving chemotherapy for mesothelioma by the early identification of responding patients. This technology may also be useful in the assessment of new systemic treatments for mesothelioma.
Chemotherapy for patients with malignant pleural mesothelioma is predominantly palliative, with the aim of relieving symptoms, improving quality of life, and increasing survival. Early identification of responding patients is important so that chemotherapy can be continued in patients in whom the potential benefits outweigh toxicity. Patients who are not likely to benefit may, therefore, be spared the side-effects of further therapy.
The measurement of response to chemotherapy in pleural mesothelioma remains problematic. The “rindlike” pattern of growth around pleural surfaces provides few opportunities for bidimensional measurement of discrete lesions. A modification of the RECIST (Response Evaluation Criteria in Solid Tumors) criteria specifically for mesothelioma, based on the measurement of tumor thickness at multiple levels on CT scan, has partially addressed the problem (1). Using the modified RECIST criteria, a partial response (PR) correlates with relief of symptoms, an increase in forced expiratory volume, improved health-related quality of life, and patient survival (2,3). However, the method is time-consuming and subject to errors, both in measurement and in assessing target tissue. It is also based on structure and takes no account of the viability of tumor masses. Finally, radiological assessment is an insensitive tool. In most cases it is not clear whether a tumor is responsive to chemotherapy until several cycles of treatment have been given. In a previous study we found that in only 47% of those who achieved a PR could this be detected after 1 cycle of therapy (2).
Radiological response criteria document change in tumor size. However, uptake of tracer in 18F-FDG PET scans is a measure of the metabolic activity and, therefore, the viability of tumor cells. In several solid tumors, serial changes in tumor tracer uptake have been shown to predict response to chemotherapy after only 1 cycle of therapy (4–7).
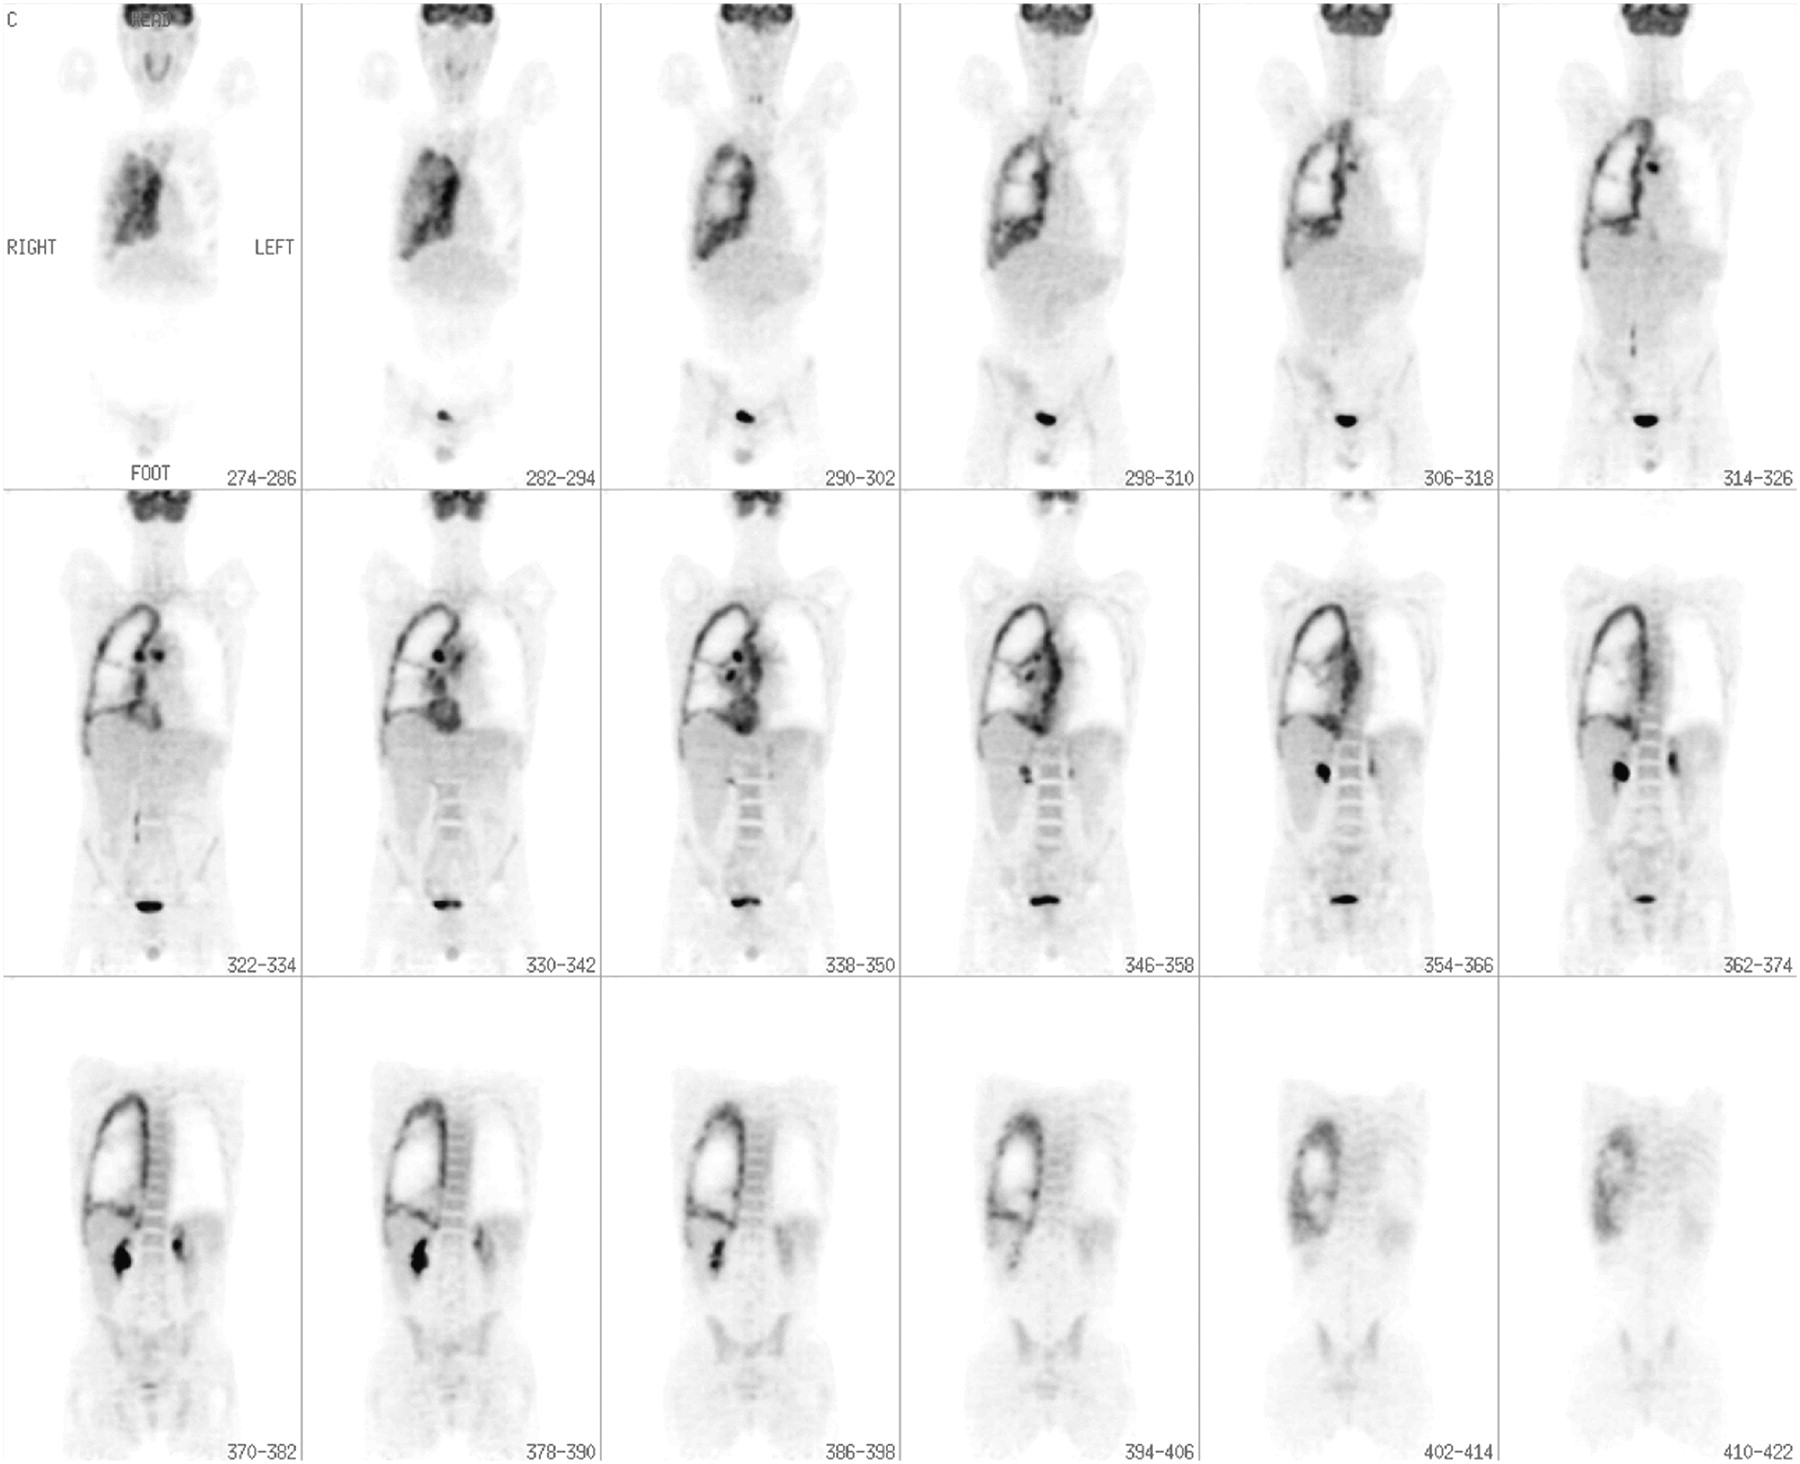
Mesothelioma is 18F-FDG avid (8) (Fig. 1), and initial studies suggest that 18F-FDG PET may be useful in the assessment of prognosis and in staging of patients with this disease (9,10). However, the role of 18F-FDG PET in the assessment of response to chemotherapy, particularly in a prospective setting, has not been clearly established.

Coronal slices of an 18F-FDG PET scan of a patient with mesothelioma demonstrating contiguous involvement of the right pleural surface, including infiltration of the oblique fissure. There is additional subcarinal, precarinal, right paratracheal, and right hilar lymph node involvement.
There are no formalized guidelines for the measurement of response to chemotherapy using 18F-FDG PET in solid tumors (11). Visual analysis is challenging, particularly in mesothelioma, because of the extent and distribution of disease. The most common semiquantitative parameter used is the maximum standardized uptake value (SUVmax) within a tumor (12–14). Mesothelioma is poorly suited to SUVmax measurements as it is often diffuse and heterogeneous. Defining the site to apply a representative SUVmax measurement is difficult and potentially unreliable. In addition, a measure that defines change on the basis of only 1 pixel within such a complex tumor mass is likely to be an oversimplification.
There is emerging interest in volume-based measures for response assessment with 18F-FDG PET. Defining the tumor volume manually is laborious and unreliable. Therefore, we have developed novel software that semiautomatically defines the 3-dimensional (3D) boundaries of the tumor on 18F-FDG PET scans. This results in a measure of the total glycolytic volume (TGV), which is a composite of tumor volume and total metabolic activity. We used this methodology to compare the response to 1 cycle of chemotherapy, as assessed by serial CT scans, with changes on serial 18F-FDG PET scans in patients with malignant pleural mesothelioma.
MATERIALS AND METHODS
Patients
Patients with mesothelioma commencing chemotherapy as part of usual care were prospectively recruited to the study. Eligible patients had histologically or cytologically proven malignant pleural mesothelioma, no prior chemotherapy, age >18 y, European Cooperative Oncology Group performance status 0–2, and either CT measurable or nonmeasurable disease. All patients had adequate bone marrow, renal and hepatic function as indicated by the following: total leukocyte count, >3 × 10⁹/L; granulocyte count, >1.5 × 10⁹/L; platelet count, >100 × 109/L; hemoglobin, >10 g/dL; serum creatinine, <120 μmol/L; total bilirubin, <1.5× the upper limit of normal; alanine transaminase and alkaline phosphatase, <3× the upper limit of normal. Patients with recent talc pleurodesis were initially recruited to the study; however, as published information became available on the confounding inflammatory effects of talc pleurodesis on 18F-FDG PET (15), the eligibility criteria were amended to exclude patients with talc pleurodesis performed within 6 mo before study entry.
All patients received chemotherapy with cisplatin (100 mg/m2 on day 1) and gemcitabine (1,000 mg/m2 on days 1, 8, and 15). Cycles were repeated at 28-d intervals. Patients who had CT–measurable disease were scheduled to have 6 cycles of chemotherapy in the absence of disease progression or unacceptable toxicity. Those with CT–nonmeasurable disease were scheduled to have 4 treatment cycles.
Schedule of Investigations
Before the commencement of each cycle of chemotherapy patients had a clinical examination and assessment of full blood picture, serum creatinine, electrolytes, and liver function tests.
CT.
Each patient had a contrast-enhanced thoracic and upper abdominal helical CT scan with 5-mm slices <4 wk before the first cycle of chemotherapy. This was repeated after the first and third or fourth cycle, with an extra CT scan to confirm response when appropriate.
CT Analysis.
Radiological response to therapy was assessed using the modified RECIST criteria for mesothelioma (1). CT scans were assessed by a thoracic radiologist, experienced in mesothelioma measurement and unaware of patient outcome and 18F-FDG PET scan results.
Complete response (CR) was defined as the disappearance of all target lesions with no evidence of tumor elsewhere, and PR was defined as at least a 30% reduction in the summated unidimensional tumor measurement. A confirmed response required a repeat observation on 2 occasions at least 4 wk apart. Progressive disease (PD) was defined as an increase of at least 20% in the total tumor measurement over the nadir measurement, or the appearance of one or more new lesions. Patients with stable disease (SD) were those who fulfilled the criteria for neither PR nor PD.
18F-FDG PET.
Patients had an 18F-FDG PET scan performed <4 wk before commencing chemotherapy and after the first cycle of chemotherapy using a Phillips Allegro germanium oxyorthosilicate PET scanner. Patients fasted for 6 h and had a blood glucose level measured before 18F-FDG administration. The blood glucose level was <10 mmol/L in all patients. 18F-FDG (200 MBq/m2) was administered intravenously, and patients were imaged after 90 min of rest in a quiet room. Emission scans were performed over multiple bed positions, with 4 min per bed position and 50% overlap per field of view. 137Cs transmission scans were acquired for attenuation correction. Patient preparation, imaging, and reconstruction protocols were kept constant for serial scans in the same patient.
18F-FDG PET Analysis.
Quantitative analysis was performed using our semiautomated 3D volume-based region-growing algorithm. The growing function of the algorithm is threshold-based and is determined by the current mean, the activity in neighboring pixels, and the maximum normal background level (Appendix) (16,17). Contiguous 3D tumor regions are generated, with the operator reseeding on noncontiguous tumor elements. The reproducibility and accuracy of the algorithm has been validated in phantom simulations, and an interobserver variability of approximately 5% for the measurement of TGV has been demonstrated in a clinical setting (17).
The region-growing algorithm was used to define a volume of interest (VOI) on both the pre- and posttherapy 18F-FDG PET scans. The semiquantitative measures of TGV and SUVmax were obtained from the VOI. TGV is a composite of metabolic activity and volume within the tumor mass and, therefore, has the units of SUV·mL. SUVmax was regarded as the maximum SUV value in the tumor VOI.
TGV and SUVmax values after 1 cycle of chemotherapy were compared with the baseline measurements.
The decision to stop therapy because of progression was made using the modified RECIST criteria and on clinical assessment. The 18F-FDG PET scan results were not used to direct patient therapy.
Ethical Considerations
All patients received printed information regarding the study and gave written informed consent to participate. The appropriate Human Research Ethics Committee approved this study.
Statistical Analysis
Survival was calculated from day 1 of the first cycle of chemotherapy until death (from any cause). Cox regression analysis was the primary statistical test performed to assess the relationship between change in PET parameters or CT response and survival. Hazard ratios were calculated for a 10% change from baseline for measured CT and PET response parameters, as a 1% change is unlikely to have practical clinical significance for patient management and is very likely to be prone to error. Kaplan–Meier curves using incremental TGV response values of >85%, 60%–85%, and <60% of baseline were used to illustrate survival differences between groups. Significance was regarded at the 5% level. Statistical analyses were performed using SPSS 14.0 (SPSS Inc.) and Stata 9.3 (StataCorp LP).
RESULTS
Thirty-nine patients were prospectively recruited to the study over a 2-y period. Two patients who had synchronous second primary tumors and 8 who did not have a second CT or PET scan (5 due to clinical deterioration, 3 scheduling or technical difficulties) were excluded from analysis. Of the 29 patients with baseline and postchemotherapy 18F-FDG PET and CT scans potentially suitable for analysis, 6 had talc pleurodesis within 6 mo of the baseline 18F-FDG PET scan.
Therefore, 23 patients were eligible and had data suitable for analysis. There were 3 women and 20 men, and the mean age was 65 y (range, 52–75 y).
CT Scans
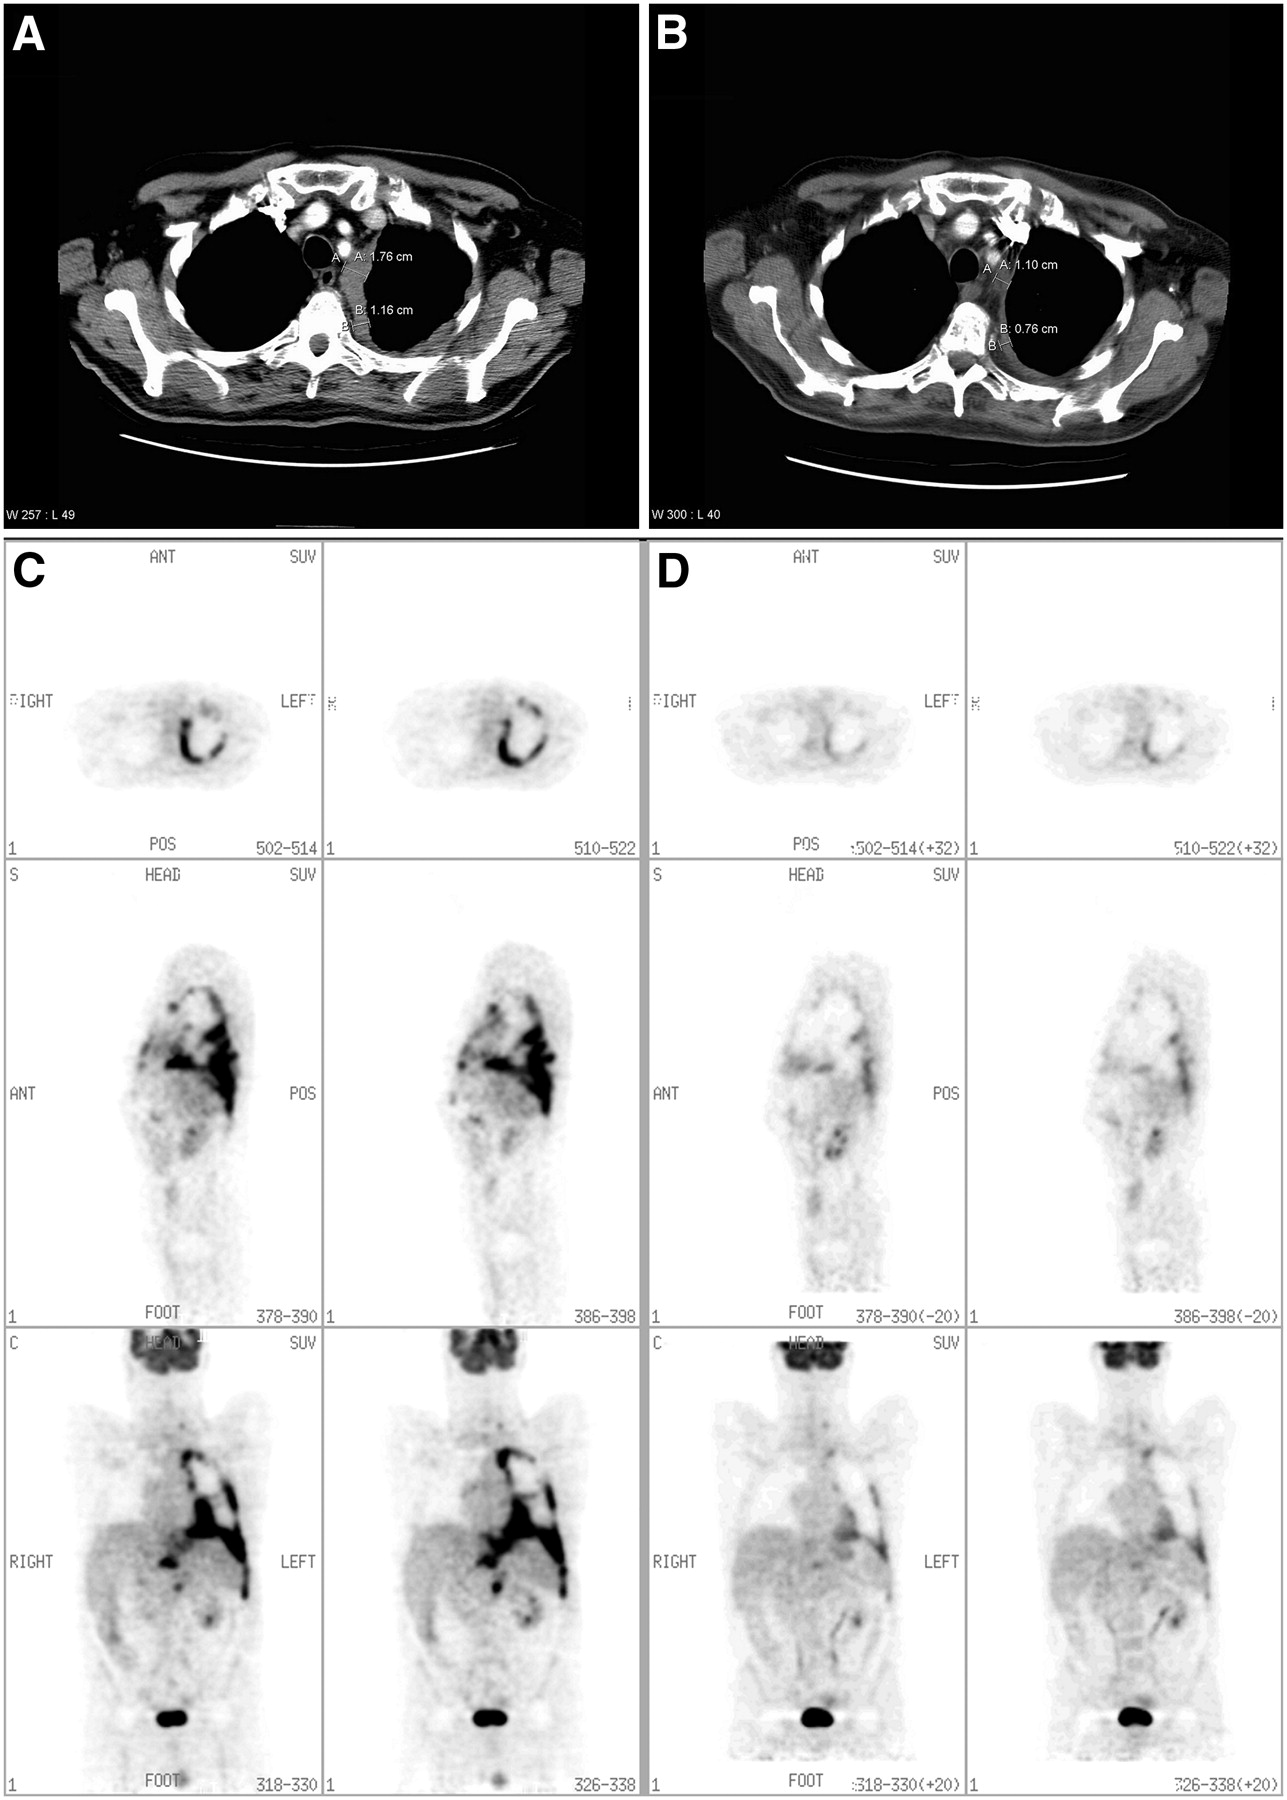
Of the 23 patients, 20 had measurable disease at baseline, and 3 had nonmeasurable disease on CT. Of the 20 patients with measurable disease, 7 achieved a PR after 1 cycle of chemotherapy and 13 had SD (Table 1). All of the patients with a PR after 1 cycle of chemotherapy had the response confirmed with a repeat CT >4 wk later. No patients had disease progression after 1 cycle of therapy. Of the 13 patients with SD after 1 cycle, 3 subsequently achieved a PR with further chemotherapy. An example of the CT measurements applied is shown in Figure 2.

Representative CT transaxial slices of a patient with mesothelioma (A) before chemotherapy and (B) after chemotherapy. Measurements according to modified RECIST criteria have been applied. The patient had a radiological partial response after 1 cycle of chemotherapy. The challenge of defining a measurement site to determine response is demonstrated. Representative 18F-FDG PET transverse, sagittal, and coronal slices in the same patient (C) before chemotherapy and (D) after 1 cycle of chemotherapy. A significant reduction in intensity and extent of 18F-FDG uptake in the left pleural cavity is demonstrated. The response is more clearly visualized on the 18F-FDG PET imaging, and the degree of change compared with baseline in the patient was greater (TGV fell to 11% of baseline on the postchemotherapy scan, compared with a fall to 63% of baseline on CT measurements).
Patient Demographics and 18F-FDG PET Response of the 23 Patients in the Study, with Patients Grouped According to CT Response Attained After 1 Cycle of Chemotherapy
18F-FDG PET Quantitative Analysis
In 22 of the 23 patients, a VOI was successfully generated using the semiautomated region-growing algorithm. These VOIs appeared visually representative of the tumor region in all 22 patients. Figure 3 demonstrates an example of the VOI generated before and after chemotherapy using the region-growing algorithm. In 1 patient, with radiologically nonmeasurable disease, there was minimal 18F-FDG–avid pleural disease, and the algorithm was unable to generate a tumor volume. This tumor was regarded as nonevaluable by PET. The baseline TGV values ranged from 278 to 16,101 SUV·mL, reflecting the large variation in tumor bulk on metabolic imaging.

Representative 18F-FDG PET coronal slices in a patient with left pleural mesothelioma (A) before chemotherapy and (B) after 1 cycle of chemotherapy, demonstrating reduction in the extent and intensity of 18F-FDG activity. The region generated by the semiautomated region-growing algorithm is shown on the coronal slice (C) before chemotherapy and (D) after chemotherapy. (A–D) illustrate one representative coronal slice both before and after chemotherapy; however, in practice the region is grown in 3 dimensions to define an overall volume of interest (VOI). (E) Histogram of the SUV voxel values of the VOI generated by the region-growing algorithm in this patient before chemotherapy (red line) and after chemotherapy (green line). The histogram demonstrates both a reduction in the numerical SUV values and in the overall volume of metabolically active tumor. The TGV fell to 30% of the prechemotherapy value.
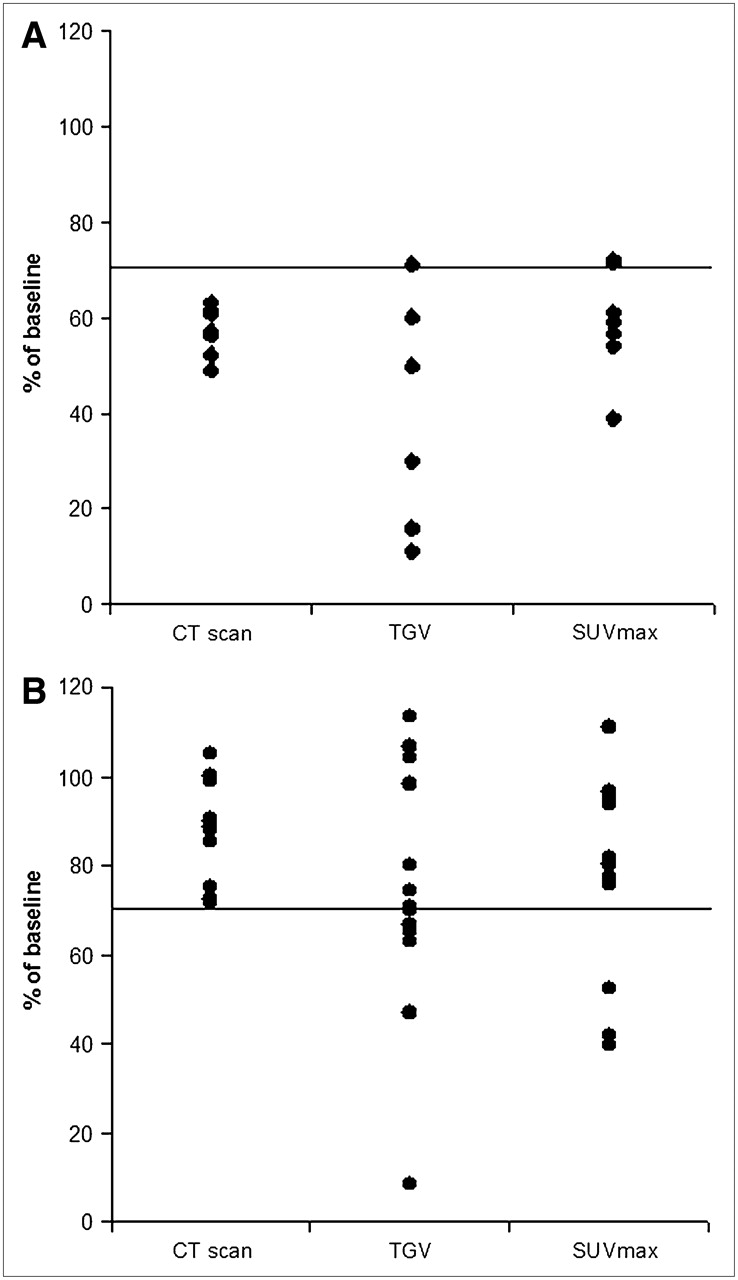
Among the 20 patients with CT-measurable disease, the changes in TGV and SUVmax as a percentage of baseline value after 1 cycle of chemotherapy are shown against changes in the summated unidimensional measurement of tumor on CT in Figure 4. The results are displayed according to the radiological response status after 1 cycle of chemotherapy.

18F-FDG PET TGV and SUVmax percentage response values compared with CT response values in the 7 patients with CT-defined PR (A) and 13 patients with CT-defined SD after 1 cycle of chemotherapy (B). All values are expressed as a percentage of the baseline value. The solid line represents the 70% value used in CT to define a PR.
For the 7 patients who attained a radiological PR after 1 cycle of chemotherapy, the median TGV after chemotherapy was 30% of the baseline value (range, 11%–71%). In the 13 patients with radiologically SD, the median TGV after chemotherapy was 71% of the baseline value (range, 8%–113%) (Table 1). The corresponding TGV measurements show a greater percentage decline among those with PR compared with CT measurements but, more importantly, show a greater spread of data among those with SD (Fig. 4). The Pearson correlation coefficient for the percentage change in TGV compared with the percentage change in CT was 0.69 (P < 0.001, n = 20).
SUVmax measurements were also compared with CT measurements (Table 1; Fig. 4). In the CT responding patients the SUVmax fell to a median of 59% of the pretreatment value (range, 39%–72%) and in the patients with CT SD the median SUVmax was 80% of the baseline value (range, 40%–111%). The Pearson correlation coefficient for the percentage change in SUVmax compared with the percentage change in CT was 0.55 (P = 0.011, n = 20). The changes in SUVmax values demonstrate a narrower dynamic range than the change in TGV values for both CT responding and stable patients.
Table 2 lists all of the baseline and postchemotherapy TGV and SUVmax values for the patient group, arranged according to CT response.
Baseline and After 1 Cycle of Chemotherapy, TGV and SUVmax Values for All Patients, Grouped According to CT Response
Survival
At the time of censorship, 11 of 23 patients were alive, and the median survival of the overall group was 9 mo.
Cox regression analysis demonstrated that the survival of the 7 patients who achieved a PR by CT scan after 1 cycle of chemotherapy was not statistically superior to that of the remaining patients (P = 0.38) and the percentage change in CT measurements after 1 cycle of chemotherapy did not significantly predict survival (P = 0.131, n = 20).
The 18F-FDG PET analysis demonstrated that the percentage change in SUVmax with chemotherapy was also not predictive of patient survival (P = 0.097, n = 22). However, the percentage change in TGV after chemotherapy was strongly predictive of survival (P = 0.015, n = 22). The hazard ratio for a 10% change in TGV after chemotherapy was 0.64 (95% confidence interval [CI], 0.26–0.94), indicating that a 10% reduction in TGV after chemotherapy was associated in our study patients with a 36% reduction in the risk of death (Table 3).
Cox Proportional Regression Analysis of Relationship Between Change in CT, SUVmax, and TGV after 1 Cycle of Chemotherapy and Survival
Exclusion of the 2 patients with prior talc pleurodesis (7 and 9 mo before commencement of chemotherapy) from the Cox regression analysis results in a hazard ratio of 0.70 for a 10% reduction in TGV (95% CI, 0.58–0.90; P = 0.008, n = 20). Therefore, despite the loss of some statistical power, there remains a significant relationship between the reduction in TGV and survival.
The Kaplan–Meier analysis (Fig. 5) illustrates the significant relationship between the magnitude of TGV percentage change and survival (log rank statistic, 11.24; P = 0.0036). The survival of those whose TGV after 1 cycle of chemotherapy fell to <60% of baseline was superior to that of those with a smaller change (hazard ratio, 0.22; 95% CI, 0.09–0.86; P = 0.03).
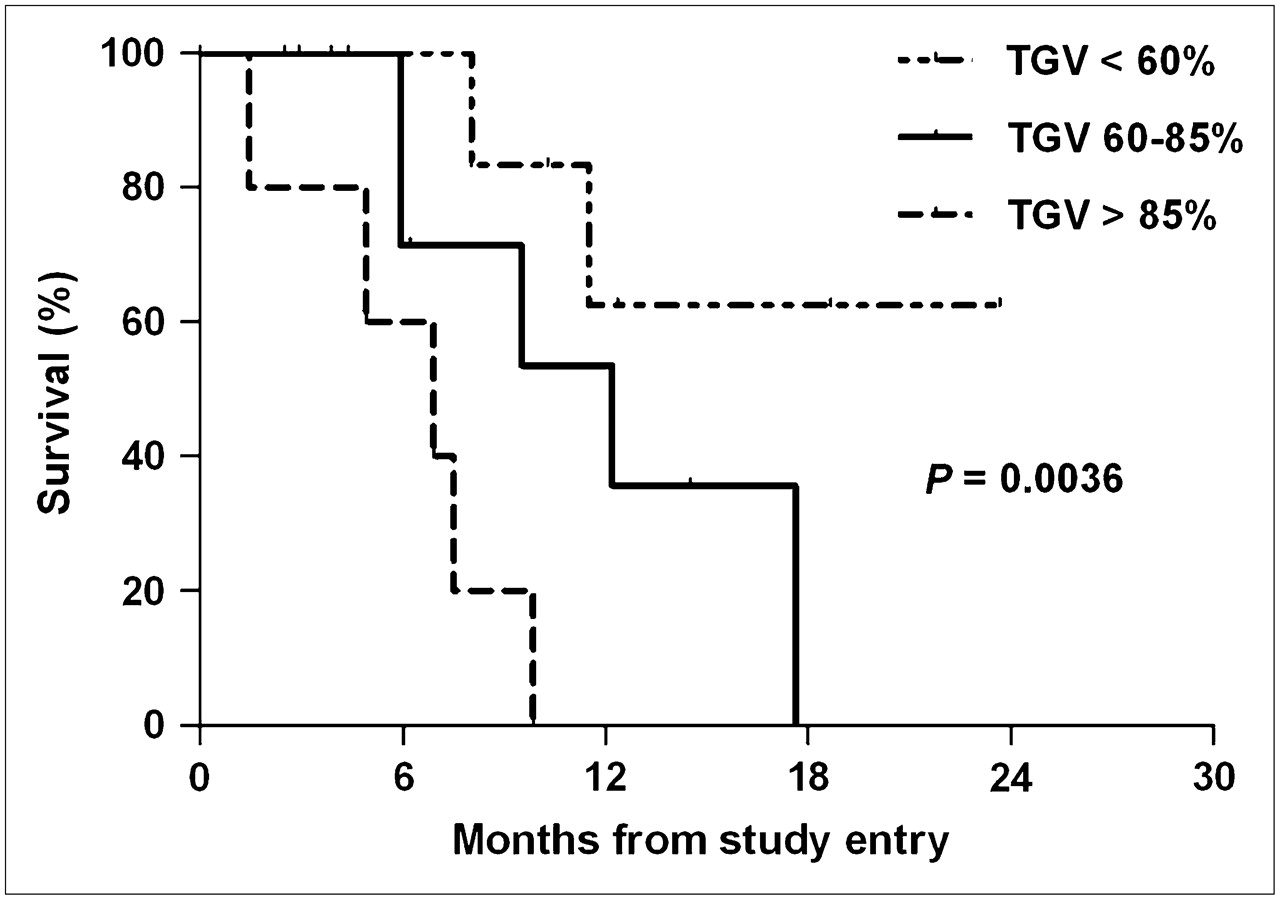
Kaplan–Meier survival curves illustrate the relationship between the degrees of reduction in TGV compared with baseline and survival. TGV <60% represents a reduction in TGV after 1 cycle of chemotherapy to less than 60% of the baseline value. TGV 60%–85% represents a reduction to 60%–85% of the baseline value. TGV >85% includes patients whose TGV after chemotherapy was 85% or greater than the baseline value and patients whose TGV increased after chemotherapy.
The survival of patients whose TGV increased after chemotherapy was compared with those whose TGV decreased with therapy. The median survival in the 4 patients who had an increase in TGV after 1 cycle of chemotherapy was 4.9 mo (95% CI, 0.0–10.4) compared with 11.5 mo (95% CI, 7.1–15.9) in the 18 patients whose TGV fell after chemotherapy (log rank statistic, 2.89; P = 0.09). This is not statistically significant because of the small sample size; however, further investigation in a larger patient group is warranted.
DISCUSSION
This study introduces a novel method of semiautomatically defining tumor volumes on 18F-FDG PET using software that applies a mathematic algorithm to delineate tumor regions. Mesothelioma, as a predominantly contiguous tumor encasing the pleural space, was ideally suited to a semiautomated approach, as defining the tumor boundaries by hand would have been laborious and prone to error. This study demonstrates that the region-growing algorithm is feasible, resulting in a visually representative tumor VOI in 22 of 23 patients. It included 2 patients whose tumor bulk was too small to be measurable on the CT scan. The differentiation between tumor and background on 18F-FDG PET was insufficient for region generation in only 1 patient.
Volume-based and semiautomated methods of CT scan analysis for patients with mesothelioma are being developed (18,19). 18F-FDG PET, however, is a functional measure of tumor metabolic activity, which is potentially more sensitive in detecting change to therapy than anatomic measurements. 18F-FDG PET has been demonstrated to be useful in the prediction of response to chemotherapy in several solid tumors, with the reduction in 18F-FDG uptake often preceding radiological changes (4–6,20–22). There are also emerging survival data with metabolic responses associated with a survival advantage in lung, breast, esophageal, and pancreatic cancer (5–7,21,23).
Volume-based 18F-FDG PET tumor assessment has been performed in lung cancer (24), colorectal cancer (25), and glioma (26). Most published methods used fixed threshold techniques. Fixed threshold techniques are poorly suited to mesothelioma because of the plaquelike tumor mass and the problems associated with differentiating tumor from adjacent normal tissue, such as chest wall, mediastinum, liver, and heart. By using iterative thresholding and taking into account the 18F-FDG activity in surrounding normal tissues, our semiautomated region-growing algorithm was capable of delineating tumor boundaries. The VOI generated from the region-growing algorithm was then used to obtain a measure of tumor glycolysis, which we termed TGV. This measure is similar to TLG (total lesion glycolysis) developed by Larson et al. (24). Although the method of generating the tumor volume differs between the 2 studies, the concept of assessing total glycolysis within viable tumor is similar.
Despite the small sample size in our study, statistical analysis by Cox regression demonstrates a strong relationship between the change in TGV after 1 cycle of chemotherapy and the survival for patients with mesothelioma. Neither SUVmax nor CT response after 1 cycle of chemotherapy, however, predicted survival. Not only are the hazard ratios superior for TGV in comparison with CT and SUVmax, but also the wider dynamic range of change in TGV (range, 11%–113%) compared with change in SUVmax (range, 39%–111%) or CT (range, 49%–105%) allows for potentially better stratification of response. The Kaplan–Meier analysis further supports the value of TGV measurements and illustrates a continuum in the relationship between decrease in TGV and survival.
A recent paper by Ceresoli et al. (27) assessed response to chemotherapy in mesothelioma with 18F-FDG PET. The authors defined a 25% decrease in SUVmax as a metabolic response. They were able to show a relationship between metabolic response and time to progression and a trend to improved survival. SUVmax is a single-pixel value, which reflects maximum intensity of 18F-FDG activity in the tumor. TGV is a 3D measure and incorporates both tumor volume and metabolic activity. Therefore, TGV is reflective of change throughout the entire tumor mass and may potentially be a more sensitive method of detecting change than a single-pixel value. This may explain the statistically significant relationship between change in TGV and survival that was demonstrated in our study, whereas change in SUVmax and survival was not significant in the Ceresoli study and our experience.
There was considerable overlap in the change in TGV values in the group of patients with CT PR and those with CT-defined SD. The majority of patients in our study had SD on CT after 1 cycle of chemotherapy; however, there are several patients in the CT-defined SD group whose TGV fell to the same extent as those who were defined by CT as attaining a PR. This demonstrates the limited sensitivity of the modified RECIST criteria and highlights the difficulties of applying the principles of unidimensional response measurements to a tumor that encases the pleural cavity (28). Defining the site of measurement by modified RECIST is challenging, and obtaining a PR is dependent on the thickness of involved pleura decreasing by 30%. The well-recognized difficulties associated with CT response assessment in mesothelioma highlight the need for a more reliable and sensitive method of response assessment in this tumor type.
The attrition of patients who are not well is a potential limitation of this study, providing less data in the nonresponding group. Five patients were unable to complete either 1 course of chemotherapy or the pre- and postchemotherapy 18F-FDG PET and CT scans. In clinical practice, these patients likely stop chemotherapy based on clinical assessment, independent of imaging response. Six patients initially recruited to this study had talc pleurodesis performed within 6 mo of study entry. The inflammatory reaction to talc pleurodesis is reported to persist on 18F-FDG PET for months to years (15). However, this reaction is likely to be most intense close to the time of the pleurodesis. We included in this study patients in whom pleurodesis was performed >6 mo earlier, as any change in tumor 18F-FDG uptake due to chemotherapy was likely to be greater than residual change in 18F-FDG uptake from pleurodesis. Therefore, 2 analyzed patients had a pleurodesis 7 and 9 mo before chemotherapy. Both patients had a fall in TGV to 16% and 70% of baseline, respectively. Excluding these patients did not reduce the significance of the relationship between change in TGV and survival. The use of 18F-FDG PET for tumor response evaluation in patients who have had previous pleurodesis, however, needs further clarification.
We have not attempted to define absolute criteria for “TGV response” in this study. Further clinical data need to be obtained before a value representing an unequivocal decrease in TGV can be proposed. This article, however, demonstrates the feasibility and potential clinical utility of volume-based PET measures such as TGV in assessing response to chemotherapy. A reduction in TGV after 1 cycle of chemotherapy correlated well with CT response and, importantly, had greater prognostic significance than that demonstrated with SUVmax or CT scan measurements. In combination with the Ceresoli experience (27), this work supports the utility of 18F-FDG PET in response assessment in malignant pleural mesothelioma and suggests that a metabolic response to chemotherapy is of prognostic significance in this complex tumor type.
CONCLUSION
Serial 18F-FDG PET in mesothelioma appears useful in predicting response and patient survival after only 1 cycle of chemotherapy. TGV, a volume-based measure of total glycolysis, was superior to SUVmax and to CT measurements in predicting survival in the patient group studied. Therefore, metabolic imaging has the potential to improve the care of patients receiving chemotherapy for mesothelioma by the early identification of responding patients. This technology may also be useful in the assessment of new systemic treatments for mesothelioma.
APPENDIX
The semiautomated region-growing algorithm is a mathematically defined iterative algorithm that uses an adaptive threshold to delineate 3D tumor boundaries. The operator chooses a seed-point anywhere in the visible tumor region. The tumor region grows contiguously from the seed-point to include any neighboring voxels with counts/voxel above the current threshold value. The “threshold value” is recalculated after each iteration using the formula: Threshold value = threshold factor·current mean.
The mean is recalculated after each iteration and the threshold value is reapplied. This process continues until no further voxels can be drawn. To ensure reproducibility, once the final volume is defined, the region is regrown from the voxel with the maximum counts/voxel, outward. This ensures that wherever the seed-point is placed within the tumor, the same region will always be grown.
The “threshold factor” is a function of the maximum normal level (MNL) that is set by the user. The threshold factor varies depending on the current mean SUV of the growing region and the MNL value and has range of values between 0 and 1. The threshold factor approaches 1.0 when the mean SUV in the growing region is approaching the MNL. However, when the growing-region mean SUV is much higher than the MNL, the threshold factor reduces to a minimum approaching 0.
The “MNL” is derived from a region of interest placed in normal background tissue and is defined as the mean background region SUV + 3 SDs.
The software was programmed in Interactive Data Language (IDL) and is not commercially available. Release of the program to several sites for research purposes has been performed in a cooperative “shareware” arrangement.
Acknowledgments
This study was supported by a research grant from the Cancer Council of Western Australia. We gratefully acknowledge the efforts of Judy Innes-Rowe, Dr. Karen Tucker, and the WA PET Centre and Cyclotron staff.
Footnotes
-
COPYRIGHT © 2007 by the Society of Nuclear Medicine, Inc.
References
- Received for publication April 5, 2007.
- Accepted for publication June 8, 2007.


Jump to section
Related Articles
Cited By...
- PET/CT Imaging in Lung Cancer
- Volumetric PET Response Assessment Outperforms Conventional Criteria in Patients Receiving High-Dose Pembrolizumab for Malignant Mesothelioma
- 18F-FDG PET Assessment of Malignant Pleural Mesothelioma: Total Lesion Volume and Total Lesion Glycolysis--The Central Role of Volume
- Early PET/CT Scan Is More Effective Than RECIST in Predicting Outcome of Patients with Liver Metastases from Colorectal Cancer Treated with Preoperative Chemotherapy Plus Bevacizumab
- Prognostic Ability of 18F-FDG PET/CT in the Assessment of Colorectal Liver Metastases
- Serum Soluble Mesothelin Concentrations in Malignant Pleural Mesothelioma: Relationship to Tumor Volume, Clinical Stage and Changes in Tumor Burden
- Volume-of-Interest Assessment of Oncologic Response Using 18F-FDG PET/CT: A Phantom Study
- Reproducibility of 18F-FDG and 3'-Deoxy-3'-18F-Fluorothymidine PET Tumor Volume Measurements
- Investigation of a unilateral pleural effusion in adults: British Thoracic Society pleural disease guideline 2010
- A Novel Prognostic Model for Malignant Mesothelioma Incorporating Quantitative FDG-PET Imaging with Clinical Parameters
- Guidelines of the European Respiratory Society and the European Society of Thoracic Surgeons for the management of malignant pleural mesothelioma
- From RECIST to PERCIST: Evolving Considerations for PET Response Criteria in Solid Tumors
- Role of 18F-FDG PET in Assessment of Response in Non-Small Cell Lung Cancer
- Tumor Volume Assessment by 18F-FDG PET/CT in Patients with Oral Cavity Cancer with Dental Artifacts on CT or MR Images