


Visual Abstract

Abstract
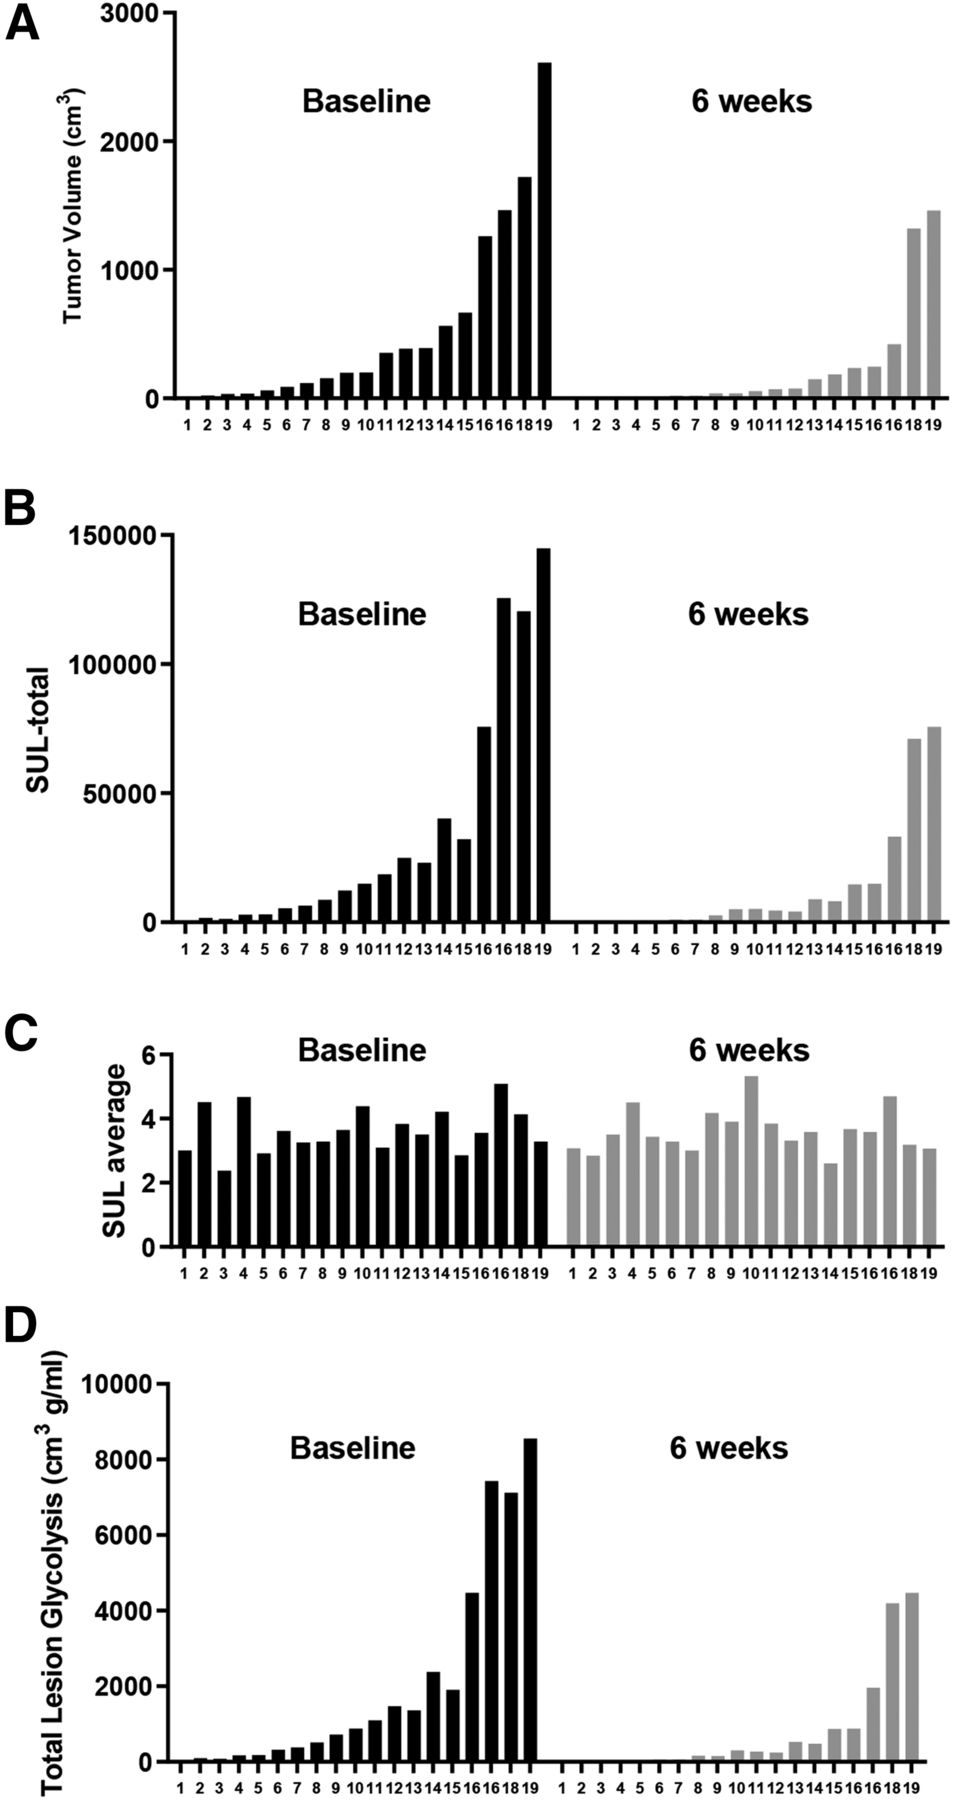
Cancer survival is related to tumor volume. 18F-FDG PET measurement of tumor volume holds promise but is not yet a clinical tool. Measurements come in 2 forms: the first is total lesion volume (TLV) based on the number of voxels in the tumor, and the second is total lesion glycolysis (TLG), which is the TLV multiplied by the average SUL (i.e., SUV normalized for lean mass) of the tumor (SULaverage). In this study, we measured tumor volume in patients with malignant pleural mesothelioma (MPM). Methods: A threshold-based program in Interactive Data Language was developed to measure tumor volume in 18F-FDG PET images. Nineteen patients with MPM were studied before and after 2 cycles (6 wk) of chemoimmunotherapy. Measurements included TLV, TLG, the sum of the SULs in the tumor (SULtotal, a measure of total 18F-FDG uptake), and SULaverage. Results: Baseline TLV ranged from 11 to 2,610 cm3. TLG ranged from 32 to 8,552 cm3 g/mL and correlated strongly with TLV. Although tumor volumes ranged over 3 orders of magnitude, SULaverage stayed within a narrow range of 2.4–5.3 units. Thus, TLV was the major component of TLG, whereas SULaverage was a minor component and was essentially constant. Further evaluation of SULaverage showed that in this cohort its 2 components, SULtotal and TLV, changed in parallel and were strongly correlated (r = 0.99, P < 0.01). Thus, whether the tumors were large or small, 18F-FDG uptake as measured by SULtotal was proportional to the TLV. Conclusion: TLG equals TLV multiplied by SULaverage, essentially TLV multiplied by a constant. Thus TLG, commonly considered a measure of metabolic activity in tumors, is also in this cohort a measure of tumor volume. The constancy of SULaverage is due to the fact that 18F-FDG uptake is proportional to tumor volume. Thus, in this study, 18F-FDG uptake was also a measure of volume.
Malignant pleural mesothelioma (MPM) is an aggressive tumor that often presents as pleural thickening or rind, with involvement of pleural fissures, the chest wall, or the mediastinum (1). A strong indicator of cancer prognosis is the size of tumor, but determining the size of MPM is a major challenge. Because linear measurements are unreliable, a modified RECIST method was developed that measured the thickness of the pleural rind at several levels (2). Another approach is to measure tumor volume directly by CT. New automated CT analysis programs further this effort, but as shown in a pilot study, scan interpreters can have different perceptions of the extent of disease and of separation of the tumor from adjacent normal tissue (3).
Against this background is the use of 18F-FDG PET imaging not only for tumor localization, response to therapy, and recurrence but also as a measure of tumor volume and metabolic activity. Applied to MPM, 18F-FDG PET imaging provides a simple approach for measuring both tumor volume and metabolic activity. One approach is to define an SUL (i.e., SUV normalized for lean mass) threshold above which voxels are counted as the total lesion volume (TLV) (4–7). A second measurement that can be obtained from 18F-FDG PET images is the total lesion metabolic activity, commonly designated total lesion glycolysis (TLG) (8). Previous reports of MPM have shown that TLV, TLG, or both are correlated with overall patient prognosis (5–7,9–11).
For this report, we used a background threshold–based program to analyze 18F-FDG PET images for TLV (4) and TLG. Subjects were patients with MPM who received an antimesothelin immunotoxin with chemotherapy. We explored the relationship of TLV, SULtotal, SULaverage, and TLG. We found that in this cohort, like TLV, TLG was a measurement of tumor volume.
MATERIALS AND METHODS
Patients
Nineteen patients (84% male; median age, 67 y; range, 52–76 y) with histologically confirmed MPM and measurable stage III or IV disease were enrolled in a phase 1 study of the antimesothelin immunotoxin SS1P in combination with pemetrexed and cisplatin (12). Pemetrexed and cisplatin were administered every 3 wk for up to 6 cycles, whereas SS1P was administered intravenously on days 1, 3, and 5 every 3 wk for 2 cycles—that is, for only the first 6 wk. For the study, CT and 18F-FDG PET/CT scans were obtained at baseline and every 6 wk. Thoracic CT scans were analyzed by measuring tumor thickness at the chest wall and mediastinum at 3 levels, according to the modified RECIST procedure (2). Only the baseline and 6-wk results were used for this report. The study protocol was approved by the Institutional Review Board of the National Cancer Institute, National Institutes of Health, and all patients gave written informed consent in accordance with the National Cancer Institute Institutional Review Board regulations.
18F-FDG PET/CT Studies
Patients fasted 4–6 h before undergoing 18F-FDG PET/CT imaging, had fasting blood glucose values of less than 200 mg/dL, and were studied about 1 h after administration of an average dose of 556 MBq of 18F-FDG. Images were acquired with either a Siemens Biograph 128 or a GE Healthcare Discovery ST and were processed using iterative reconstruction (3 iterations, 21 or 22 subsets) with point-spread function correction or both point-spread function and time-of-flight corrections. 18F-FDG PET/CT volume measurements were considered exploratory and not used for treatment decisions.
18F-FDG PET/CT Image Analysis
18F-FDG PET measurements were expressed as SUL. A background threshold–based program written in Interactive Data Language (version 8.0) quantified the tumor volume and overall 18F-FDG activity. The threshold was determined by measuring the average SUL activity within a 3-cm-diameter sphere in the liver and then multiplying this value by 1.5 and adding twice the SEM of the voxels within the sphere (13) (mean liver SUL at baseline and 6 wk was 1.81± 0.04 and 1.80 ± 0.04, respectively; P = 0.15). This procedure created a mask of positive voxels, which was further edited to exclude nontumor tissue (e.g., brain, heart, and kidney) and compared with 18F-FDG PET images to ensure that all tumor was included. Thirty-eight 18F-FDG PET studies were analyzed in duplicate; their mean values are reported here. The percentage coefficient of variation of duplicate analyses of TLV was 2.5%, and the 95% confidence interval was 7.0% (14,15).
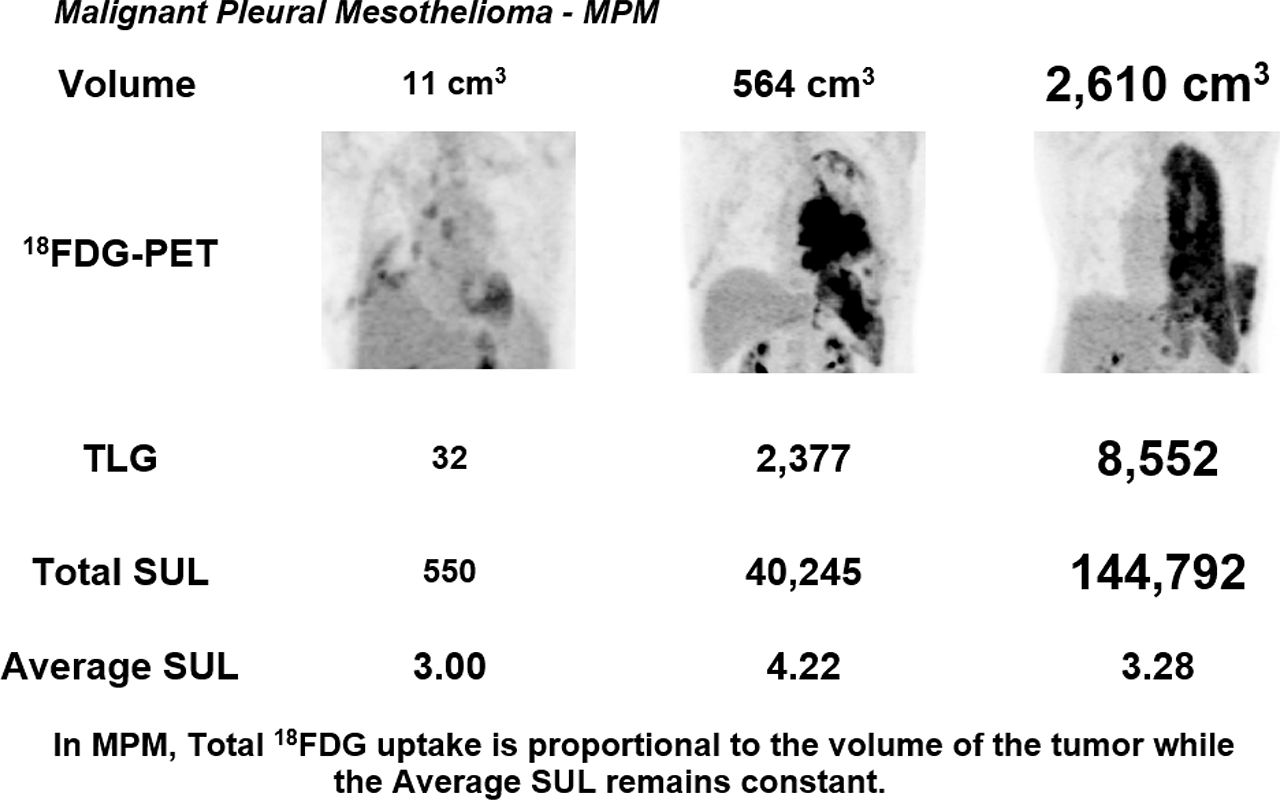
To validate the accuracy of the Interactive Data Language program, we assessed 35 malignant nodules (including renal, adrenal, mesothelioma, and lymphoma, approved National Institutes of Health 18F-FDG PET scans; patients were deceased at the time of the current analysis so that under title 45 Code of Federal Regulations, part 46, institutional review board approval or an exemption for this research was unneeded), comparing the 18F-FDG PET volumes with those in contemporary CT studies using a PACS CT volume measurement program (16). Nodules were selected because visually they had uniform 18F-FDG activity without evidence of necrosis. The CT volumes ranged from 0.5 to 428 cm3. 18F-FDG PET and CT measurements were nearly identical; a regression line relating the two had a slope of 0.982 and a y intercept of 0.4 (Fig. 1). The percentage coefficient of variation of duplicate analyses of nodule volumes was 1.2%, and the 95% confidence interval was 3.3% (14,15).

Tumor nodule volumes on 18F-FDG PET vs. CT. Measurements were performed in duplicate. Inset shows nodules smaller than 40 cm3.
Measurements and Calculations
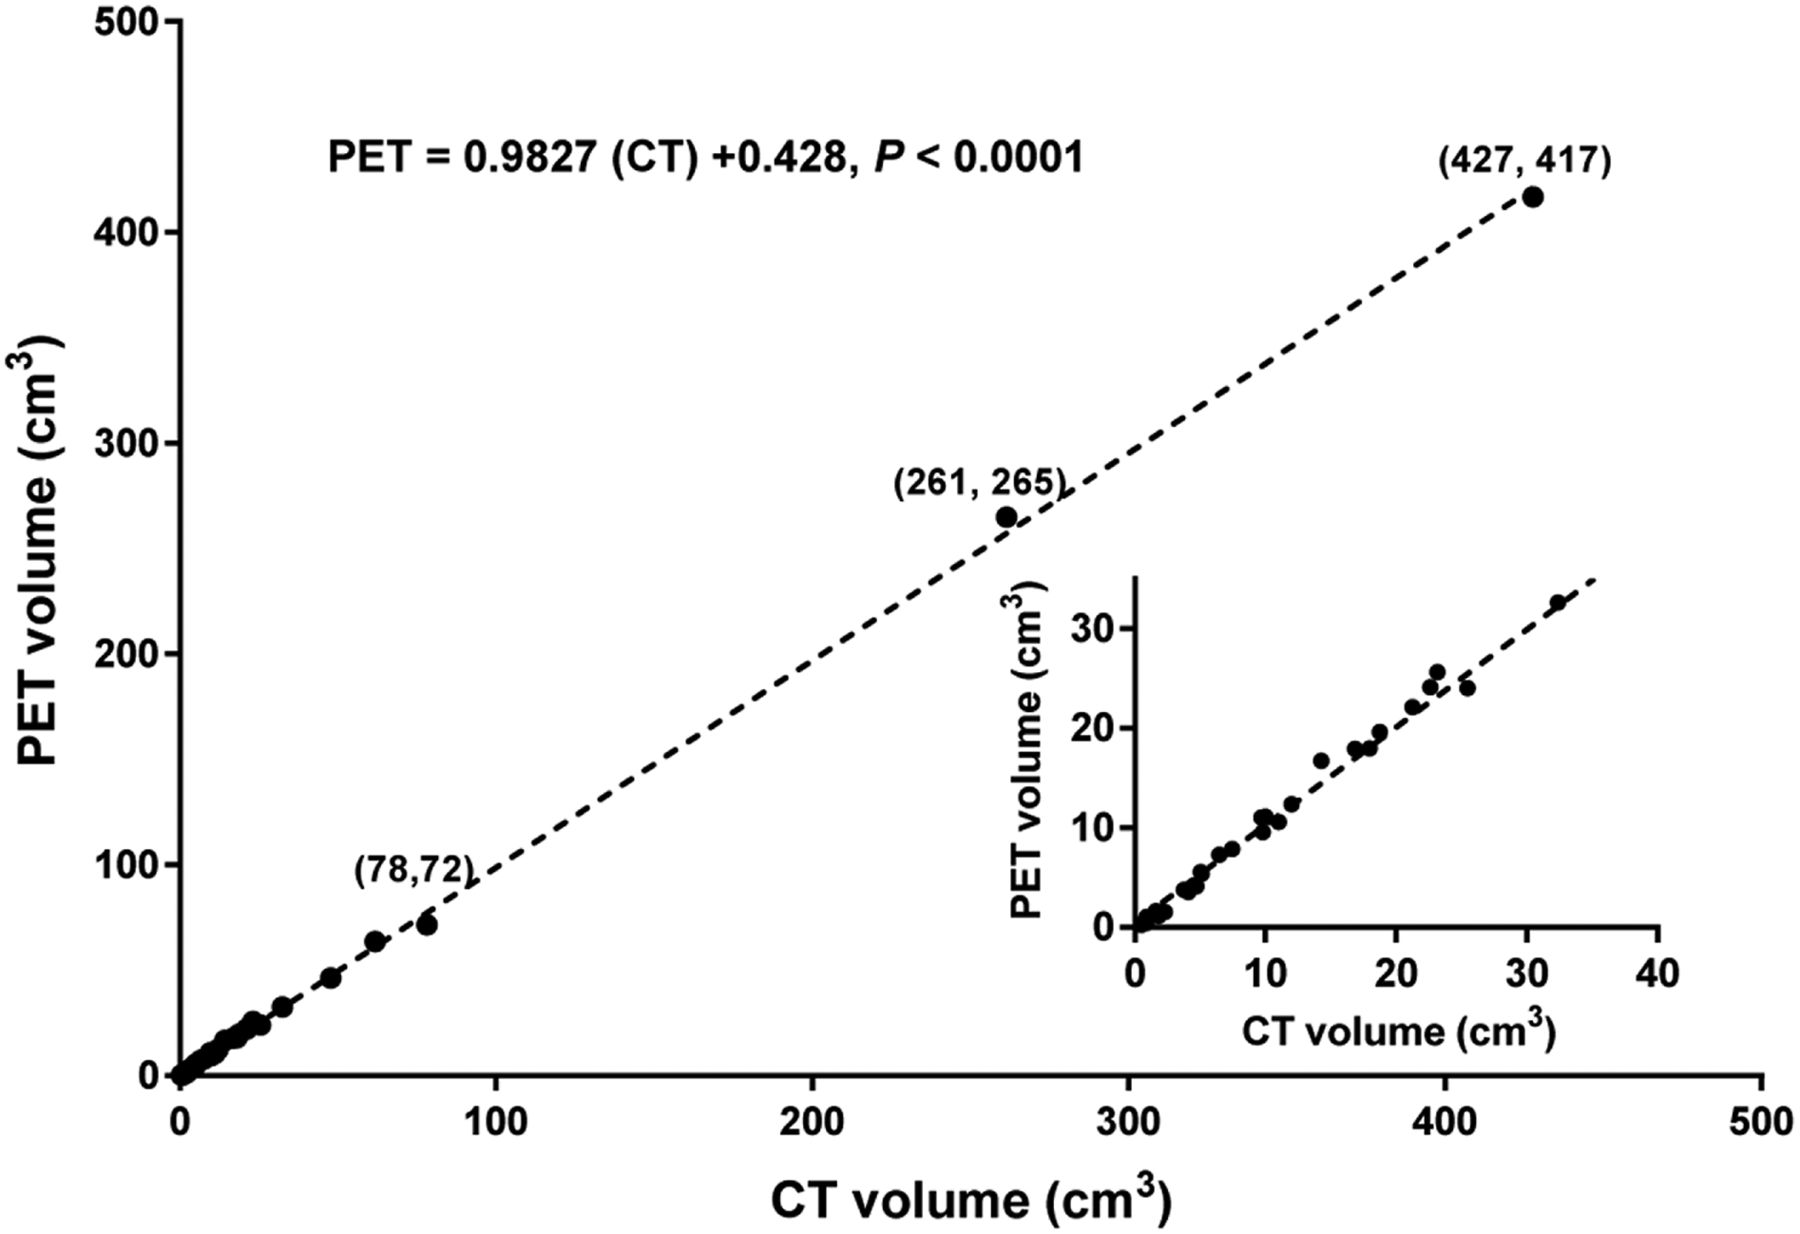
The Interactive Data Language program made 2 measurements. It first determined the number of voxels with SULs equal to or greater than the threshold. Multiplying this value by the volume of a single voxel gave the TLV (Fig. 2A). The SULs in these voxels were then summed to give the total SUL in the tumor (SULtotal) (Fig. 2B). Because SULtotal is affected by voxel size, SULtotal was corrected to represent 16.9 voxels/cm3, the largest voxel size encountered in this study.

The 19 patients at baseline and 6 wk: TLV (A), SULtotal (B), SULaverage (C), and TLG (D). Order is based on volume at baseline and 6 wk.
Two further calculations were made: SULaverage was calculated by dividing SULtotal by the number of voxels in the tumor (Fig. 2C), and TLG was calculated by multiplying TLV by SULaverage. (Fig. 2D).
Statistical Methods
The relationship between pairs of measurements, TLV, TLG, SULaverage, and SULtotal was determined using Spearman correlation analysis (Table 1). The results were interpreted as strong correlation, r > 0.70; moderately strong correlation, 0.50 < r < 0.70; or weak correlation, r < 0.30. Since P values test at r = 0, the most important information is the magnitude of the correlation.
Spearman Correlation Coefficients
RESULTS
TLV, TLG, and SULaverage
Baseline TLV ranged from 11 to 2,610 cm3, and the corresponding TLG ranged from 32 to 8,552 cm3 g/mL. With 6 wk of therapy, there was a dramatic reduction in both TLV and TLG, with a median response of 75% in each (Supplemental Figs. 1 and 2; supplemental materials are available at http://jnm.snmjournals.org). After 6 wk of therapy, TLV ranged from 0 to 1,460 cm3 and the corresponding TLG was 0 to 4,470 cm3 g/mL. Both at baseline and at 6 wk, TLG and TLV were strongly correlated, as were the percentage changes in the two with therapy (Table 1).
As is evident in Figure 2C, there was minimal variation in SULaverage despite the wide range of tumor volumes. When compared with TLV, SULaverage was a relatively minor contributor of TLG, ranging from 2.4 to 5.3 and averaging the same before and after therapy (3.64 ± 0.16 at baseline vs. 3.61 ± 0.16 at 6 wk, P = 0.87) (Fig. 3). Thus, as in Figure 4A, a side-by-side comparison of TLG and TLV, and in Figure 4B, showing the changes in the 2 measurements with therapy, TLG was essentially determined by TLV. The dominance of TLV in TLG is also evident in plots of survival versus TLV and TLG (Figs. 5A and 5B). Except for the shift to the right in the TLG figure, the 2 curves appear very similar.
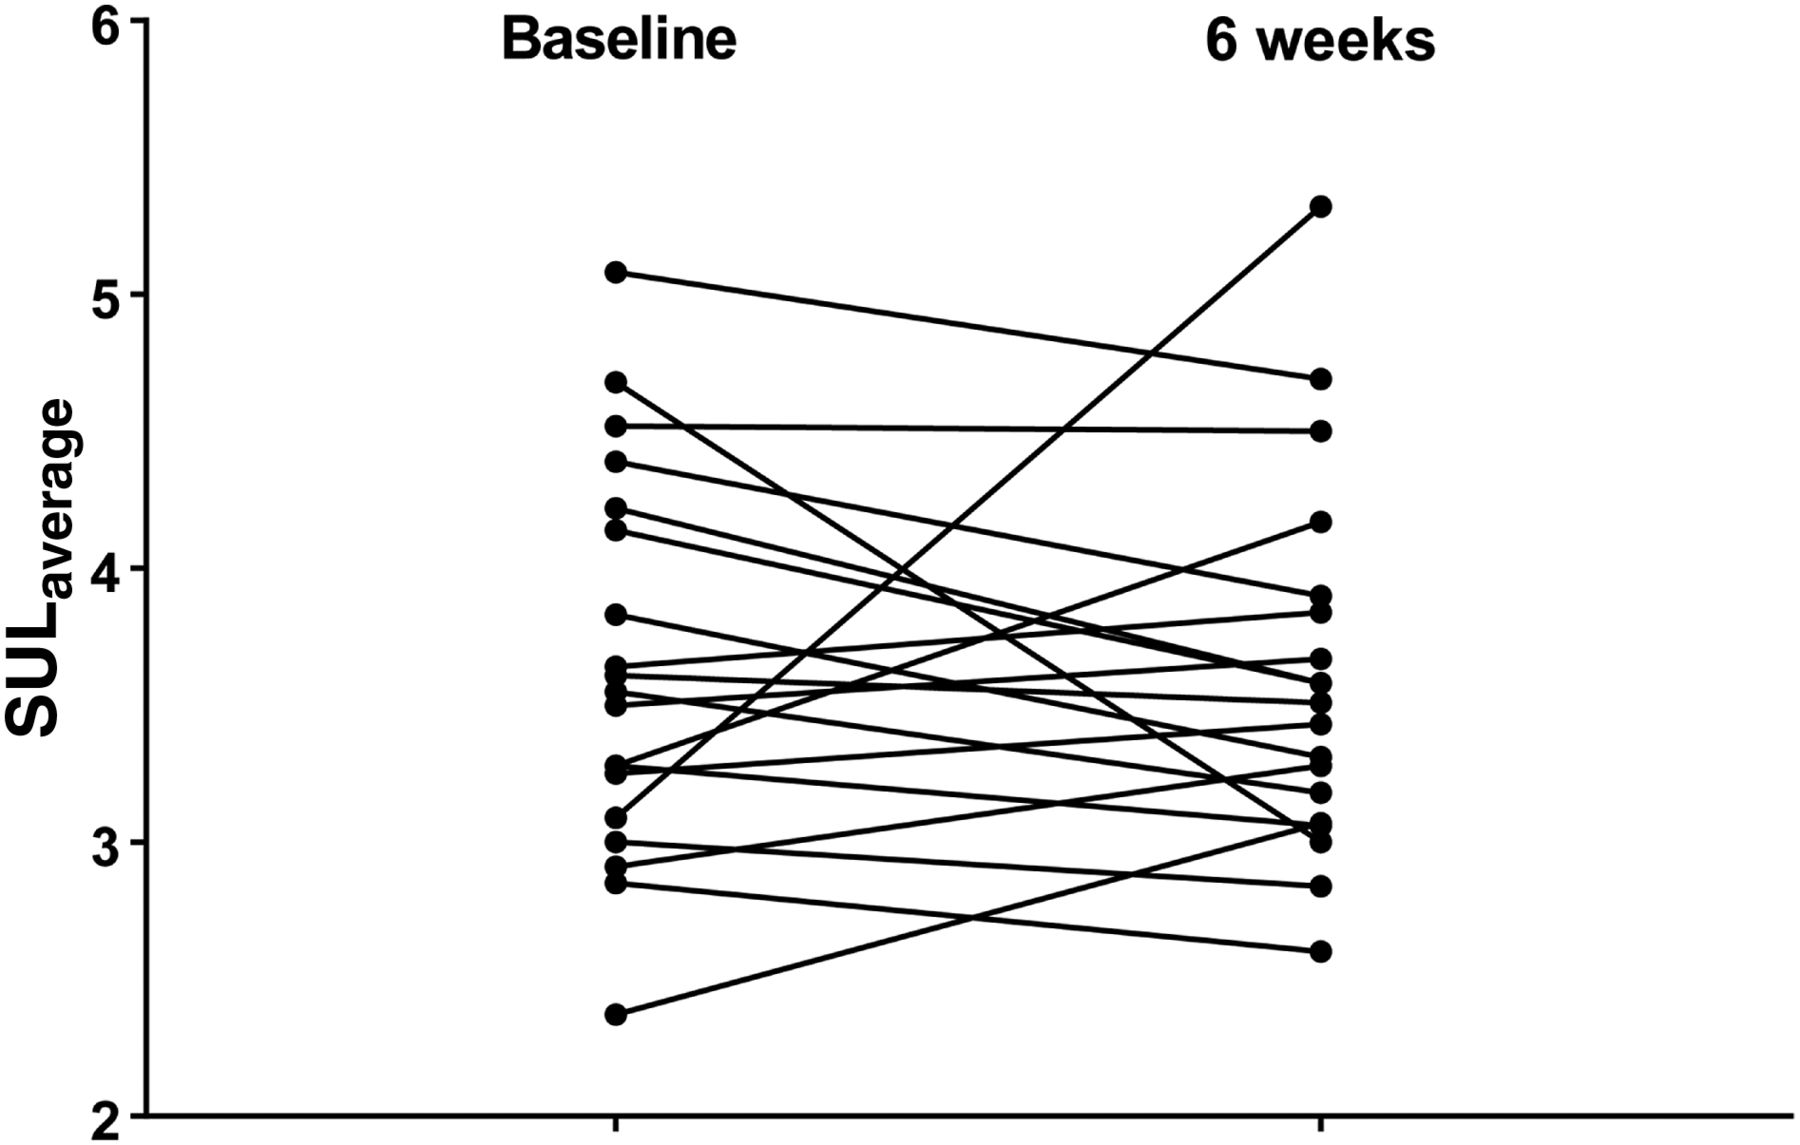
SULaverage at baseline and 6 wk.
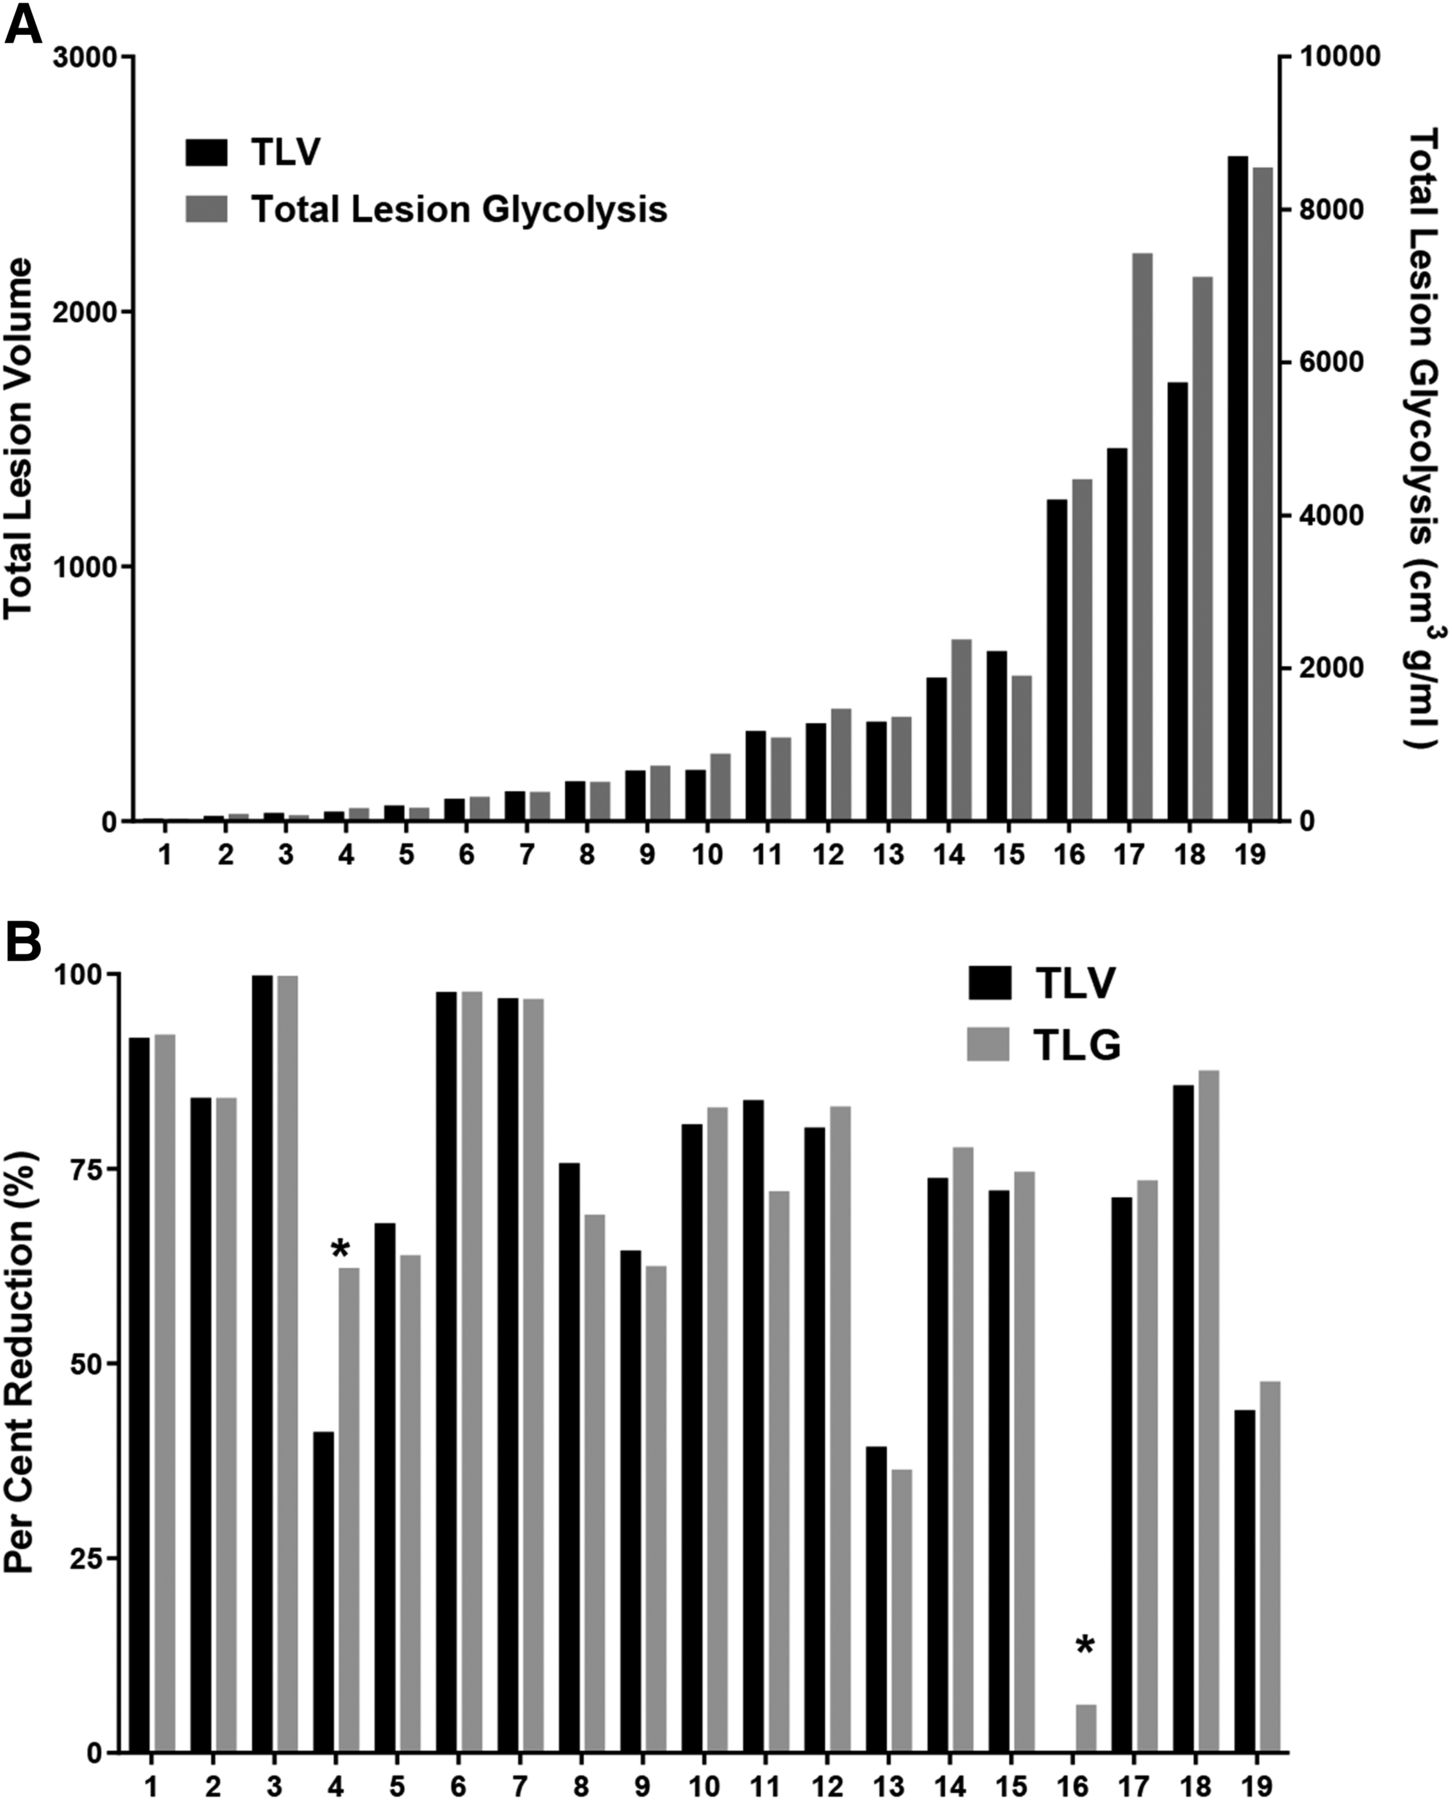
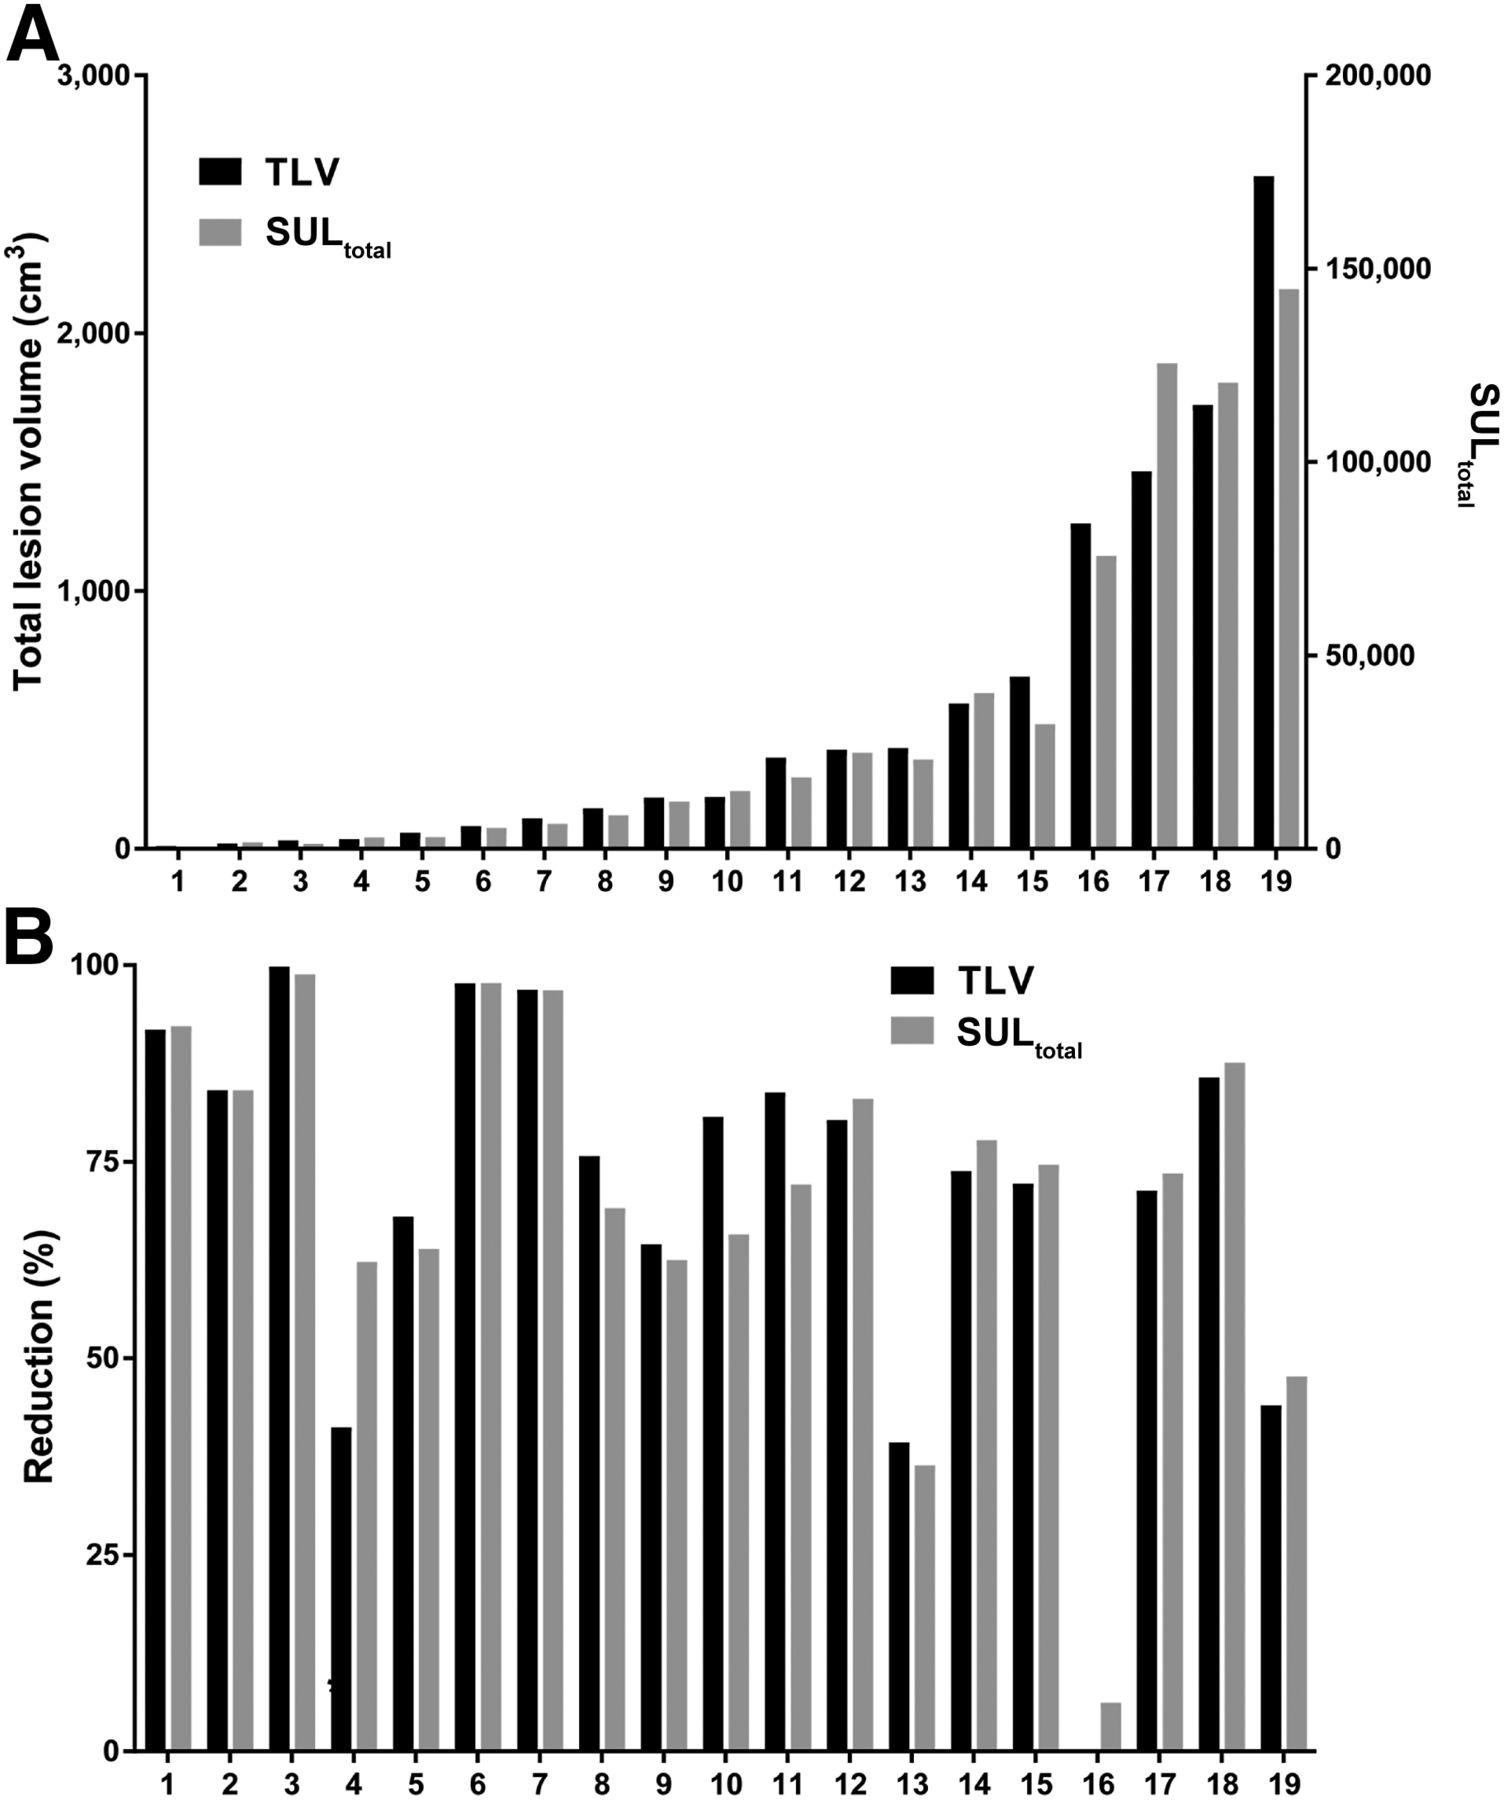
The 19 patients sorted by TLV and TLG: baseline values (A) and response to therapy (B).
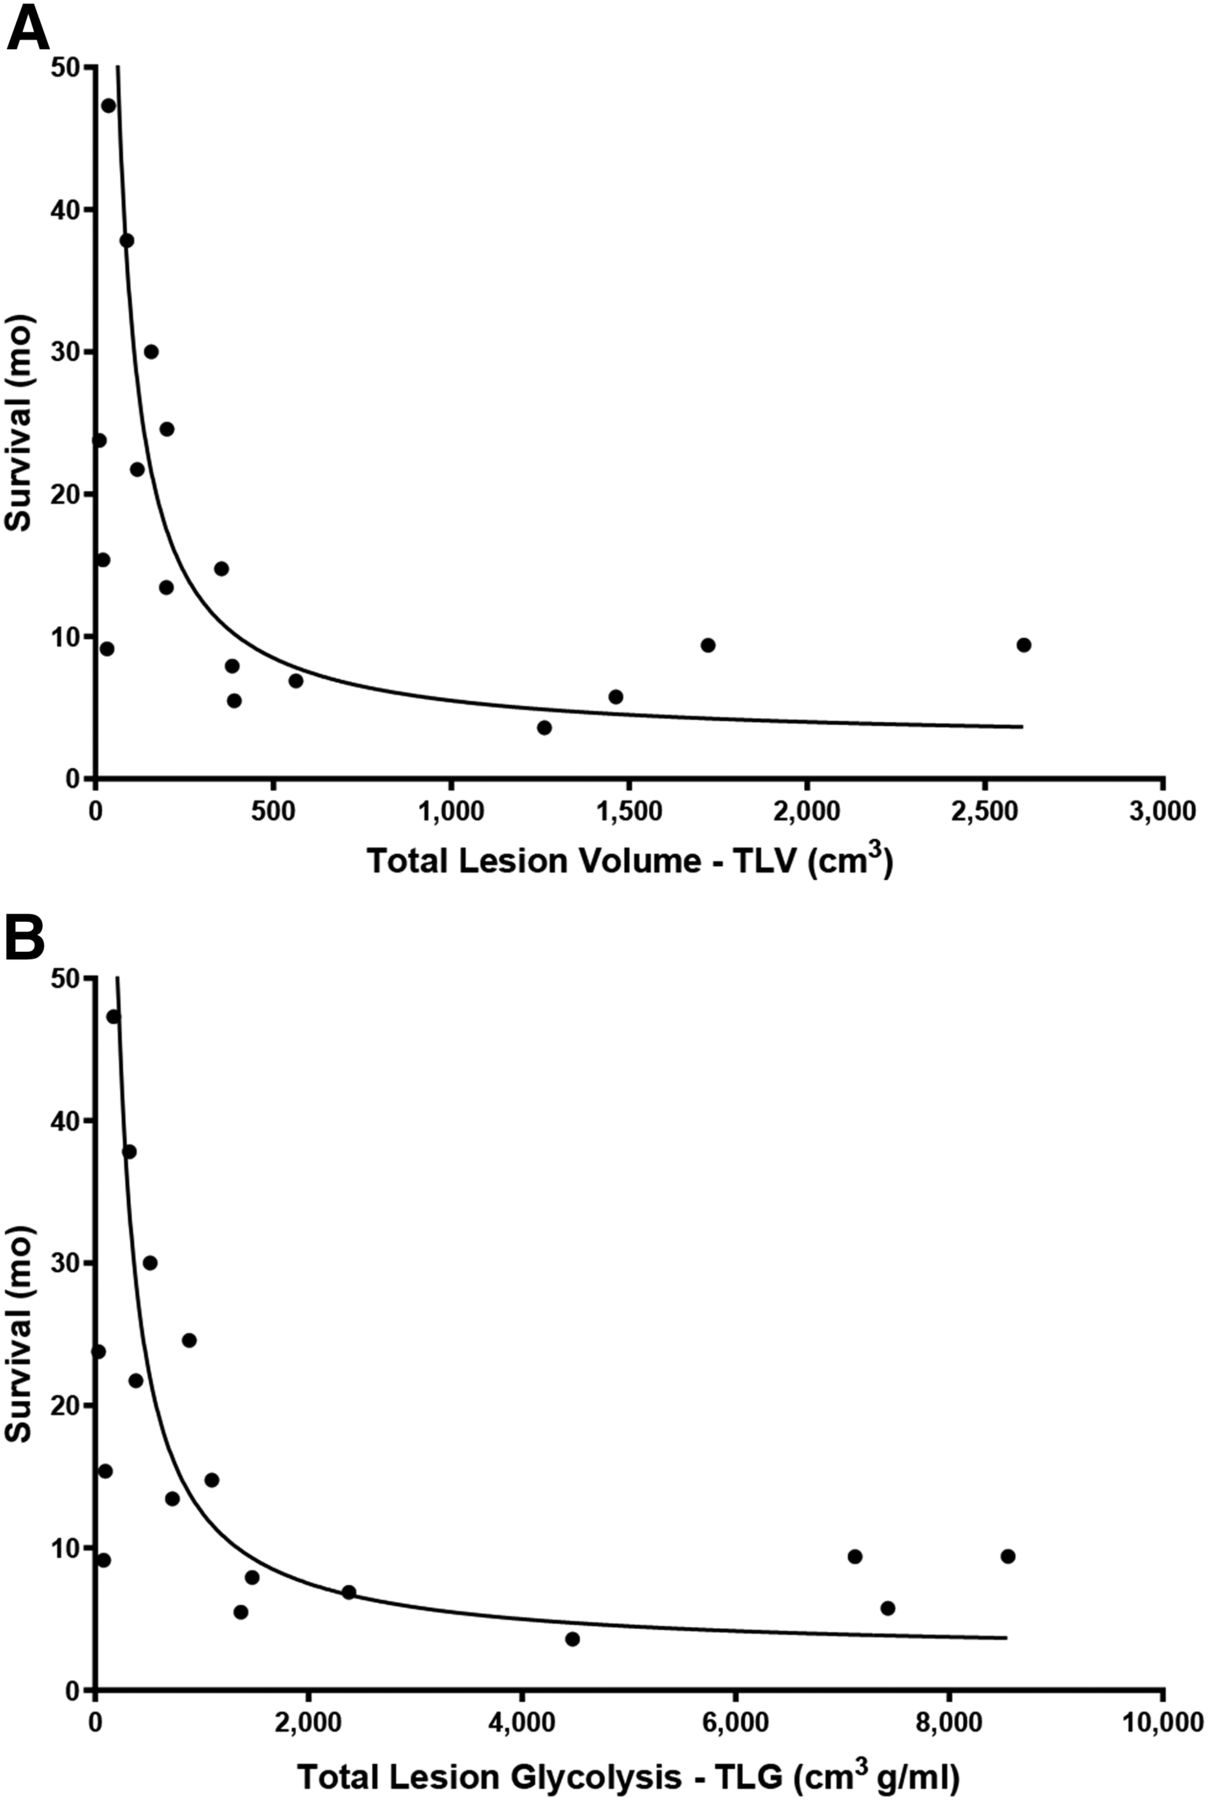
Association curves for survival vs. TLV (A) and survival vs. TLG (B). Solid line indicates inverse function. In A, survival = 3,000/TLV +2.5; in B, survival = 10,000/TLV +2.5.
SULtotal and TLV
Since voxel number equals TLV divided by the volume of a single voxel, the SULaverage formula can be written as {SULtotal/TLV} multiplied by the single voxel volume. The reason that SULaverage was relatively constant was that the ratio of SULtotal to tumor volume was relatively constant. As shown in Figure 6, SULtotal is linearly related to tumor volume. SULtotal also strongly correlates with TLV (Table 1). Since SULtotal is an expression of total 18F-FDG uptake, the relationship of SULtotal to tumor volume also means that the 18F-FDG uptake by these tumors is essentially proportional to the volume. Side-by-side comparison of SULtotal and TLV (Fig. 7A), as well as the changes in the 2 measurements with therapy (Fig. 7B), shows that as these tumors enlarged or responded to therapy, 18F-FDG uptake per tumor volume remained constant.
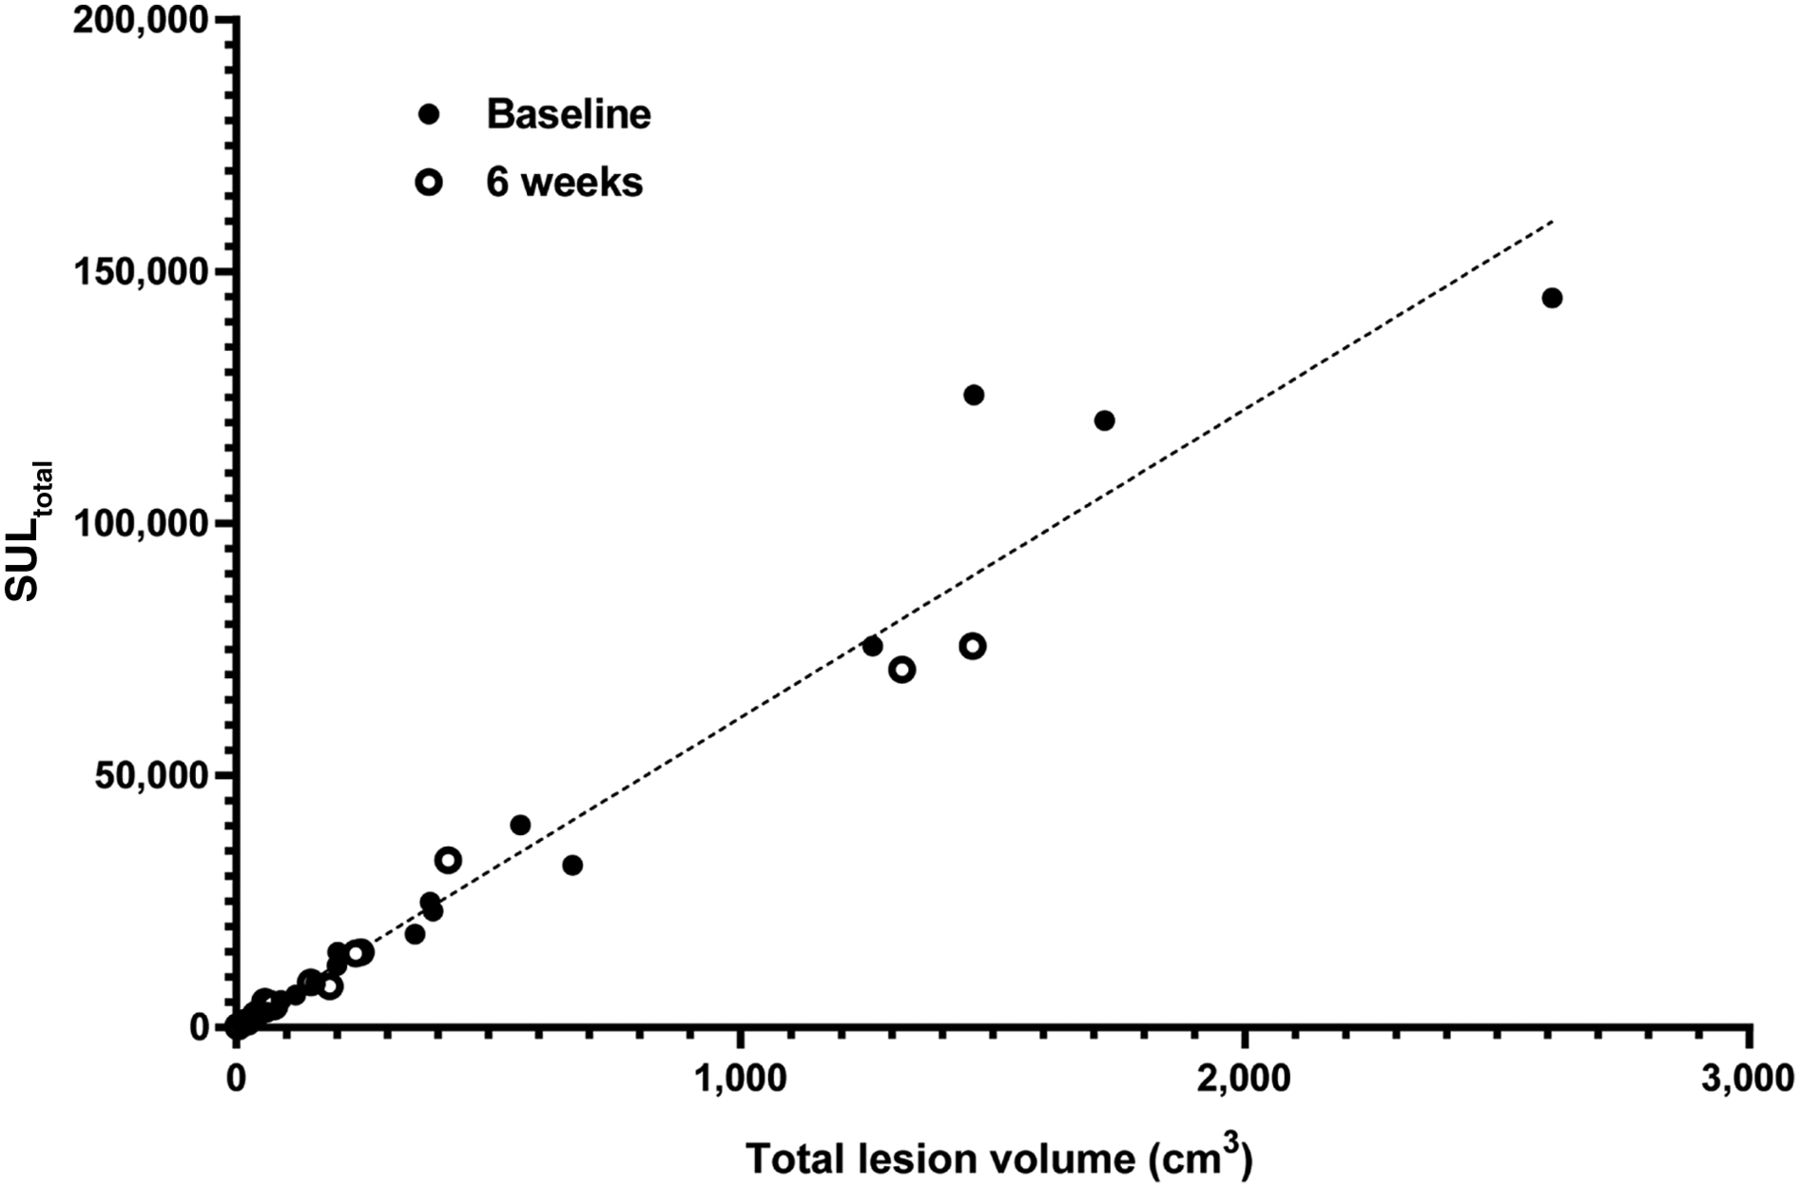
Linear plot of SULtotal vs. TLV at baseline and 6 wk. Linear regression includes all data. SULtotal = 61.18 × (TLV) + 326. r2 = 0.9575. P < 0.0001.

The 19 patients sorted by TLV and SULtotal: baseline values (A) and response to therapy (B).
DISCUSSION
Important for this study was to show that the 18F-FDG-volume program was both accurate and reproducible and that the measurements were consistent with visual interpretation of MPM 18F-FDG PET scans before and after therapy (Supplemental Fig. 1). 18F-FDG PET measurement of TLV was also correlated with modified RECIST measurements at baseline (r = 0.72, P < 0.01) and at 6 wk (r = 0.63, P < 0.01). Similar to other reports (5,6,10,11), Kaplan–Meier analysis of baseline 18F-FDG tumor volumes was also an indicator of patient survival (Supplemental Fig. 3). Perhaps more important was that the relationship of baseline 18F-FDG PET volume to survival (Fig. 5A) was similar to results in earlier reports that used CT to measure volume. Pass et al., in a groundbreaking report, showed that MPM volumes of less than 100 cm3 were associated with a median survival of 22 mo, compared with 9 mo for larger tumors (17). A more recent multicenter study also showed favorable survival for tumors smaller than 100 cm3 and short survival for tumors larger than 500 cm3 (18).
The similarity of the plots of survival versus TLV and TLG (Figs. 5A and 5B) led to the analysis of SULaverage, the second component of TLG. A surprising finding was that although tumor volumes varied greatly, SULaverage was not dependent on tumor size; it always resided within a narrow range, and its 2 components, SULtotal and TLV, were strongly correlated and linearly related. It is unknown whether the constancy of SULaverage is a peculiarity of mesothelioma or a more universal characteristic of tumors. However, it appears that as MPM tumors enlarge, the uptake of 18F-FDG increases but in proportion to the change in size. Additionally, the consistent relationship of 18F-FDG uptake to tumor volume was still evident after 2 cycles of therapy that led to dramatic reductions in tumor volume. An assumption about cancers is that as they grow, there is an increase in metabolic activity and 18F-FDG uptake per cell related to increases in Glut-1 transport and hexokinase (19,20). But that does not seem to be the case with MPM, for which the volume and 18F-FDG uptake maintain a constant ratio.
TLG was first defined by Larson et al. as a measure that could be used to assess tumor response to therapy (8). The idea was that the change in metabolic activity (TLG) was a measure of cell killing. TLG is clearly a surrogate for total metabolic activity, but because of the constancy of SULaverage, TLG in the context of MPM also reflects a volume. The fact that TLG reflects a volume may also explain why patient survival is related to TLG, because cancer survival is related to tumor volume. Therapy led to concordant responses by TLG and TLV (Fig. 4B). Again, because of the constancy of SULaverage, the relationship between TLG and TLV is one of cause and effect: a change in TLV leads to a change in TLG. Thus, as described by Larson et al., a reduction in TLG, an indicator of tumor metabolism, is a measure of cell killing, but in this instance the measured change in TLG was due to the loss of tumor volume.
In the original article describing TLG, SUVaverage (SUV body weight average) “was computed by placing a region of interest within the perimeter of the tumor region containing...the SUVmaximum” (8). Thus, like SUVmax, SUVaverage was a local value and, also like SUVmax, could change with therapy. SUVaverage was therefore included as a response variable in the 1999 European Organisation for Research and Treatment of Cancer 18F-FDG PET recommendations (21). The SULaverage described in this current report, however, is a global measurement representative of the entire tumor. Although the original definition of TLG has been carried forward (22), it is now recognized that there is a second form of the measurement based on total volume of tumor, for which SUVaverage is calculated from the entire volume (23). In our studies, we found that SULaverage has 2 characteristics. The first is that it is relatively constant for a wide range of tumor sizes. Second, we found that SULaverage was not related to overall survival (Supplemental Fig. 4). This finding is consistent with an earlier report of Veit-Haibach et al., who found that the change in SUVaverage after therapy was not predictive of patient outcome (6). In studies in which the entire volume of MPM tumor was measured using 18F-FDG PET images, SUVaverage was in the same range as our SULaverage results. Using an 18F-FDG PET global volume-of-interest program Veit-Haibach et al. studied total tumor volume, TLG, and SUVaverage in 41 MPM patients (6). SUVaverage varied from 2.5 to 6.4 for PET-measured volumes of 2.5–1,799 cm3 (6). In another study, of 13 patients with MPM, Lee found that SUVaverage ranged from 2.9 to 6.1 for PET volumes of 14.1–3,056 cm3 (5). In 8 MPM patients, Genestreti et al. found that SUVaverage ranged from 1.91 to 3.36 and was not significantly different before and after therapy (24).
The use of regional SUVaverage to calculate TLG, or the emphasis on finding clinically relevant measurements, could have led investigators away from noticing the relative constancy of SUVaverage and the finding that in MPM, SULtotal was proportional to TLV—specifically, metabolic tumor volume. In the current study, the constant proportionality of SULtotal to TLV over a wide range of tumor sizes suggests that the average 18F-FDG uptake per cell is constant despite differences in volume. The relationship of 18F-FDG uptake to cell number was previously shown by histopathologic analyses. In tumors taken from patients who had 18F-FDG PET scans, the 18F-FDG uptake correlated with the number of tumor cells, their density in tissue, and their mitotic activity (20,25,26). 18F-FDG uptake as a measure of cell number may also apply to studies in which the total metabolic activity in tumors is measured. In 1993, Alavi et al. originated the concept of total metabolic activity, a value obtained by multiplying total volume by 18F-FDG uptake per 100 cm3 of tissue (27). Recently, the concept of global tumor glycolysis (the sum of TLGs to describe the entire disease burden in patients with multiple tumors) has received more interest as a robust response indicator that can be used clinically in an ongoing fashion (28,29).
There are potential limitations to this study. First, the data were obtained from a single study involving a small number of patients. However, other reports of MPM, in which SUVmean was similar to ours, help to validate our findings. Second, MPM is spread over surfaces rather than being a localized tumor mass. Whether this distribution contributes to the specific results is unknown, but certainly, the findings should be tested for other cancers. Third, tumor types with higher metabolic activity may behave quite differently. Last, our method for determining TLV from 18F-FDG PET scans is a background-threshold approach in which liver was used as the background tissue (4). Our method for determining the threshold was patterned after PERCIST version 1, except that instead of setting the threshold as the average liver activity multiplied by 1.5 plus 2 SDs, we replaced SD with 2 SEs (13). This choice lowered our threshold so that small lesions visible in the 18F-FDG PET scans were included in the measured volume. With this threshold, the segmented MPM volume was, imagewise, consistent with the visible extent of disease.
CONCLUSION
Tumor volume is an important biomarker of survival. 18F-FDG PET measurements expressed as TLV or TLG—often considered a measure of metabolic activity—strongly correlate with each other, and both are measures of volume. In this study of MPM, there was a cause-and-effect relationship between tumor volume and TLG. This study also showed that total 18F-FDG uptake, measured as SULtotal, was always proportional to TLV even when tumors varied greatly in size or after response to therapy. This finding was totally unexpected, since standard teaching suggests that changes in metabolism as measured by 18F-FDG uptake precede changes in volume. MPM may be a special case in which 18F-FDG uptake per cell and cell proliferation change together. To an extent, our results are a reflection of measuring the entire visible tumor. The relationship between 18F-FDG uptake and total metabolic tumor volume is a global characteristic that may not reflect regional variations, such as in areas that include SUVmax and SUVpeak. This study showed that TLG and 18F-FDG uptake in MPM were measurements that reflected the tumors’ total metabolic volume. Whether these results will be obtained for other tumors needs further study.
DISCLOSURE
This work was supported by the Intramural Research Program of the National Institutes of Health, National Cancer Institute, Center for Cancer Research. No other potential conflict of interest relevant to this article was reported.
KEY POINTS
QUESTION: Is 18F-FDG tumor uptake a measure of metabolism or of tumor volume?
PERTINENT FINDINGS: In a cohort of MPM patients studied with 18F-FDG PET, the average SUL concentration per voxel was essentially constant, at a range of 2.4–5.3, despite a tumor size that varied from 1 to 2,610 cm3. This finding indicates that TLG was a volume measurement. The reason that SULaverage per voxel was relatively constant was that 18F-FDG uptake by these tumors was proportional to their volume, indicating that 18F-FDG uptake itself was a measure of tumor volume.
IMPLICATION FOR PATIENT CARE: 18F-FDG tumor uptake, commonly considered a measure of tumor metabolism, is also a measure of tumor volume, a finding that applies to MPM and probably other tumors as well.
Acknowledgments
We thank Millie Ann Whatley, the research scan manager.
Footnotes
Published online Apr. 13, 2020.
- © 2020 by the Society of Nuclear Medicine and Molecular Imaging.
REFERENCES
- Received for publication October 24, 2019.
- Accepted for publication February 26, 2020.


Jump to section
Related Articles
Cited By...
- No citing articles found.