


Abstract
Compared with conventional, whole-organ, S-factor-based dosimetry, 3-dimensional (3D), patient-specific dosimetry better accounts for radionuclide distribution and anatomic patient variability. Its accuracy, however, is limited by the quality of the cumulated activity information that is provided as input. This input has typically been obtained from SPECT and planar imaging studies. The objective was to implement and evaluate PET-based, patient-specific, 3D dosimetry for thyroid cancer patients. Methods: Three to 4 PET imaging studies were obtained over a 7-d period in 15 patients with metastatic thyroid carcinoma after administration of 124I-NaI. Subsequently, patients were treated with 131I on the basis of established clinical parameters. Retrospective dosimetry was performed using registered 124I PET images that were corrected for the half-life difference between 124I and 131I. A voxel-by-voxel integration, over time, of the resulting 131I-equivalent PET-derived images was performed to provide a single 3D dataset representing the spatial distribution of cumulated activity values for each patient. Image manipulation and registration were performed using Multiple Image Analysis Utility (MIAU), a software package developed previously. The software package, 3D-Internal Dosimetry (3D-ID), was used to obtain absorbed dose maps from the cumulated activity image sets. Results: Spatial distributions of absorbed dose, isodose contours, dose-volume histograms (DVHs), and mean absorbed dose estimates were obtained for a total of 56 tumors. Mean absorbed dose values for individual tumors ranged from 1.2 to 540 Gy. The absorbed dose distribution within individual tumors was widely distributed ranging from a minimum of 0.3 to a maximum of 4,000 Gy. Conclusion: 124I PET-based, patient-specific 3D dosimetry is feasible, and sequential PET can be used to obtain cumulated activity images for 3D dosimetry.
Motivated primarily by the interest in targeted radionuclide therapy of cancer (1–3), patient-specific, 3-dimensional (3D) imaging-based dosimetry is the subject of ongoing investigation (4–14). Using a software package, 3D-Internal Dosimetry (3D-ID), that was developed in-house (13,15), we previously performed a dosimetric analysis of 131I-labeled anti-CD20 antibody therapy for patients with non-Hodgkin’s lymphoma (12). In that study, and in other reported studies of 3D imaging-based dosimetry (5), multiple planar images were used in combination with a single SPECT image. The planar images were used to obtain kinetic information, and SPECT imaging was used to provide information regarding the spatial distribution of radioactivity. With this approach the spatial distribution of cumulated activity values within a region of interest is obtained, assuming that the activity distribution obtained from SPECT at a single time point applies throughout the entire uptake and clearance period of the radiopharmaceutical.
In this study, we used 124I PET imaging (16,17) in a fully 3D imaging-based dosimetry method in which multiple PET images defined the spatial distribution of radioactivity at different times after administration of the radiopharmaceutical. We expected the approach to provide more accurate estimation of the cumulated activity distribution because the assumptions made using the SPECT planar approach described above were not necessary. Furthermore PET provides a greater quantitative accuracy compared with SPECT; correspondingly, we expected the output provided by 3D imaging-based dosimetry (dose-volume histograms [DVHs]) (18) and images of the absorbed dose distribution) to yield absorbed dose information that would better correlate with tumor response and normal organ toxicity. We examine the feasibility of the method, retrospectively, using data collected from patients with thyroid cancer.
Thyroid cancer therapy using radioiodine was perhaps the first example of patient-specific treatment planning for radionuclide therapy. The method, originally described by Benua and Leeper (19,20), required administration of a tracer amount of 131I followed by sequential whole-body counting and blood sample collection to project the absorbed dose to blood and the radioactivity retention in the lungs per unit administered activity. This information was then used to constrain the therapeutic administered activity so that the blood absorbed dose would not exceed 200 cGy and, if the patient exhibited diffuse lung uptake, the 48-h lung retention would not exceed ≈3 GBq (80 mCi). These limits were based on dose versus toxicity information obtained from an extensive collection of prior patient treatments. It is important to note that this straightforward and clinically implementable approach has been generally successful in thyroid cancer therapy, with failures arising primarily when tumor cells lose the ability to concentrate iodine. The retrospective analyses provided in this article are intended to demonstrate feasibility of a dosimetry methodology best applied to radioimmunotherapy or radiopeptide targeted therapy rather than to suggest that a fully 3D, patient-specific methodology is required in radioiodine therapy of thyroid cancer.
MATERIALS AND METHODS
Data from 15 patients with metastatic thyroid carcinoma of mixed papillary and follicular variants were analyzed. The patients underwent 124I PET scanning before radioiodine therapy with 131I. After administration of 74–158 MBq of 124I-NaI, 3 PET imaging studies were obtained at approximately 4, 20, and 44 h, with a fourth at 4−6 d, when possible. Subsequently, patients were treated according to the 131I treatment protocol for thyroid cancer established at Memorial Sloan-Kettering Cancer Center (19); the administered activity for therapy ranged from 3.8 to 16 GBq (100–420 mCi, respectively).
Whole-body PET scans were collected on the General Electric Advance PET scanner. To image the body from the head to midthigh, five to seven 15-cm axial fields were used. Emission scans were acquired for 6 min per field and transmission scans, used for attenuation correction, for 3 min per field. The total imaging time per patient was approximately 1 h. Standard clinical software available on the Advance scanner was used to generate ordered-subsets expectation maximization (OSEM) reconstructed images (4.3-mm isotropic voxels).
The software package, Multiple Image Analysis Utility (MIAU) (21), was used to process the reconstructed PET images for 3D-ID dosimetry calculations. The 3D images were first converted into a 4-dimensional image set where the fourth dimension provided an index for the time after injection. The resulting image sets, describing the 124I activity concentrations at each time point, were converted to corresponding images of the 131I activity concentrations. The method implemented in MIAU to accomplish this is described by the following equation:
 Eq. 1 with A124(x,y,z,t) = 124I activity concentration at positions x, y, and z at time t; λ124 = decay rate of 124I = ln(2)/4.18 d; λ131 = decay rate of 131I = ln(2)/8.04 d; and A131(x,y,z,t) = 131I activity concentration at positions x, y, and z at time t.
Equation 1 is based on the assumption that the biologic half-lives of 124I and 131I are identical. Because both decay by β-emission and because the total particulate energy emitted by 124I is very similar to that of 131I (2.9 vs. 3.0 × 10⁻¹⁶ J, respectively), this assumption is reasonable; the difference in half-lives translates to a difference in initial dose rates, which is also the case when tracer levels of 131I are used to predict therapeutic 131I kinetics. The 131I-equivalent images, at each point in time, were then registered to each other using MIAU. As has been previously described (22), the registration method implemented in MIAU is semiautomated; the user identifies anatomic landmarks appearing in the 3 orthogonal views of the display software. MIAU uses appropriate translation rotation and scaling transformations to align the 2 images by matching the selected anatomic landmarks; alternatively, the user may manually scale, translate, and rotate the images by providing parameter values. When no anatomic landmarks were visible, the corresponding transmission images were registered, as described above, to provide the transformation parameters, which were then applied to the emission images.
To obtain 3D cumulated activity images, the registered image sets were integrated, voxel by voxel, over time (22). In general, if the number of imaging time points were <5 (as was the case for all patients reported here), a numeric (Simpson’s) integration was performed starting from the first time point and ending at the last measured time point. Integration beyond the last data point was performed by analytically integrating a monoexponential function. The exponential rate was determined by fitting the last 2 imaging time points to an exponential expression. If the decay-corrected exponential rate was positive or zero, indicating uptake of activity over time in a particular voxel, the physical decay rate of 131I was used in the analytic expression. Otherwise, the fitted decay rate was used. The algorithm is described by the following set of equations:
 Eq. 2 with λxyz = the fitted biologic clearance or uptake rate obtained at positions x, y, and z; λp = the physical decay rate of 131I; ti = the first imaging time point; tf = the last imaging time point; and Stitf denotes numeric integration between ti and tf.
Absorbed dose maps were obtained using 3D-ID. A previously published 131I point kernel (23), modified to include local deposition of electron energy, was used in a point-kernel-based calculation. Tumor-specific absorbed dose parameters were obtained by drawing contours around tumors seen on the 124I PET emission images and then transposing them to the absorbed dose images; diffuse lung disease, or foci of activity that were too small for accurate contour drawing (e.g., no greater than 4–5 voxels or 0.4 cm3), were not included in the individual tumor analysis. The volume for each tumor-specific contour drawn above was obtained using 3D-ID and used to examine the tumor volume versus absorbed dose relationship. Tumor and subregion contours were drawn manually or by using a seed-growing algorithm, available in 3D-ID, that implements an adaptive thresholding algorithm developed by Erdi et al. (24). In selected tumors, which showed a highly nonuniform absorbed dose distribution, contours were drawn around selected foci of activity and kinetic parameters for individual foci within the tumor were compared with the overall tumor kinetics. The comparison was made by calculating the subregion cumulated activity using whole tumor kinetic parameters and then scaling this for each subregion according to the activity concentration within each subregion obtained at different imaging times. The percentage difference in cumulated activity values was then equivalent to the percent difference in absorbed doses.
RESULTS
Spatial distributions of absorbed dose, isodose contours, DVHs, and mean, minimum and maximum absorbed dose values for 56 individual tumors were obtained. As shown on Table 1, the mean absorbed dose over each tumor volume ranged from 1.2 to 540 Gy; the spatial variability in absorbed dose across all tumors was very broad, ranging from 0.3 to 4,000 Gy. The frequency distribution depicted in Figure 1 shows that the majority of the tumors examined received a mean absorbed dose that was less than 100–120 Gy, with 11 of the 56 tumors receiving a mean absorbed dose greater than 120 Gy.

Histogram representing number of tumors receiving a particular absorbed dose range. Each bar corresponds to 10-Gy dose range, with first bar corresponding to dose range 0 to <10 Gy.
Range in Mean, Minimum, and Maximum Absorbed Dose Values for 56 Tumors
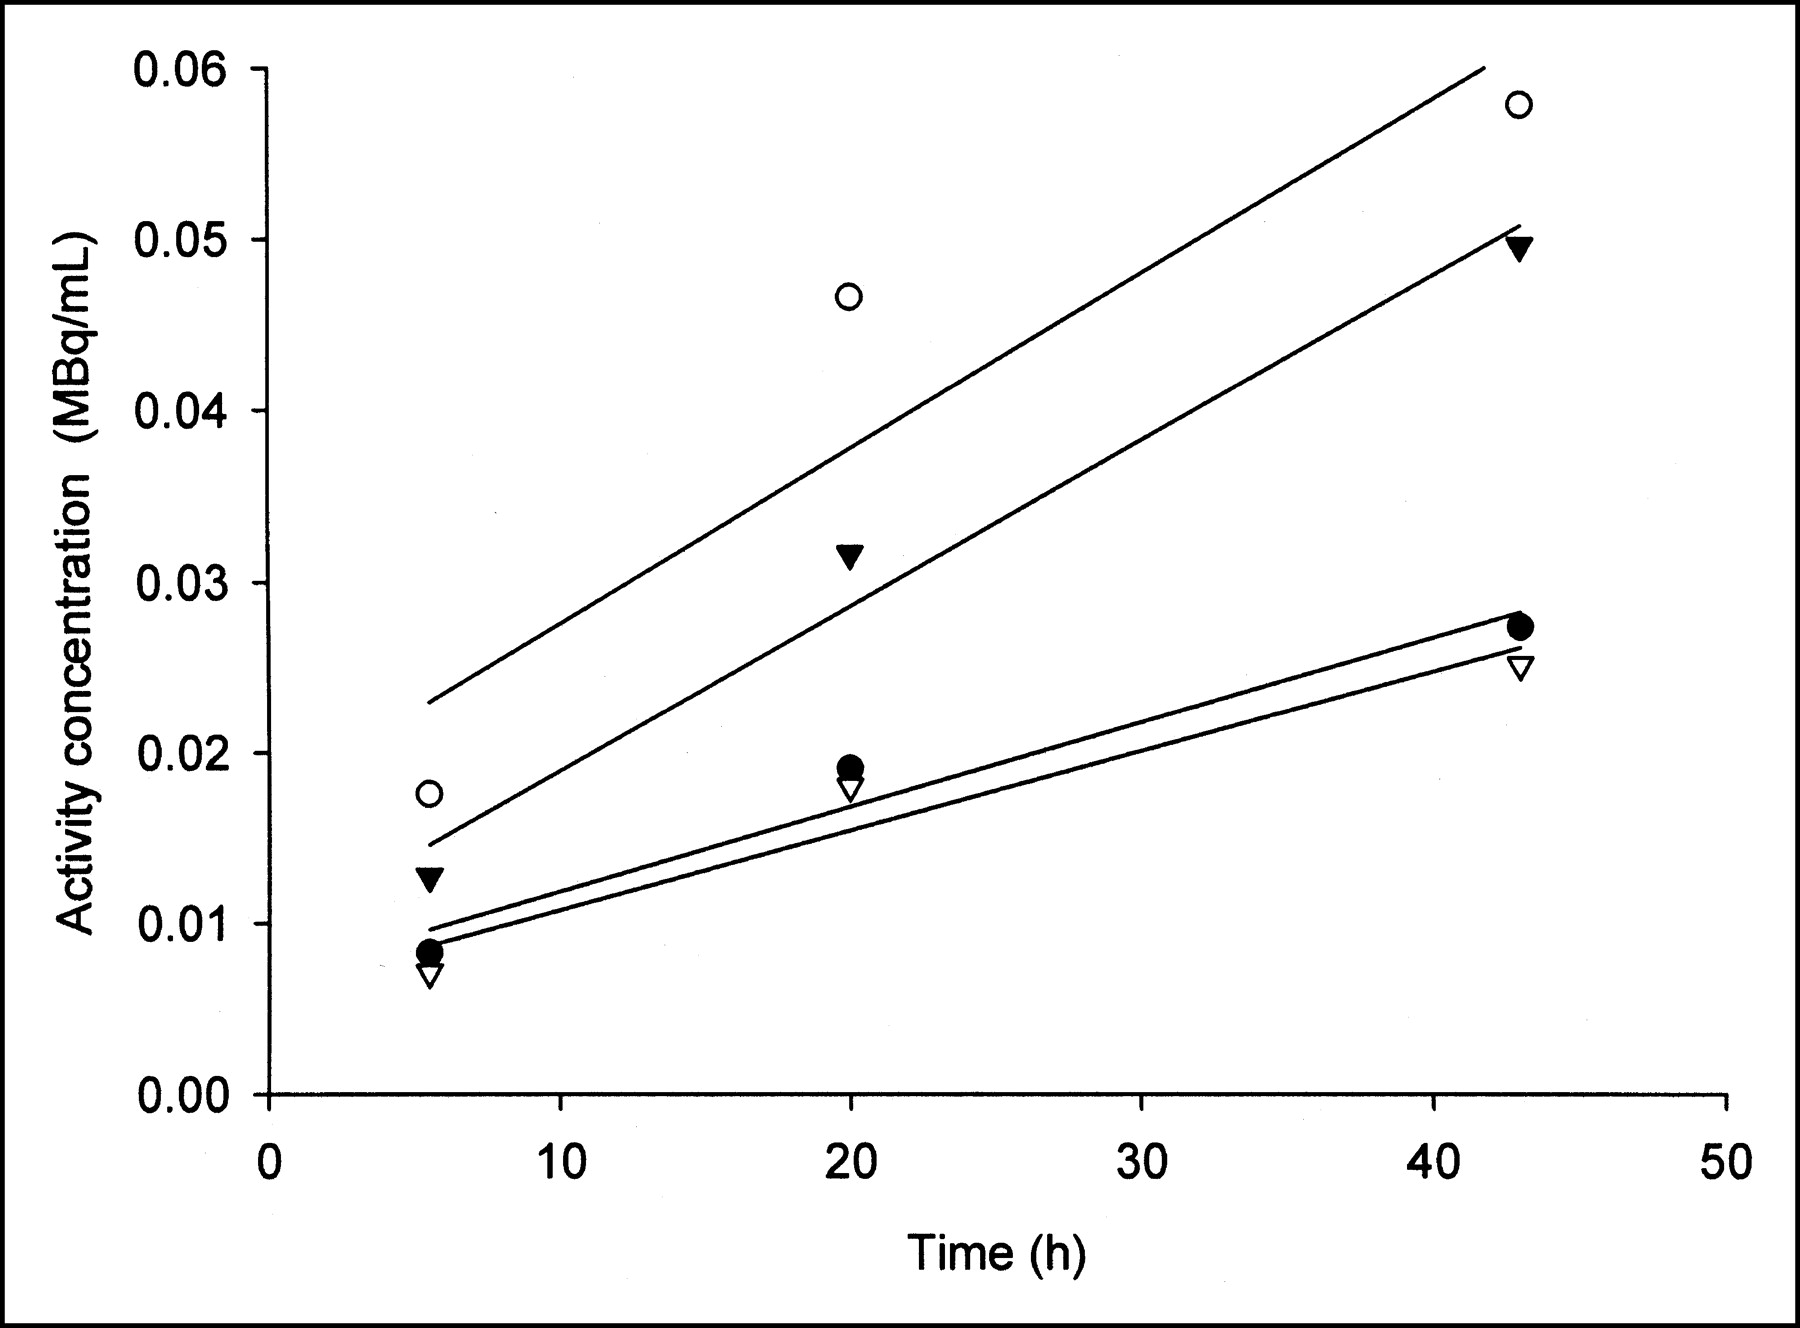
There was also substantial variability in the absorbed dose to different tumors within a single patient (Table 2). Figure 2 depicts selected coronal PET image slices and a summed coronal projection of the PET images in patient 13. The images show a large, 350-cm3 tumor in the right hip (T1), 150-cm3 tumors in the right lower lateral chest wall (T2) and left scapular region (T3), and a 9.5-cm3 tumor in the right midfemoral diaphysis (T4). Summed coronal PET images from the initial (day 0) and subsequent 2 PET studies (Fig. 3A) show clearance of 124I from the body background with uptake over this time period in tumors and some retention in the liver (25,26). Corresponding transverse slices through tumor 2 (T2) show the spatial nonuniformity of uptake within a single tumor. Three foci of activity are evident within the tumor. The spatial distribution of absorbed dose within this tumor is shown in Figure 3B. Time-activity plots (Fig. 4) for the 3 foci and for the whole mass show uptake of activity over the 3-d period with 2 of the foci having, approximately, a 2-fold greater uptake rate than the rate determined from the whole tumor volume. The impact of neglecting the observed variations in uptake rate by assuming a static spatial distribution of activity, as obtained from a single SPECT or PET scan and then applying whole-tumor kinetics, was examined as described in the Methods section. Table 3 lists the percent difference in actual versus derived absorbed dose values for the 3 tumor foci shown in Figure 3B and assuming scaling that is based on different imaging times. The derived absorbed dose values are based on kinetics averaged over the whole volume of tumor T2 in patient 13 (plotted in Fig. 4). The results show an imaging time-dependent variability in the percentage difference for different tumor regions. In the example shown in Table 3, the absorbed dose to region 1 was underestimated by as much as 56% and the dose to region 3 was overestimated by 10%, depending on the imaging time used.
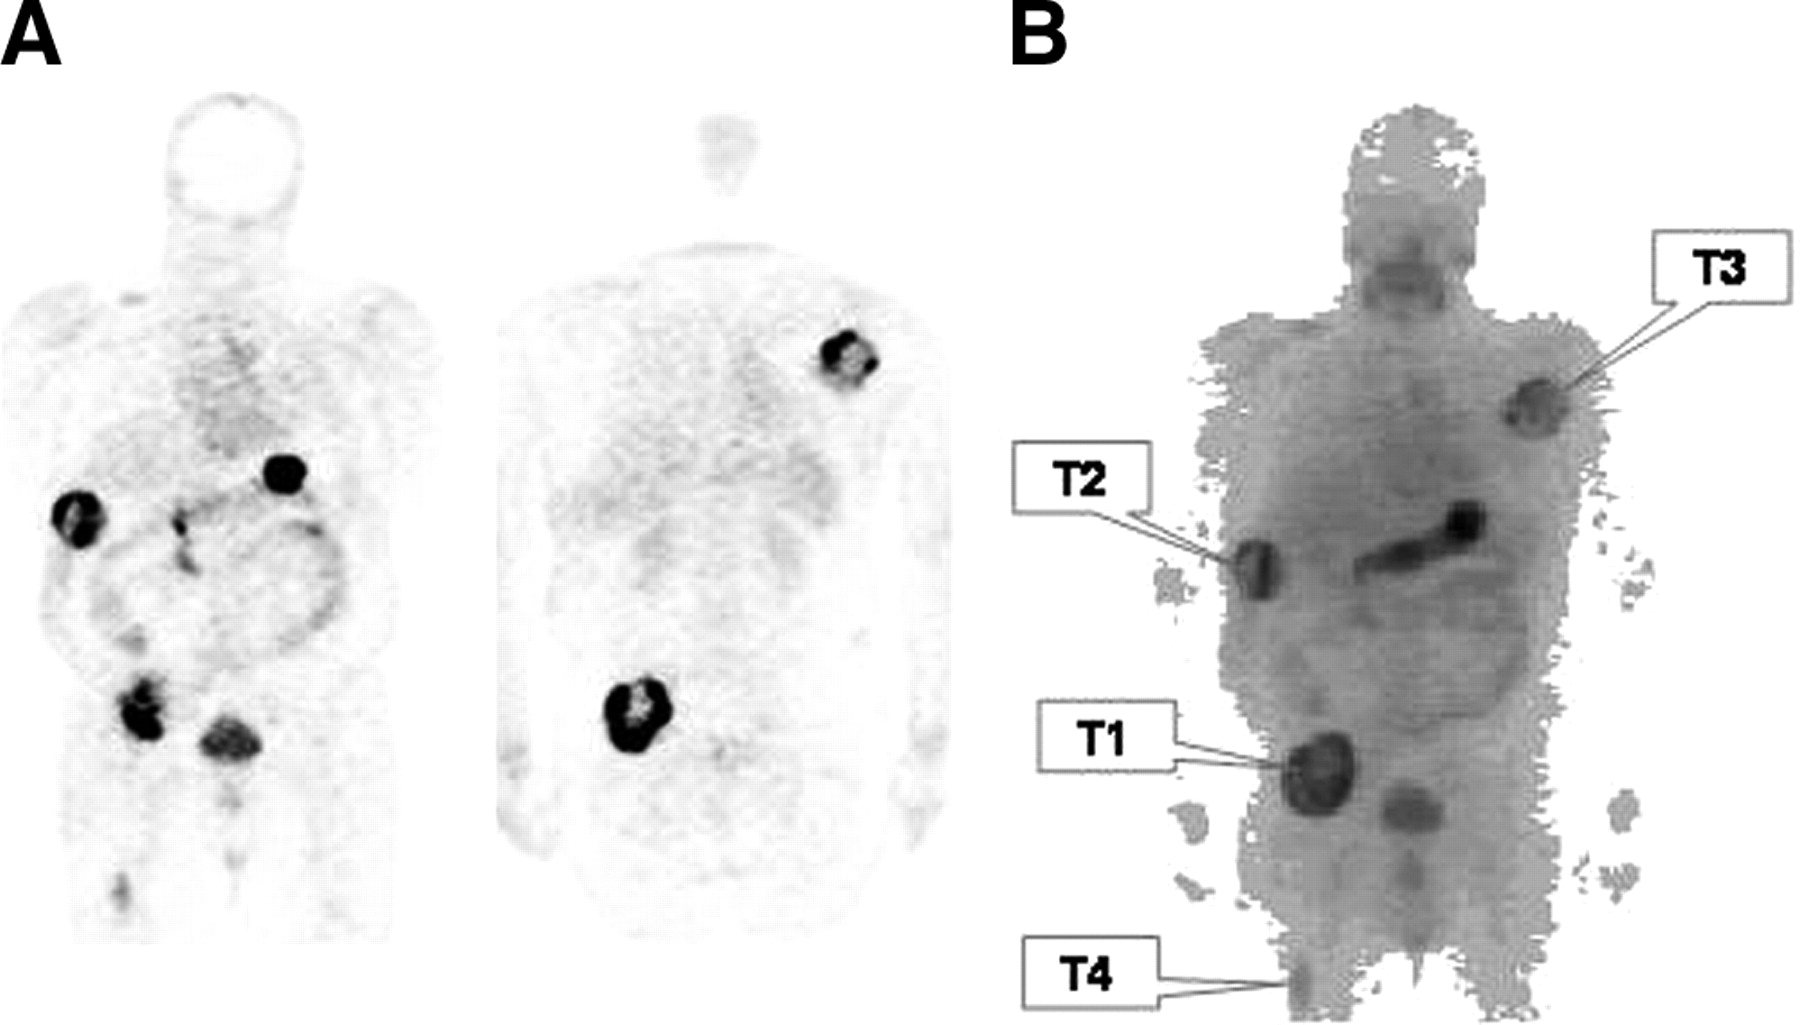
Selected coronal 124I PET image slices (A) and sum of all coronal slices (B) with each tumor identified for patient 13. Summed coronal image was obtained using MIAU software package.
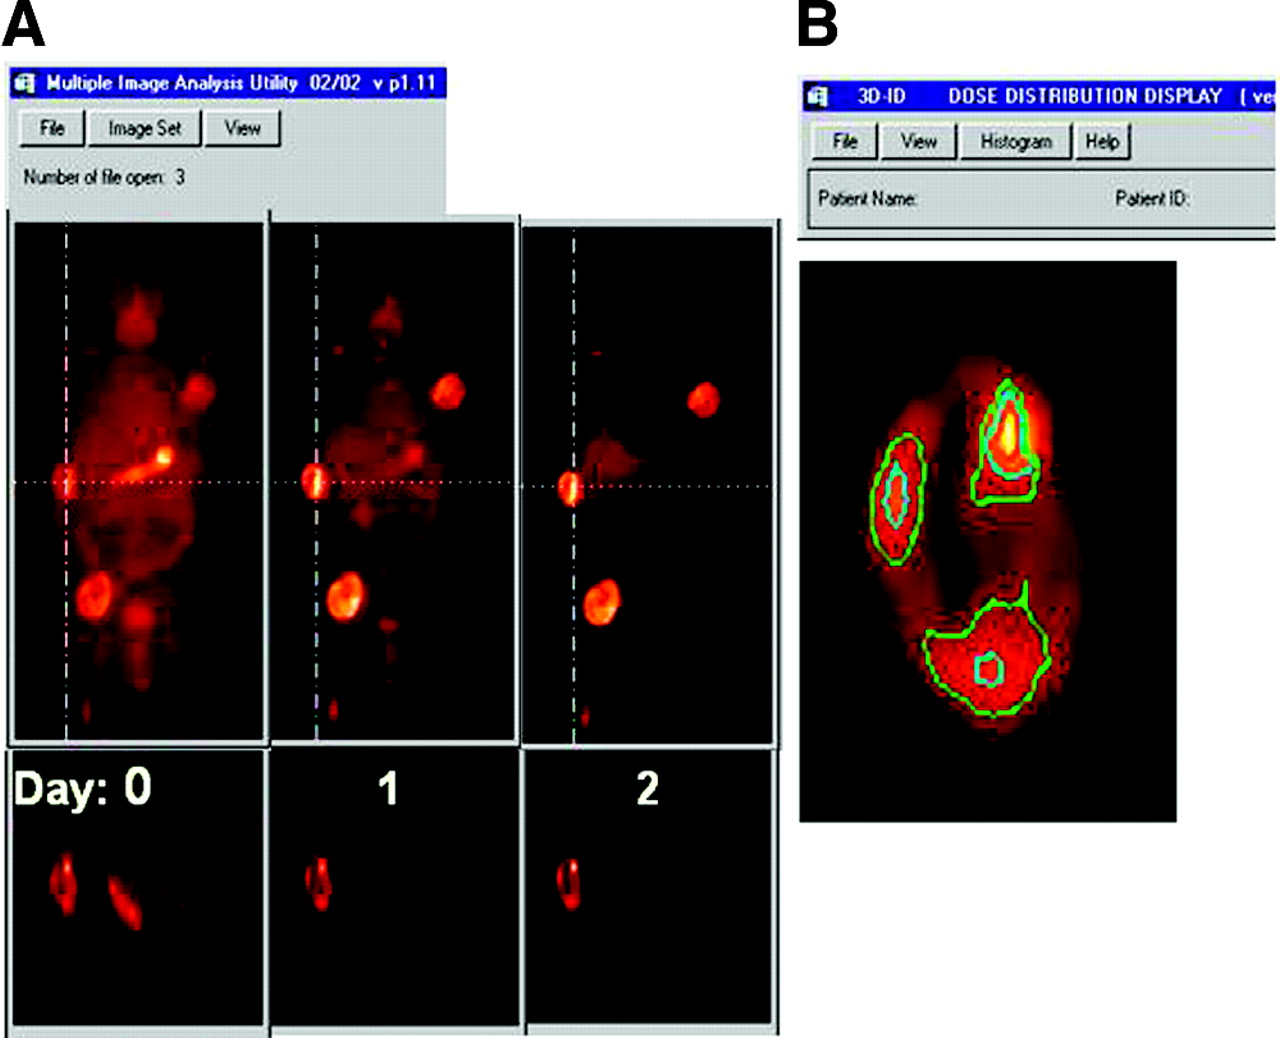
(A) Summed coronal 124I PET image slices obtained on day of 124I administration (day 0) and on subsequent 2 days are depicted using same intensity level. Cross-hairs show plane of intersection for corresponding transverse slices through tumor 2, shown immediately below coronal images. (B) Image of absorbed dose distribution in tumor 2, magnified to highlight spatial distribution of absorbed dose within this tumor. Color-coded isodose contours are superimposed as follows: yellow = 75%, red = 50%, blue = 25%, and green = 10% of maximum absorbed dose to tumor (400 Gy). Three different foci of enhanced absorbed dose are observed and designated 1–3 as shown.
Mean, Minimum, and Maximum Absorbed Dose in Individual Tumors of Patient 13
Impact of Assuming Whole-Tumor Kinetics on Dose Distribution
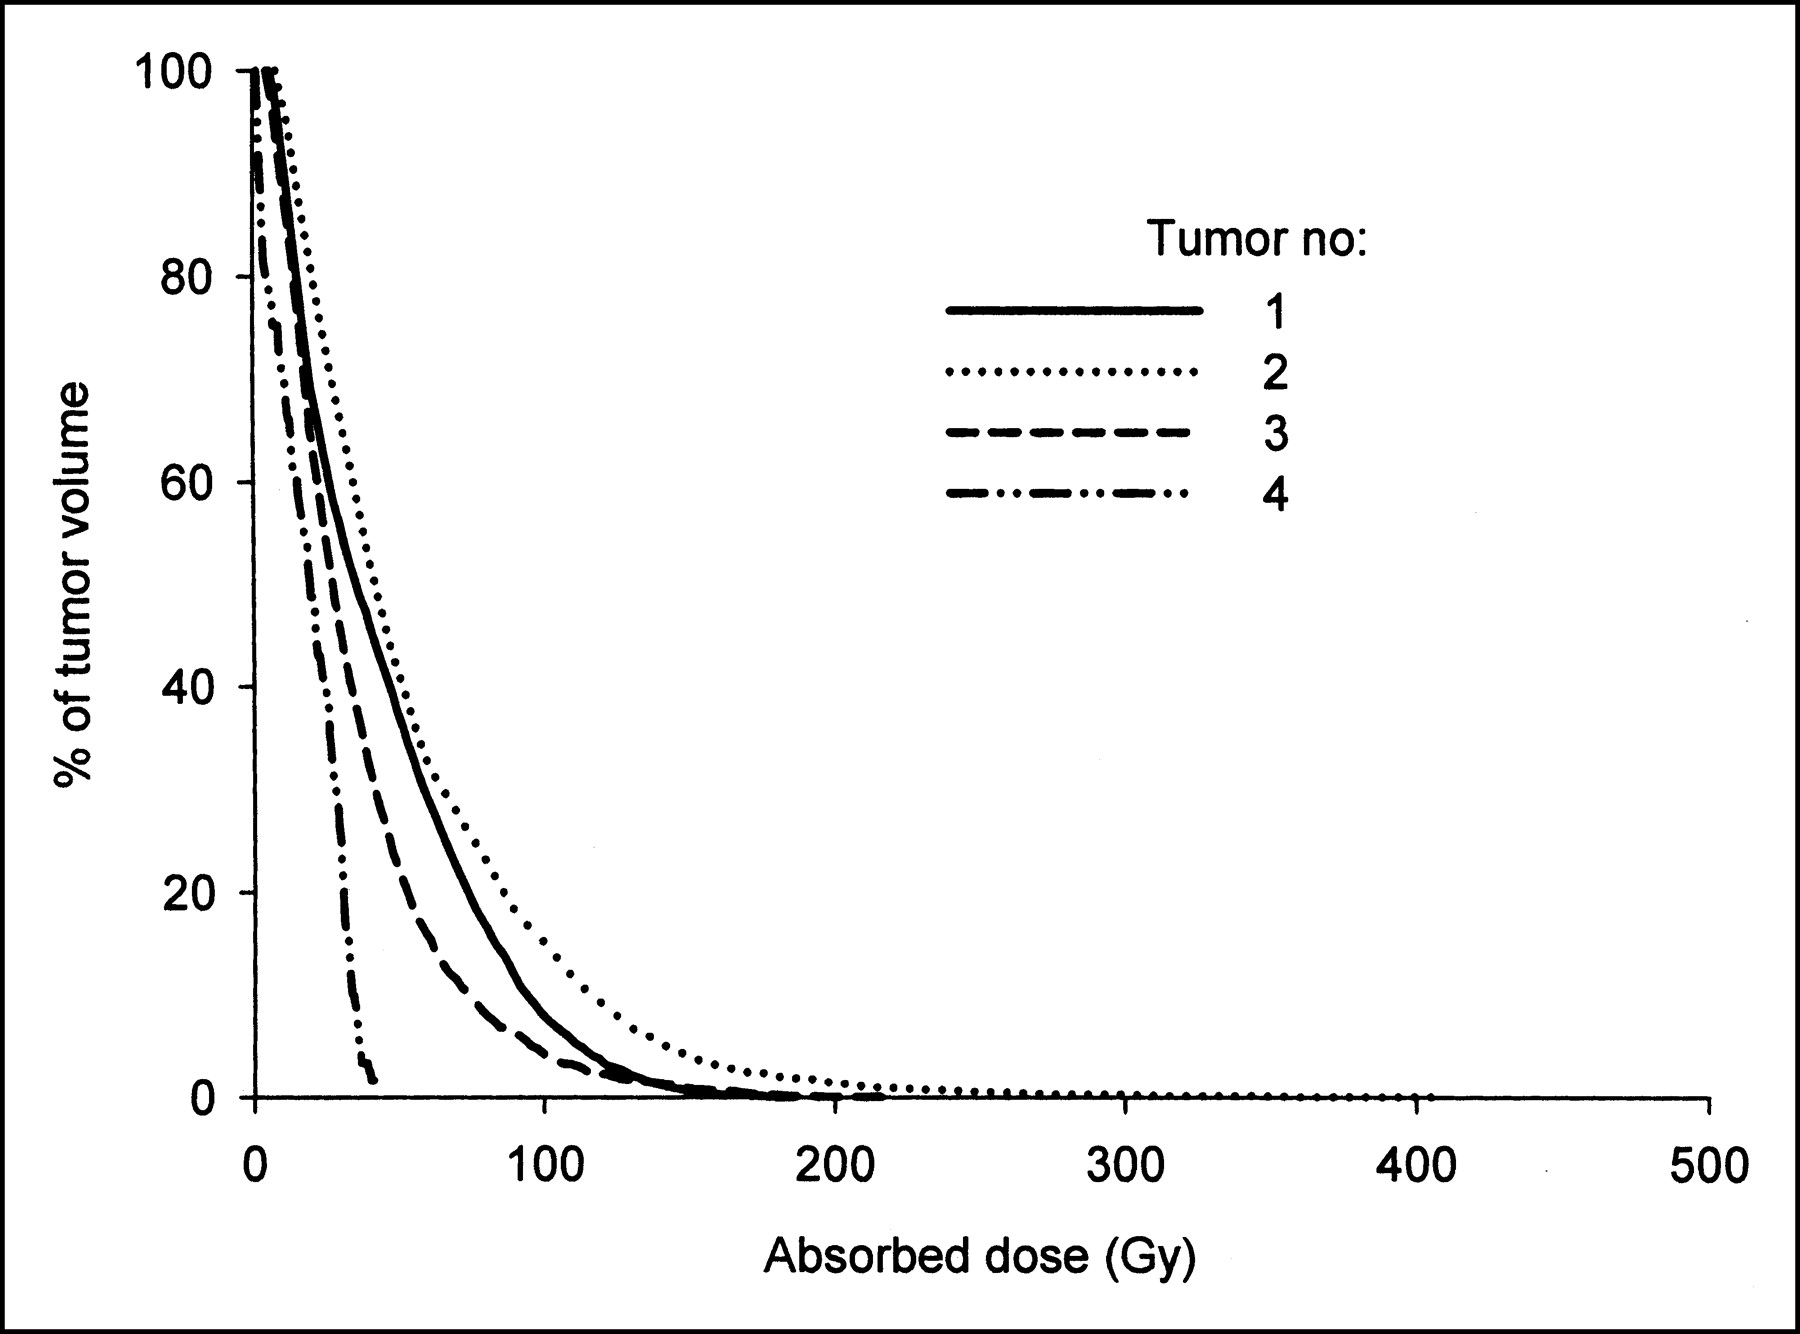
As shown in the DVHs (Fig. 5) and in Table 2, tumor 2 exhibited the widest range in absorbed dose values. The mean absorbed dose to this tumor was 52 Gy, with subvolumes of the tumor receiving a minimum of 3.8 and a maximum of 400 Gy. Both the DVH curves and Table 2 show that this tumor received the most favorable absorbed dose distribution, having the highest minimum, mean, and maximum absorbed dose values of the 4 tumors analyzed in this patient.

DVHs for 4 tumors shown in Figure 2.
Tumor imaging and absorbed dose parameters for patient 16 are shown in Figures 6 and 7 and in Table 4. This patient exhibited diffuse bilateral lung activity, as well as uptake in the neck, the superior mediastinum, and near the left posterior chest wall area; 5 individual tumor foci were selected for 3D-ID dose calculation (Fig. 6). The plot of tumor DVHs (Fig. 7) shows that tumor 4 received the most favorable absorbed dose distribution, with approximately 70% of the tumor volume receiving an absorbed dose greater than 250 Gy. Consistent with the DVHs, Table 4 shows that tumor 4 received the largest mean absorbed dose of the 5 tumors considered in this patient. Of greater importance to tumor response, the minimum absorbed dose to the tumor volume was >2-fold greater than the minimum of the other tumors.
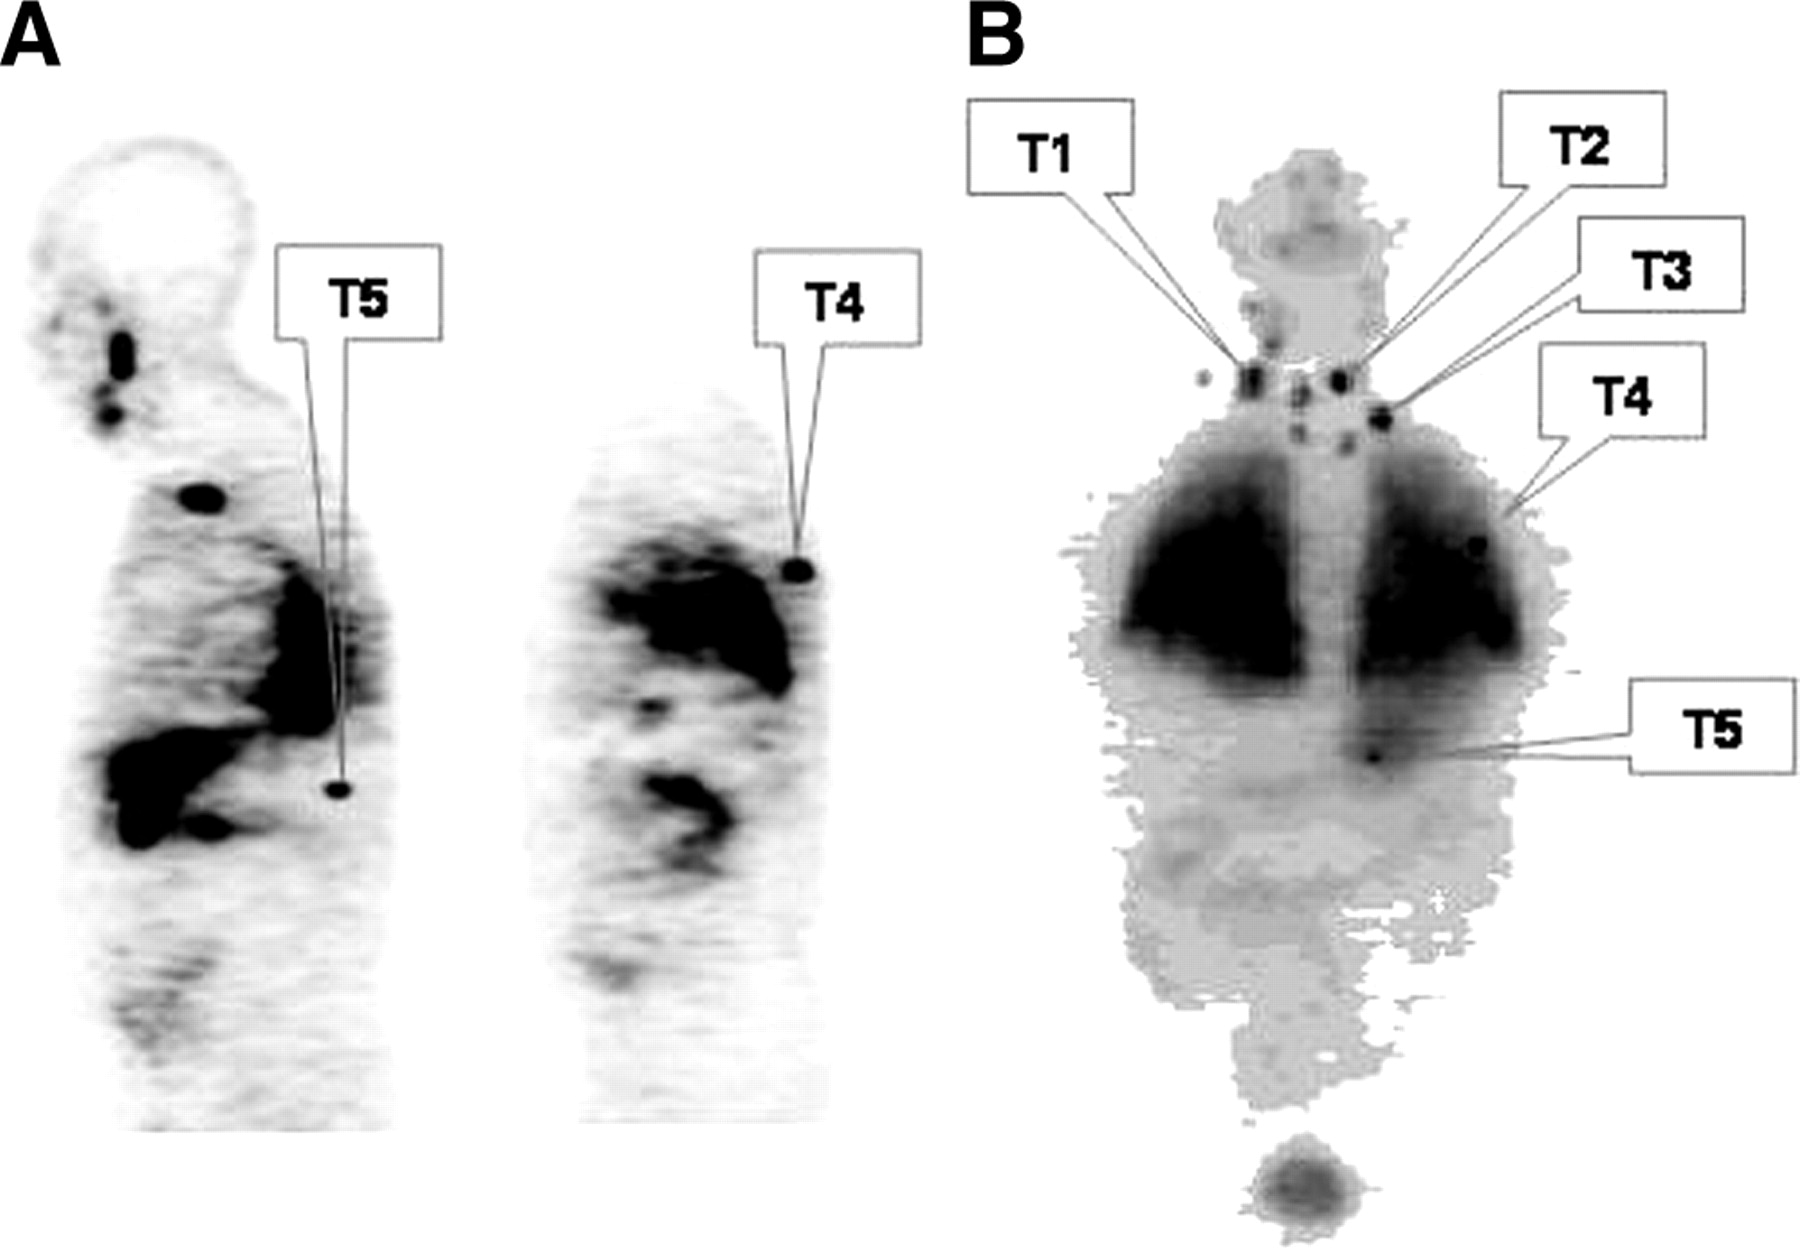
Selected sagittal 124I PET image slices (A) and sum of all coronal slices (B) are shown with each tumor identified for patient 16. Summed coronal image was obtained using MIAU software package.

DVHs for tumors identified in Figure 6.
Mean, Minimum, and Maximum Absorbed Dose in Individual Tumors of Patient 16
In radioimmunotherapy, several groups have reported an inverse relationship between tumor volume and absorbed dose (12,27–29). Figure 8 demonstrates that in radioiodine therapy of metastatic cancer and for the given sample of patients, such a relationship was not strictly observed. The absorbed dose to tumor nodules smaller than 10 cm3 ranged from 87 to 0.08 Gy/GBq (320–0.30 rad/mCi, respectively), with the majority receiving an absorbed dose below 20 Gy/GBq; all tumors with masses above 10 cm3 also received <20 Gy/GBq.
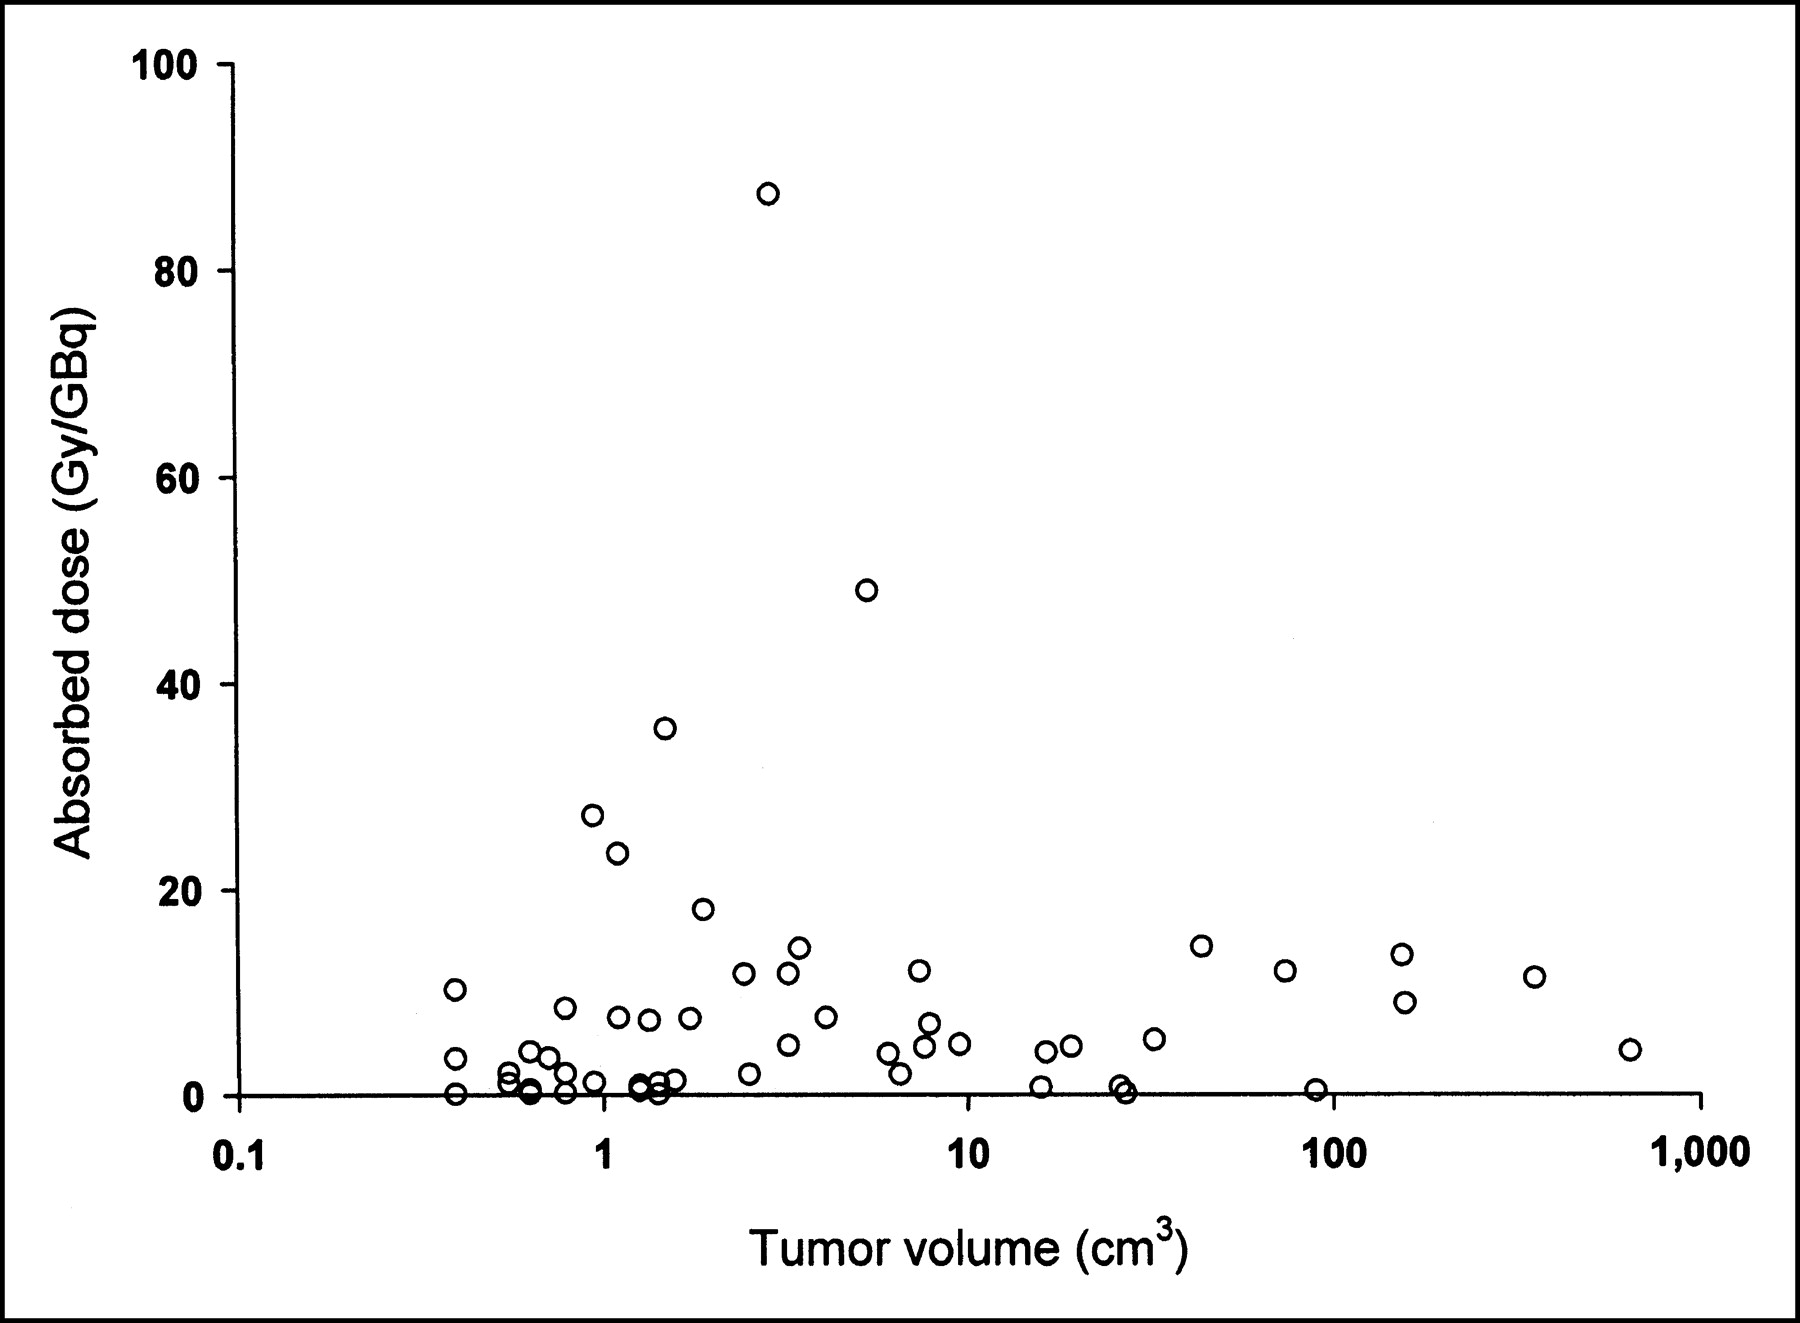
Absorbed dose per unit administered activity plotted against tumor volume. Note logarithmic plot was used for tumor volume axis because of wide range of tumor volumes.
DISCUSSION
We performed a dosimetric analysis of metastatic disease in thyroid cancer patients using 124I PET imaging and 3D-ID based tumor dosimetry. The results demonstrated feasibility in implementing a fully 3D PET-based approach to 3D absorbed dose estimation. This is in contrast to previously used methods in which SPECT was used to provide the spatial distribution of activity at a given time point and planar imaging was used to provide clearance kinetics.
As shown previously (12,13,15,30), 3D-ID provides images of the spatial distribution of absorbed dose. Isodose contours drawn over the images can be used to provide information regarding the absorbed dose distribution within the tumor volume. Importantly, because the dose calculation is voxel based, this information does not require tumor volume segmentation or estimation of tumor mass. Tumor volume segmentation is, however, required to obtain the mean, minimum, and maximum absorbed dose over the tumor volume as well as a DVH depicting the absorbed dose distribution in the tumor. The latter is particularly useful because it could be the starting point for radiobiologic interpretation and modeling of the dose distribution for response assessment (31,32).
Although in the patient population studied, there was a 4-fold difference in 131I activity administered for therapy, the large variation in absorbed dose parameters listed in Table 1 was not due to differences in patient-administered activity. The maximum mean absorbed dose was delivered to a 5.3-cm3 tumor in patient 7, who received 11 GBq, whereas the minimum absorbed dose was to a 0.4-cm3 tumor in patient 12, who was administered 15 GBq. The spatial variation in tumor absorbed dose likewise could not be explained by differences in administered activity. The minimum intratumoral dose of 0.3 Gy was delivered to a 0.8-cm3 tumor in patient 1, who also received 15 GBq of 131I, whereas the maximum intratumoral absorbed dose of 4,000 Gy was delivered to <1.5% of the same 5.3-cm3 tumor volume that received the maximum mean tumor absorbed dose (patient 7). Although the mean and maximum absorbed doses for this tumor were very high, it is important to note that therapeutic efficacy will depend on the minimum absorbed dose delivered to the tumor volume. In the case of the 5.3-cm3 tumor, the minimum absorbed dose was 23 Gy (Fig. 5), which is generally considered to be subtherapeutic for metastatic thyroid carcinoma (33,34).
The potential importance of using fully 3D datasets to derive voxel-based pharmacokinetic parameters for cumulated activity determination is illustrated in the analysis of patient 13 (Figs. 2–5; Table 3). As shown in Figure 3, a transverse slice through the lateral chest wall tumor on the patient’s right (T2) shows 3 foci of high activity concentration. Twenty hours after administration, the activity concentration in region 1 was 1.5 and 2.6 times higher than that in regions 2 and 3, respectively. The relative increase in activity concentration with time for regions 1 and 2, however, was twice that of region 3 and of the tumor volume as a whole (Fig. 4). Tumor cumulated activity estimates derived by combining planar imaging with a single 3D image set (e.g., SPECT), in which all voxels within a tumor are assigned the same kinetic parameters, would yield absorbed dose variations within tumors that are lower than the actual variations. In the case considered above, a calculation based on a 20-h activity distribution and an uptake rate associated with the overall tumor volume would have underestimated the mean absorbed dose to regions 1 and 2 by 56 and 0.9%, respectively, and overestimated the absorbed dose to region 2 by 0.8%. As shown in Table 3, these under- and overestimates change depending on the time point at which the spatial activity distribution is determined.
The size versus absorbed dose relationship obtained for thyroid cancer metastases does not follow the previously observed relationship for radiolabeled antibodies. This might be expected given the mass difference between a 150,000-Da radiolabeled antibody and 131I. Diffusion of the latter is not susceptible to the forces that a 150,000 molecular weight protein would be, but would be more susceptible to the biology of the lesion and its level of differentiation.
The mean absorbed doses reported in this work may be compared with other recently reported PET-derived values (35,36). In the study by Eschmann et al. (35), longitudinal 124I PET data and a combination of the Marinelli formula (37) and the nodule module available in MIRDOSE3.1 (38) were used to estimate the absorbed dose. Tumor volumes were derived from the PET images. The reported absorbed doses for metastases ranged from 70 to 156 Gy, with reported 131I-administered activities of 0.5–1.2 GBq compared with 4–16 GBq administered in the 15 patients analyzed in this study. Although the absolute absorbed dose values are generally consistent with the absorbed dose reported in this work, the dose per administered activity is lower than that reported for the 4 metastatic lesions in reference (35). PET-derived absorbed doses reported by Erdi et al. (36) were obtained by fast Hartley transform convolution of an 131I point kernel. The absorbed dose range of 0.4–24.4 Gy/GBq reported in the 3 patients studied is within the 0.08–49 Gy/GBq range reported in this study.
CONCLUSION
The 3D-ID software package was used with 124I PET imaging to perform fully 3D imaging-based retrospective dosimetry for 131I therapy of thyroid cancer. The work demonstrated the importance of 3D-derived estimates of the spatial distribution of cumulated activity and revealed substantial variability in intra- and intertumoral absorbed doses in individual patients.
Acknowledgments
This work was supported by National Institutes of Health grant R01 CA62444 and by Department of Energy grant DE FG02 86ER 60407.
Footnotes
Received Nov. 11, 2003; revision accepted Feb. 5, 2004.
For correspondence or reprints contact: George Sgouros, PhD, 720 Rutland Ave., 220 Ross Research Building, Department of Radiology, Johns Hopkins University Medical Institute, Baltimore, MD 21205.
E-mail: gsgouros{at}jhmi.edu
REFERENCES


Jump to section
Related Articles
Cited By...
- Dosimetry in Clinical Radiopharmaceutical Therapy of Cancer: Practicality Versus Perfection in Current Practice
- Appropriate Use Criteria for Nuclear Medicine in the Evaluation and Treatment of Differentiated Thyroid Cancer
- Advancing Targeted Radionuclide Therapy Through the National Cancer Institutes Small Business Innovation Research Pathway
- Whole-Body Voxel-Based Personalized Dosimetry: The Multiple Voxel S-Value Approach for Heterogeneous Media with Nonuniform Activity Distributions
- Treatment of refractory thyroid cancer
- Individualized Dosimetry for Theranostics: Necessary, Nice to Have, or Counterproductive?
- Comparison of Empiric Versus Whole-Body/-Blood Clearance Dosimetry-Based Approach to Radioactive Iodine Treatment in Patients with Metastases from Differentiated Thyroid Cancer
- ENDOCRINE TUMOURS: Imaging in the follow-up of differentiated thyroid cancer: current evidence and future perspectives for a risk-adapted approach
- Dose-Response Relationship in Differentiated Thyroid Cancer Patients Undergoing Radioiodine Treatment Assessed by Means of 124I PET/CT
- Redifferentiation of Iodine-Refractory BRAF V600E-Mutant Metastatic Papillary Thyroid Cancer with Dabrafenib
- MIRD Pamphlet No. 25: MIRDcell V2.0 Software Tool for Dosimetric Analysis of Biologic Response of Multicellular Populations
- Radioiodine Therapy for Thyroid Cancer in the Era of Risk Stratification and Alternative Targeted Therapies
- Frequency and characterization of gastro-entero-pancreatic neuroendocrine tumor patients with high-grade of uptake at somatostatin receptor scintigraphy
- MIRD Pamphlet No. 23: Quantitative SPECT for Patient-Specific 3-Dimensional Dosimetry in Internal Radionuclide Therapy
- Dosimetry and thyroid cancer: the individual dosage of radioiodine
- Blood dosimetry from a single measurement of the whole body radioiodine retention in patients with differentiated thyroid carcinoma
- Molecular Imaging In Tumor Treatment Response
- Imaging Surrogates of Tumor Response to Therapy: Anatomic and Functional Biomarkers
- 131I Effective Half-Life and Dosimetry in Thyroid Cancer Patients
- Optimized 124I PET Dosimetry Protocol for Radioiodine Therapy of Differentiated Thyroid Cancer
- Bone metastases from differentiated thyroid carcinoma
- Three-Dimensional Radiobiologic Dosimetry: Application of Radiobiologic Modeling to Patient-Specific 3-Dimensional Imaging-Based Internal Dosimetry
- Prediction of Absorbed Dose to Normal Organs in Thyroid Cancer Patients Treated with 131I by Use of 124I PET and 3-Dimensional Internal Dosimetry Software
- Spatial Dose Mapping for Individualizing Radioiodine Treatment
- Lung Dosimetry for Radioiodine Treatment Planning in the Case of Diffuse Lung Metastases
- Empiric Radioactive Iodine Dosing Regimens Frequently Exceed Maximum Tolerated Activity Levels in Elderly Patients with Thyroid Cancer
- Acquisition Settings for PET of 124I Administered Simultaneously with Therapeutic Amounts of 131I
- Juvenile differentiated thyroid carcinoma and the role of radioiodine in its treatment: a qualitative review
- Accurate Dosimetry in 131I Radionuclide Therapy Using Patient-Specific, 3-Dimensional Methods for SPECT Reconstruction and Absorbed Dose Calculation
- rhTSH-aided radioiodine ablation and treatment of differentiated thyroid carcinoma: a comprehensive review
- Dosimetry of Internal Emitters
- The Evolving Role of 131I for the Treatment of Differentiated Thyroid Carcinoma