


Abstract
The aim of this study was to assess synovitis by 18F-FDG PET in an individual joint analysis and in a global analysis of rheumatoid arthritis (RA) disease activity and to compare 18F-FDG PET parameters with clinical, biologic, and sonographic (US) rheumatoid parameters. Methods: Three hundred fifty-six joints were assessed in 21 patients with active RA: the knees in all subjects and either wrists as well as metacarpophalangeal and proximal interphalangeal joints in 13 patients, or ankles and the first metatarsophalangeal joints in the remaining 8 patients. PET analysis consisted of a visual identification of 18F-FDG uptake in the synovium and measurements of standardized uptake values (SUVs). Independent assessors performed the clinical and US examinations. Results: PET positivity was found in 63% of joints, whereas 75%, 79%, and 56% were positive for swelling, tenderness, and US analysis, respectively. Both the rate of PET-positive joints and the SUV increased with the number of positive parameters present (swelling, tenderness, US positivity) and with the synovial thickness. The mean SUV was significantly higher in joints where a power Doppler signal was found. In a global PET analysis, the number of PET-positive joints and the cumulative SUV were significantly correlated with the swollen and tender joint counts, the patient and physician global assessments, the erythrocyte sedimentation rate and C-reactive protein serum levels, the disease activity score and the simplified disease activity index, the number of US-positive joints, and the cumulative synovial thickness. Conclusion: 18F-FDG PET is a unique imaging technique that can assess the metabolic activity of synovitis and measure the disease activity in RA.
Rheumatoid arthritis (RA) synovitis is characterized by a massive leukocytic infiltrate, a proliferative synovial membrane, and a neovascularization that give rise to synovial hypertrophy. This pannus is directly responsible for cartilage and bone degradation and, thus, joint space narrowing and marginal erosions. An early identification of the pathologic synovitis is of major importance because it represents the primary location of the rheumatoid joint inflammatory process and is a therapeutic target (1,2). Clinical evaluation and conventional radiography of diseased joints are unfortunately unable to precisely and directly evaluate synovial inflammation. For this purpose, new imaging techniques are now available. High-resolution ultrasonography (US) (3–8) and fat-suppressed gadolinium-enhanced MRI (3,6,9–12) have provided a new approach for depicting synovitis: they visualize the pannus developing in the inflamed joint, allow the measurement of its thickness or its volume, provide information about its vascularization, and detect early bone erosions. Although their contribution to the identification of the pannus is of great value, they remain morphologic techniques that give no direct information on the metabolic activity of the synovitis. Indeed, gray-scale US cannot differentiate active from chronic or fibrous synovitis and, in gadolinium-enhanced MRI, the enhanced uptake of contrast agent by the inflamed synovium is also due to hypervascularization and capillary permeability (9,13–15).
As metabolic changes support and are likely to precede morphologic changes, molecular imaging techniques that record tissue biochemical characteristics in vivo might be of major interest in joint activity assessment. Over the last decade, 18F-FDG PET has become the spearhead of molecular imaging, mainly in oncology for tumor staging and monitoring of treatment. However, animal experiments have shown that up to 29% of 18F-FDG is not taken up by tumor cells themselves but by macrophages and surrounding granulation tissue (16,17). Such findings and the fact that tumor necrosis factor-α (TNF-α) enhances glucose entry into macrophages in experimental models of inflammation (18,19) and regulates glucose transport and metabolism in fibroblasts (20) are arguments for the use of 18F-FDG PET for detection and monitoring of inflammatory disease (21). In view of the central role of TNF-α in the chronic synovial inflammation observed in RA (2), PET is likely to be an ideal technique for a metabolic assessment of RA synovitis. However, few data have been published. An increased uptake of 18F-FDG in inflamed joints has incidentally been noted in 2 patients screened for cancer who were also suffering from RA (22,23). In studies dealing with RA wrists and knees, the anatomic distribution of the high-uptake areas corresponded well with that which would be expected from inflamed and proliferative synovium (10,22,24).
The aim of our study was to use 18F-FDG PET for monitoring RA disease activity by simultaneous assessment of multiple joints. We prospectively studied 21 RA patients presenting with active disease. In each patient, we evaluated the knees and either wrists and the metacarpophalangeal (MCP) and proximal interphalangeal (PIP) joints or ankles and the first metatarsophalangeal (MTP-1) joints. A metabolically active synovitis was searched and quantified in each joint, and PET-derived parameters were compared with the classical measures of disease activity: clinical joint counts, biologic markers of inflammation, functional parameters, US-derived parameters using conventional and power Doppler US, and the composite indices: disease activity score that include 28-joint counts (DAS28) (25) and the simplified disease activity index (SDAI) (26).
MATERIALS AND METHODS
Selection of Patients and Control Subjects
The study, which was approved by the ethical committee of our academic hospital, included 21 patients (17 women, 4 men) with active RA fulfilling the American College of Rheumatology 1987 revised criteria (27). Informed consent was obtained from all patients before participation in the study. The mean age was 48 y (range, 34–69 y) and the mean disease duration was 11 y (range, 1–24 y). Patients had been previously treated by 3.4 (range, 1–8) disease-modifying antirheumatic drugs (DMARDs). Seventeen received low-dose oral corticosteroids (mean, 7; range, 4–10) mg/d prednisolone) and all received nonsteroidal antiinflammatory drugs (NSAIDs). None had a DMARD for 2 mo before the study entry, a period during which all drug regimens were stable. Inclusion criteria for study selection were (a) at least 10 swollen joints; (b) at least 12 tender joints; (c) failure of at least 1 DMARD; and (d) 1 of the 2 following criteria: erythrocyte sedimentation rate (ESR) > 28 mm/h or C-reactive protein (CRP) levels > 20 mg/L.
Three healthy subjects without any history of joint disorder as well as 10 patients with melanoma of the distal inferior limbs referred for staging were also studied.
Study Design
18F-FDG PET was performed the day after the clinical, biologic, and sonographic (US) assessments. In all patients, the knees were scanned. The cohort was split in 2 according to the presence or absence of clinical symptoms dominating on hands as judged by the patients: therefore, 13 patients had an acquisition on the wrists and MCP and PIP joints, whereas the remaining 8 patients had an acquisition on the ankles and MTP-1 joints. An experienced joint assessor (study nurse) was responsible for conducting the clinical evaluation and 2 physicians experienced in musculoskeletal US—one radiologist and one rheumatologist—who were unaware of the clinical status, were responsible for conducting the sonographic study. PET evaluation was performed by an independent experienced PET assessor, who was unaware of both the clinical and the sonographic status of the patients. PET assessments of the knees, wrists, ankles, and MCP, PIP, and MTP-1 joints were also performed on the healthy subjects as well as on the knees of the patients with melanoma.
Clinical and Biologic Evaluations
The joints were classified as positive or negative for tenderness and swelling. Functional parameters included the Health Assessment Questionnaire (HAQ) (28), the morning stiffness, and visual analog scale ranging from 1 to 100 mm for patient global assessment (PGA) and physician global assessment (PhyGA) of disease activity. Disease activity was studied through the determination of the DAS28 (25) and the SDAI (29). A high disease activity was defined as a DAS28 > 5.1 (29) and an SDAI > 40 (26). Standard laboratory tests included ESR determined by the Westergren method and CRP levels measured by nephelometry. IgM rheumatoid factor was measured by enzyme-linked immunosorbent assay (ELISA). Biologic, clinical, and functional parameters were determined on the same morning and the number of tender and swollen joints was assessed by the same independent joint assessor (experienced study nurse).
18F-FDG PET
PET Protocol.
PET was performed using the UGM Penn PET 240 H scanner (ADAC-UGM). This device consists of large NaI (Tl) detectors in a hexagonal arrangement. The effective field of view is 512 mm in the x-and y-directions and 128 mm in the z-direction. The scanner operates 3-dimensionally (3D), without septa. Its resolution is 5.5-mm full width at half maximum in the 3 planes near the center of the field of view (30). The patients fasted for at least 6 h before injection and were at rest for 15 min to reduce muscular uptake. Before injecting the tracer, the blood glucose level was measured in all patients and did not exceed 140 mg/dL. 18F-FDG (4 MBq/kg) was injected in a peripheral vein through an indwelling catheter. On the basis of previous time course studies (10), imaging was initiated at least 45 min after injection of the radiolabel, with a mean time of 73 min (range, 51–100 min). Patients were lying in a supine position and knees were positioned in the axial plane of the tomographic gantry, centered in the field of view. The feet were strapped against a board fixed at the end of the table with a right angle to put the patella at the zenith, and the knees were secured with tape to prevent motion. The scan was obtained beginning 10 cm higher than the superior aspect of the patella to include the subquadricipital pouch and covered largely the knees. For foot and ankle imaging, the same position of the inferior limbs was kept. For wrist and hand imaging, the patients sat on a height-adaptable stool behind the gantry and their hands were positioned in the field of view with their palmar side on a rigid cardboard support placed upon the curved table. Emission scans were acquired using multiple overlapping axial positions of 6-min duration each for the knees, ankles, and feet and of 4 min for the hands and wrists. After acquiring the emission scan, a postinjection transmission scan (70 s) was acquired over the same axial field using a 137Cs point source (31). Both transmission and emission images were reconstructed using the ordered subset-expectation maximization algorithm (32).
Visual Analysis.
PET data were analyzed by visual interpretation of coronal, sagittal, and transverse slices, with cross-referenced situation and rotating 3D images when necessary. Joints were considered as positive for synovitis when an increased 18F-FDG uptake was present in areas presumed to correspond to joint synovium.
Semiquantitative Analysis.
18F-FDG uptake was quantified using the standardized uptake value (SUV) normalized for the lean body mass (SUVlbm). The SUV is defined as a tissue concentration divided by the activity injected per body weight. This simple semiquantitative index of tissue accumulation of the 18F-FDG index shows a strong positive correlation with patient body weight[b]. Therefore, the SUVlbm appeared more appropriate (for men, lbm = 1.1 × weight − 120 × [weight/height]2; for women, lbm = 1.07 × weight − 148 × (weight/height)2]) (33). In PET-positive joints, the SUVlbm was obtained by drawing a circular region of interest (ROI) over the most active synovial area identified on the axial slices.
When no synovitis was identified on PET studies, ROIs were placed arbitrarily on an axial image in an area of soft tissues devoid of muscles presumed to correspond to synovium: at the dorsal surface of the radius (on top of the lunate) for the wrists, over the lateral recess at the level of the midpatella for the knees, and on top of the talar neck for the ankles. For the small joints (MCP, PIP, MTP-1 joints), ROIs were drawn around the appropriate joint. To increase the reproducibility of the measurement, the maximum pixel value in each ROI was recorded, thus determining a maximum SUV.
Reliability for the identification of synovitis by 18F-FDG PET and for calculation of SUV was determined. Intraobserver (1 nuclear medicine physician) and interobserver (2 nuclear medicine physicians) reliabilities were calculated using recorded data of the first 5 scans of studied joints. The interpretation under blind conditions was repeated 2 mo later (intraobserver) or independently and sequentially on 2 desktops (interobserver). SUV values were then determined by the same nuclear medicine physician during the entire study.
US Examination
US was performed using a B-mode 13.0-MHz transducer and power Doppler 5-MHz transducer (Aloka Prosound 5500). Power Doppler settings were standardized with a pulse repetition frequency of 651 Hz (8). US positioning for the wrists and the MCP and PIP joints has been described elsewhere (8). Knee scanning was performed with the patient in a supine position, the knee extended; 3 recesses were evaluated in a transverse plane: the suprapatellar recess, just above the upper border of the patella; and the medial and lateral patellar recesses at the middle third of the patella. Ankle scanning was performed in the sagittal plane measuring the hypoechoic layer on top of the talar neck. MTP-1 scanning was done as described for MCP scanning (8). Synovial measurements were performed systematically perpendicular to the great axis and at the point of greatest thickness. Since synovitis is an inflammatory joint process comprising cellular and fluid components that cannot always be distinguished by US because the synovial tissue and the joint effusion can both be hypoechoic or anechoic (34,35), synovitis was identified as a hypoechoic or anechoic area in the joint space of the wrist, MCP, PIP, ankle, and MTP joint (3,8,34). For the knees, the hypoechoic-to-anechoic layer composed of effusion and synovial tissue was delineated by the hyperechoic cortex (femur, lateral and medial epicondyle) and the hyperechoic tendons (quadriceps, vastus medialis, and lateralis). Firm pressure with the transducer expelled the effusion and allowed the measurement of the combined anterior and posterior wall thickness (36). A cutoff for US positivity was defined as a synovitis of at least 1-mm thick according to US determinations in healthy control subjects, as described previously (8). In wrists and knees, where 2 and 3 scans were obtained, respectively, the joint was considered positive if at least 1 measurement was positive. To determine the cumulative synovial thickness (CST)—that is, the sum of thicknesses of all US-positive joints—values for wrists and knees included the results of the 2 and 3 scans obtained, respectively.
Power Doppler measurements were performed simultaneously without exerting any pressure and, when positive, the signal was scored according to a semiquantitative scale defined as follows: 0, no signal; 1, intermittent; 2, persistent single spotting within the same location; or 3, multiple persistent spotting within the same location. Joints assessed at multiple sites (wrists and knees) were considered positive for a Doppler signal if at least one signal was identified. The power Doppler score was the sum of all scores attributed to all detected signals, including eventual multiple positivity for wrists and knees.
Statistical Analysis
Intraobserver and interobserver agreements for PET identification of synovitis were calculated using the Cohen κ-test (37) and those for the SUVs were calculated according to Snedecor (38). Except when stated otherwise, values are expressed as mean (range) or as mean ± SD. Since values followed a gaussian distribution, the unpaired Student t test was used for comparing SUV and synovial thickness of the synovitis of different groups of joints according to the presence or absence of qualitative variables (swelling, tenderness, and PET, US, and Doppler positivity). Qualitative data were compared using the χ2 test, with the Yates’ correction when necessary. Correlations were sought by linear regression. P values ≤ 0.05 were considered significant. The odd ratios (with 95% confidence intervals [95% CIs]) were calculated to determine the association between PET positivity and clinical or US positivity.
RESULTS
Clinical and Biologic Evaluations
Of 36 joints (knees, ankles, wrists, and MCP, PIP, and MTP joints), the mean number of tender and swollen joints per patient was 24 (range, 13–36) and 22 (range, 10–31), respectively. The mean HAQ score was 2 (range, 1.25–2.75) and the mean morning stiffness was 174 min (range, 15–300 min). The mean PGA and PhyGA were 83 (range, 58–100) and 83 (range, 49–96), respectively. The mean DAS28 was 7.4 (range, 5.2–8.5), with all patients exhibiting a high disease activity. The mean SDAI was 60.2 (range, 34.9–75.5), with 19 patients (90%) exhibiting a severe disease activity. The mean ESR and CRP levels were 44 mm/h (range, 12–116 mm/h) and 46 mg/L (range, 4–107 mg/L), respectively. Eighteen patients were positive (>30 units) for IgM rheumatoid factor (ELISA), with a mean value of 373 (range, 35–823).
Site-by-Site Analysis: PET Detection of Synovitis Versus US and Clinical Joint Assessments
No synovitis was identified in the joints of the non-RA subjects (Figs. 1A and 1B). In the RA patients, 356 of the 360 joints studied (99%) were evaluable: 42 knees, 25 wrists, 129 MCP joints, 128 PIP joints, 16 ankles, and 16 MTP joints. The remaining joints (1 wrist, 1 MCP joint, and 2 PIP joints) were excluded due to complete joint destruction, preventing valid comparisons. Joints were assessed positive by PET if a pattern of synovitis was evident, as illustrated in Figures 1C and 1D. The number of PET-positive joints was 225 of 356 (63%), ranging from 56% in MTP-1 joints to 88% in wrists (Fig. 2). Intraobserver and interobserver variabilities for PET identification of synovitis were calculated in RA and κ-values were 0.90 and 0.82, respectively. The number of PET-positive joints (225 [63%]) was significantly lower than the number of joints considered as swollen (266 [75%]) or tender (282 [79%]) but significantly higher than the number of US-positive joints (199/356 [56%]) (Fig. 2). PET positivity of all joints studied together was significantly associated with the 3 other parameters simultaneously determined: swelling, tenderness, and US positivity (Table 1). Most of the PET-positive joints were also positive by clinical evaluation (swollen and tender) and by US.

18F-FDG PET images of healthy control subject (A and B) and RA patient with active disease (C and D). (A) 3D projection image of normal tracer distribution in knee. (B) Normal distribution in hand and wrist. (C) Rheumatoid knee. (D) Rheumatoid hand and wrist.
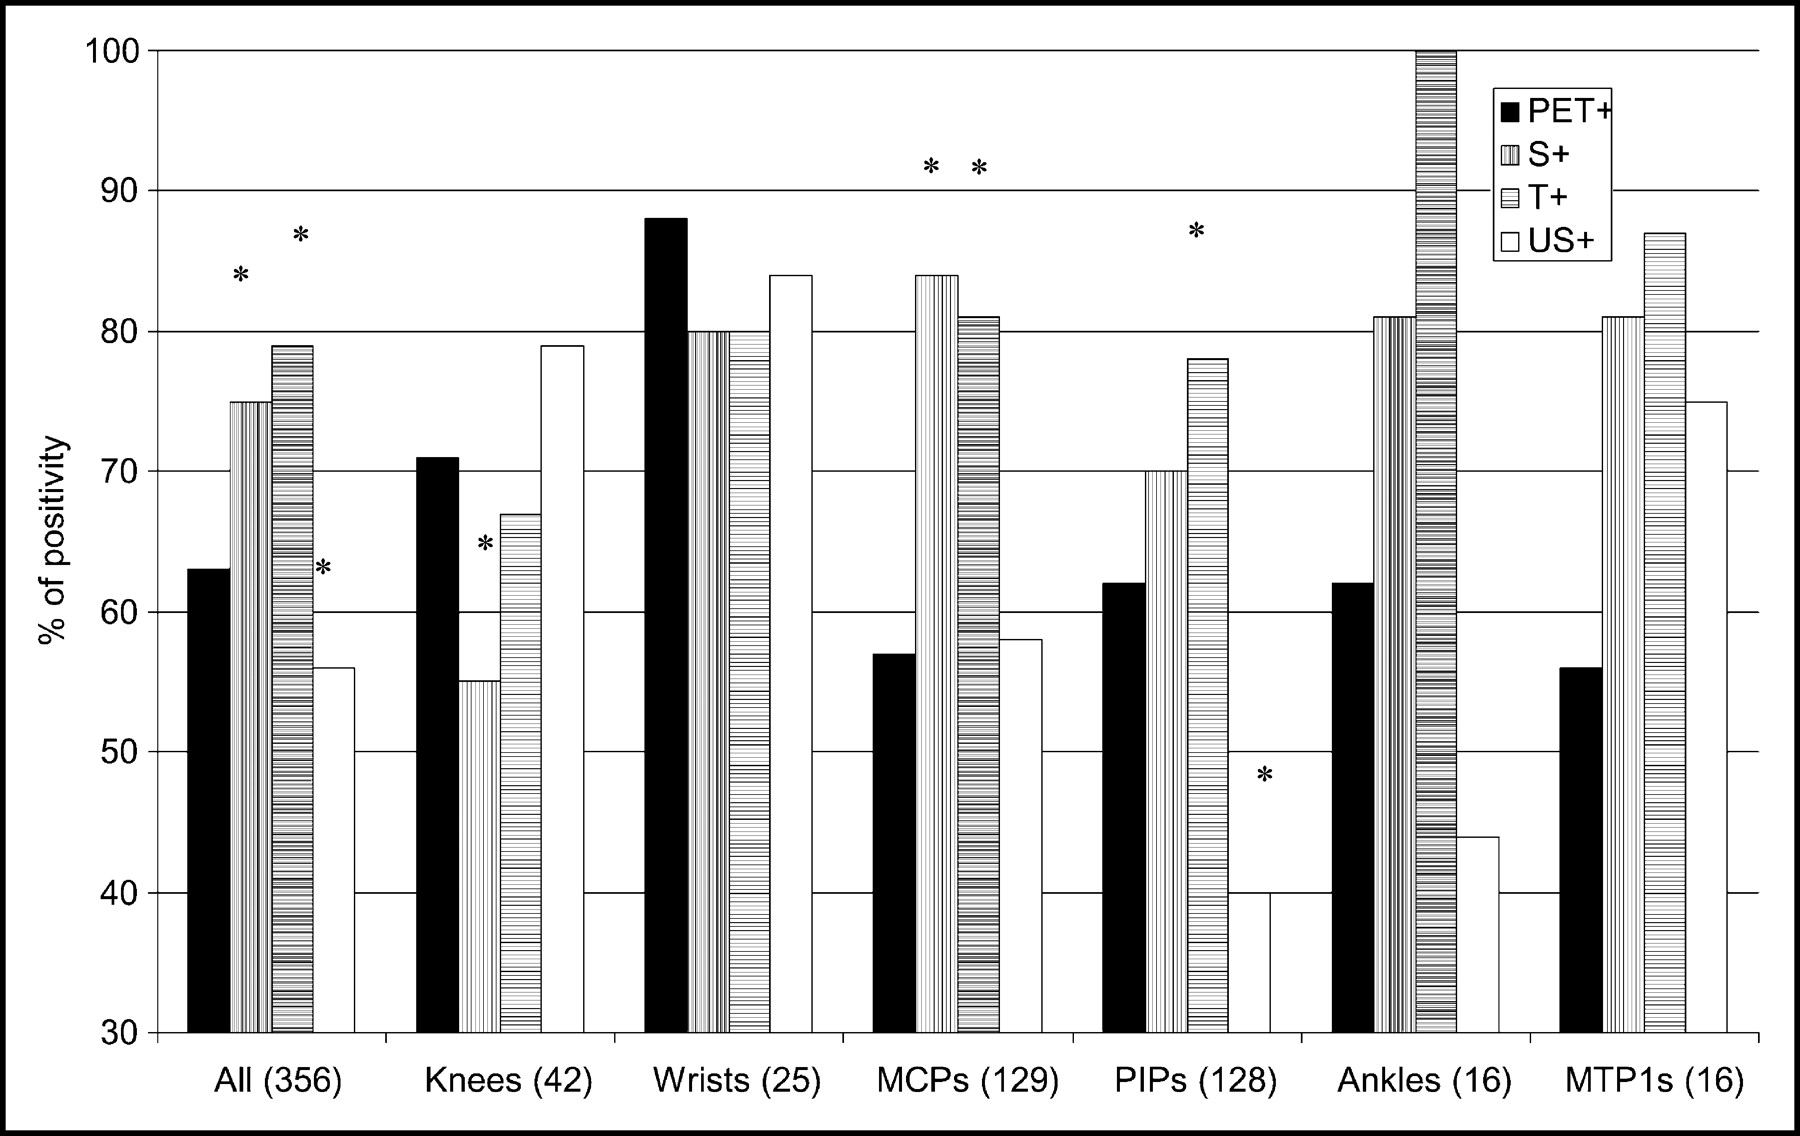
Percentage of PET positivity of different joints studied. *P < 0.05 compared with PET positivity (χ2 test). In ankles and MTP-1 joints, cohorts were too small to allow valid statistical analysis. S+ = swollen joints; T+ = tender joints; US+ = joints with synovial thickness ≥ 1 mm.
Comparison of PET Positivity According to Visual Analysis and Clinical or US Positivity
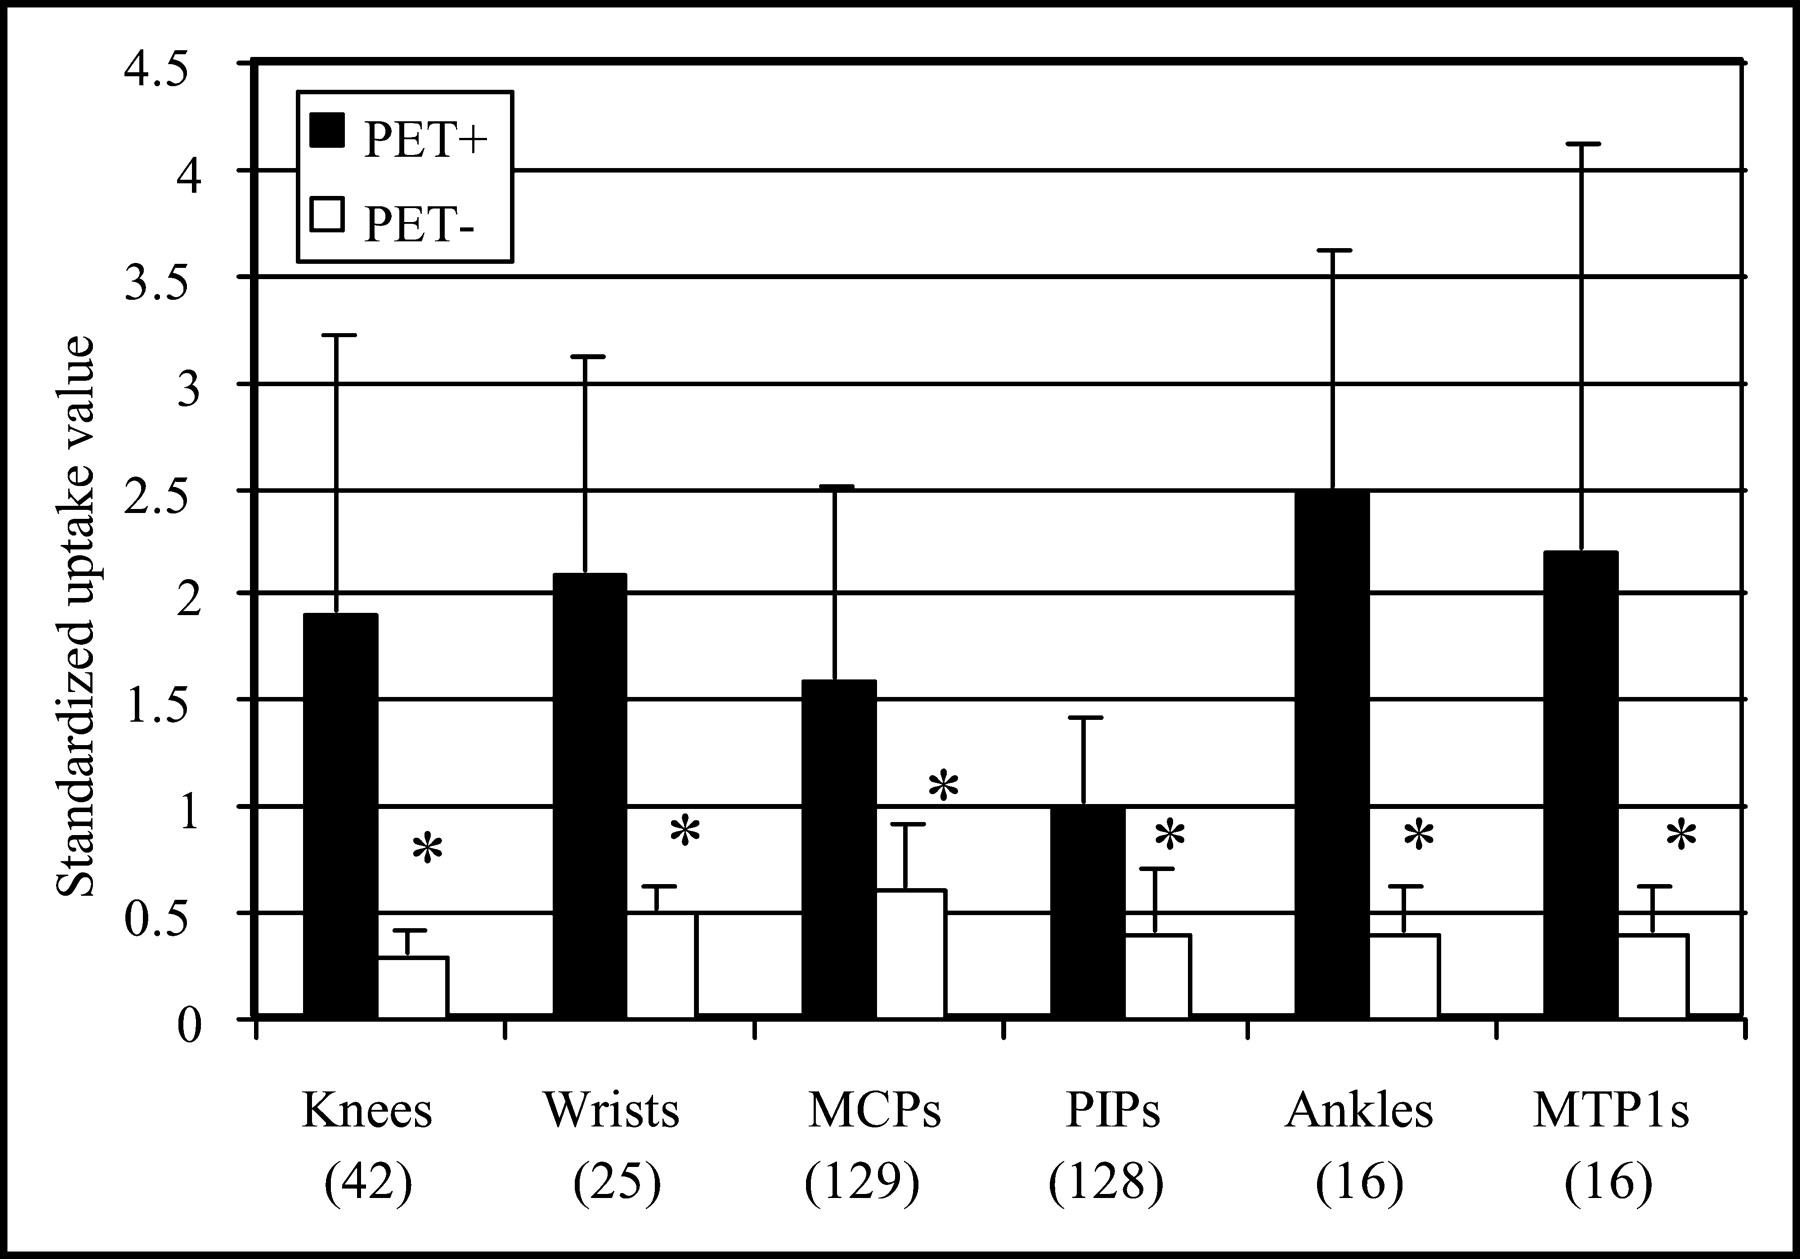
PET-positive joints had a significantly higher SUV than PET-negative joints in all localizations studied (Fig. 3). The SUVs in PET-negative joints were similar to those obtained in the control subjects. All joints considered, the intraobserver coefficient of variation (CV) was 3.9%, whereas the interobserver CV was of 14.9%. Clearly, the latter varied according to the type of joint (large or small), ranging from 0% in knees to 4.1% in ankles, 8.3% in MTP-1 joints, 10.1% in PIP joints, 14.2% in wrists, and 22.8% in MCP joints.

SUVs (mean ± SD) in joints in which synovitis is observed (PET+) or not observed (PET−) by 18F-FDG PET analysis. *P < 0.05 compared with PET-positive joints.
The percentage of PET positivity increased with the number of clinical or US parameters simultaneously present (Fig. 4A): 9% (4/43) when the joints were not swollen, tender, and US negative; 41% (17/41) when at least 1 of the 3 parameters was present; 53% (58/110) when 2 of the 3 parameters were present; and 90% (146/162) when the joints were swollen, tender, and US positive. This distribution of PET positivity according to clinical and US parameters was also found for each type of joint studied separately (data not shown). The SUVs of PET-positive joints also significantly increased according to the number of clinical and US parameters present, whereas the SUVs of PET-negative joints did not differ in the absence or presence of clinical and US positivity (Fig. 4B). Only 10% of US-negative joints that were neither swollen nor tender were considered as PET positive, and their SUVs were low and not significantly different from the SUVs of the PET-negative joints. Conversely, only 11% of joints that were swollen, tender, and US positive were PET negative, and their SUVs were also low, similar to the values observed in the joints clinically and US negative.

PET positivity (A) and SUVs (mean ± SD) (B) in different types of joints studied as joints were not swollen, not tender, and also US negative (0; n = 43) or were positive for 1 (n = 41), 2 (n = 110), or 3 (n = 162) parameters studied. *P < 0.05 compared with PET-positive joints.
Site-by-Site Analysis: PET Detection of Synovitis and Synovial Thickness
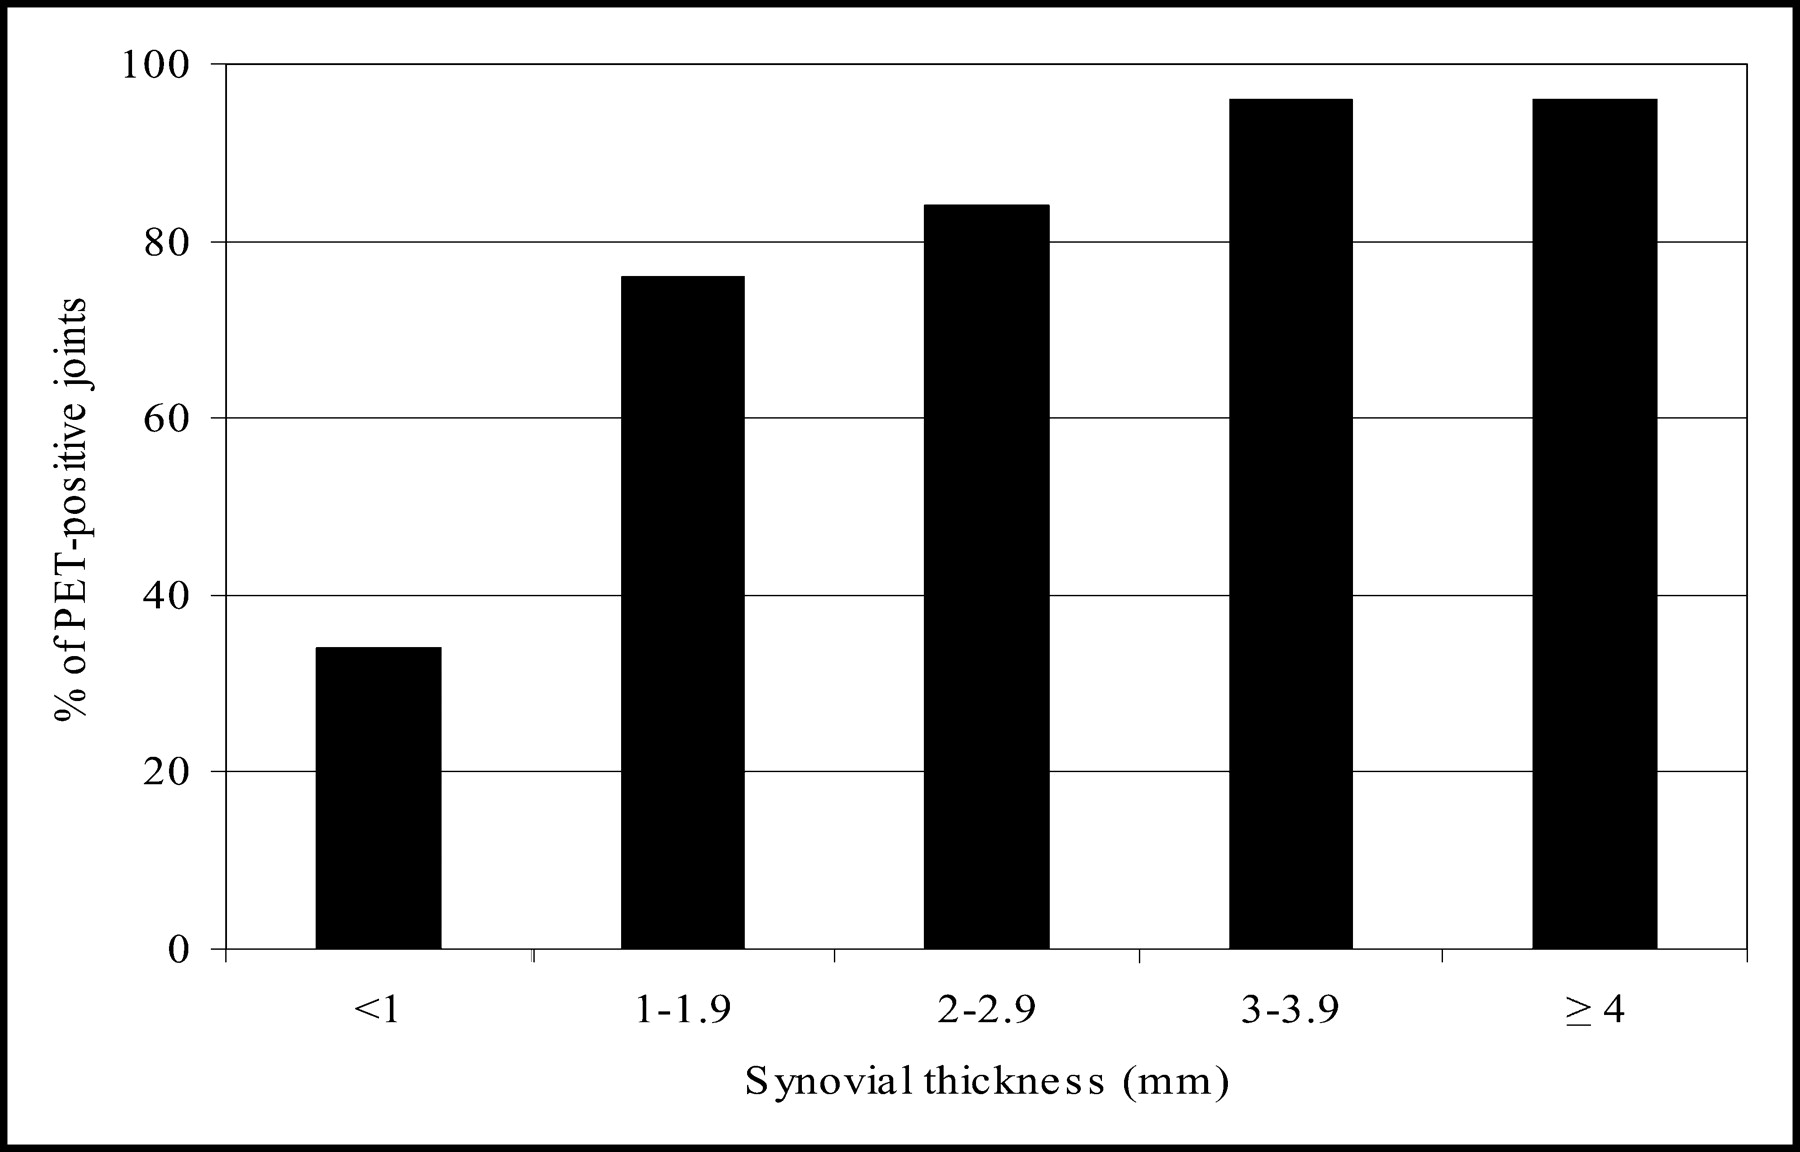
We compared PET positivity and SUV according to the synovial thickness determined by US. In large joints as knees, the synovitis could be separated from the effusion by US analysis. Of the 42 knees, 33 had a detectable synovitis, 8 had only an effusion, and 1 was normal. PET positivity was 82% (27/33) in the knees with a synovitis and 37% (3/8) in the knees with an effusion only. The mean SUV of the 27 US-positive/PET-positive knees was significantly higher (2.0 ± 0.2) than the mean SUV of the 6 US-positive/PET-negative knees (0.3 ± 0.04) or the mean SUV of the 8 knees with an effusion only (0.5 ± 0.1). Interestingly, the mean synovial thickness of the 27 US-positive/PET-positive knees (8.2 ± 0.9 mm) was significantly higher than that of the 6 US-positive/PET-negative knees (2.9 ± 0.5 mm). We further studied PET positivity according to synovial thickness—all joints considered together—and found that PET positivity increased in parallel with the thickness of the synovitis, a plateau being reached for 3-mm-thick synovitis (Fig. 5). Furthermore, SUVs were significantly correlated with the synovial thickness in all joints studied except for MTP-1 joints (Table 2). Combined thickness resulting from multiple scans (2 sites for wrists and 3 sites for knees) was more closely correlated with SUVs than thickness evaluated at a single site (Table 2).

Percentage of PET-positive joints according to synovial thickness measured by US.
Linear Correlations Between SUV and Synovial Thickness on US
Site-by-Site Analysis: PET Detection of Synovitis and Power Doppler Positivity
A positive power Doppler signal was identified in 23% (45/199) of the US-positive joints. PET was more frequently positive in the US-positive joints with a Doppler signal (44/45 [96%]) than in US-positive joints without such a signal (128/154 [83%]) (P < 0.05). The mean SUV was also higher (2.4 ± 0.2 vs. 1.5 ± 0.1) (P < 0.05). No correlation was found between the grade of the signal and the SUV (data not shown).
PET, Clinical, Biologic, and US Parameters: Global Analysis
We defined 2 parameters describing a global PET approach of RA for each given patient: the number of PET-positive joints and the cumulative SUV (CSUV)—that is, the sum of SUVs in PET-positive joints. This analysis was undertaken in the 13 patients that underwent a PET 24-joint analysis (10 MCPs, 10 PIPs, 2 wrists, and 2 knees). The mean number of PET-positive joints was 15 (range, 0–24) and the mean CSUV24 was 26 (range, 6–62). The individual data are shown in Table 3. As shown in Table 4, the number of PET-positive joints and the CSUV were significantly correlated with all other parameters except the duration of the morning stiffness and the HAQ. The metabolic activity was also significantly correlated with the composite index of disease activity, the DAS classically calculated on 28 joints (the 24 mentioned plus elbows and shoulders) and the SDAI (Table 4). DAS and SDAI calculated on the 24 joints assessed by 18F-FDG PET were not significantly different from the classical DAS28 and SDAI28 and were similarly correlated with the PET-derived parameters (data not shown). Among demographic parameters, the disease duration was significantly correlated with the number of PET-positive joints (r = 0.62, P = 0.02) but not with log CSUV, although a trend was clearly present (r = 0.50, P = 0.08).
Individual Parameters of 13 Patients Who Had PET Studies of Knees, Wrists, and MCP and PIP Joints
Correlations Between PET Parameters and Other Parameters of Disease Activity in RA
DISCUSSION
18F-FDG PET is capable of directly identifying the synovitis and measuring its metabolic activity in inflamed RA joints. To our knowledge, this study is the first to examine multiple joints and to integrate PET parameters in a global joint analysis to characterize a “metabolic” rheumatoid disease activity in each patient. We have shown that the PET evaluation of synovitis in a joint-by-joint analysis correlates with local clinical and sonographic evidence of inflammation. We have also shown that PET evaluation of synovitis in an individual patient correlates with the classical clinical, functional, and biologic parameters evaluating RA disease activity, with the composite indices DAS and SDAI developed to adequately reflect the heterogeneous pattern of the disease (25,26) and used in clinical practice (29) as well as with a global approach of another direct imaging technique, US.
Although it was not the aim of this study, we found very good intra- and interobserver agreements for PET identification of synovitis as well as for SUV calculation, confirming the earlier study by Palmer et al. (10). The interobserver CV for SUVs, however, varied with the type of joint analyzed, being best for the knees and ankles and somewhat weaker for the wrists and MCP joints. Due to the lack of anatomic information on the PET images, the distinction between inflamed joint synovium and tenosynovitis or even muscle uptake may be difficult, especially in the wrists and MCP joints, explaining the weaker interobserver CV for these joints.
Whatever the theoretic limitations, odds ratios show that PET positivity in RA is clearly associated with the clinical (swelling and tenderness) and sonographic (a synovitis of at least 1-mm thick) assessments of joints that have been conducted separately by independent assessors unaware of the other results. Furthermore, this association was observed in the various types of joint studied. PET positivity (visual analysis) and the SUV increased with the number of clinical or US parameters simultaneously present, which clearly gives a clinical relevance to PET. Interestingly, although a correlation exists between SUVs and the thickness of the synovitis measured by US in all types of joints (except MTP-1 joints), the relationship is stronger with larger joints, such as knees and ankles, than with smaller ones, such as MCP and PIP joints. Such a correlation strongly suggests that 18F-FDG is taken up by the synovial tissue and that the SUV measurements correspond to the metabolic activity of the diseased joints. These results are therefore in agreement with those of Palmer et al. (10), who found a correlation between the SUV and the volume-enhancing pannus (VEP) measured by MRI in 9 RA wrists. The correlations we found between PET parameters and US or clinical parameters, either in the joint-by-joint analysis or in the global evaluation, also indicate that our methodology—that is, drawing a circular ROI over the most active synovial area identified on the axial slices and calculation of the SUVlbm—allows a clinically relevant application of PET analysis to diseased joints in RA. The specificity of the data obtained is also highlighted by the fact that no PET positivity was observed among the different joints studied in the healthy subjects nor in the knees of the “control” patients with melanoma.
We have also shown that SUVs were significantly higher in joints where a power Doppler signal was identified—that is, joints with neovascularization, a characteristic of aggressive RA synovitis. Since Doppler-positive joints also display an increased synovial thickness (8), the respective contribution of the cellular and the vascular components of the pannus in the high 18F-FDG uptake observed remains unknown.
In the global assessment, strong correlations were found between PET results (number of PET-positive joints and CSUV) and the disease duration as well as with the various parameters developed to adequately reflect the heterogeneous pattern of a clinically active disease: joint counts for swelling and tenderness, functional parameters (PGA and PhyGA of disease activity), biologic parameters of inflammation (ESR and CRP serum levels), and the composite indices DAS28 and SDAI. The pathophysiologic relevance of PET positivity and of elevated CSUVs is further highlighted by their correlations with US parameters such as the number of US-positive joints, the cumulative synovial thickness, the number of joints with a power Doppler signal, and the cumulative Doppler score.
Our results indicate that PET-derived parameters such as the number of PET-positive joints and the CSUV can be used at the patient level as “metabolic” indicators of disease activity. This approach highly correlates with the classical measurements of disease activity. The current assessments of RA disease activity through physical examination and functional scales remain essential in the routine clinical practice but they are subjective and tedious (10). New imaging modalities of synovitis such as MRI, US, and 18F-FDG PET are more quantitative techniques and, therefore, are likely to be more discriminating than the classical clinical evaluation (10). These 3 imaging techniques each have advantages and limitations. MRI, whose role in disease activity measurement has been very recently outlined (39), cannot be used in a simultaneous analysis of multiple distant joint and misfits with metallic implants, in contrast to PET and US. Compared with 18F-FDG PET, US is cheaper and widely available but is more observer dependent. 18F-FDG PET offers the advantage of orthogonal and 3D views, joint storage, and calculation of 18F-FDG uptake can be reinitiated anytime later according to the question addressed (e.g., assessment on the entire joint without consideration of regional differences in metabolic activity or only in the most metabolically active portions) (10). Although 18F-FDG PET use remains investigational and of limited access, we have shown in this work that PET assessment of synovitis is a new quantitative and reliable imaging technique that has a strong clinical relevance. It could also have a major importance in therapeutic follow-up as the SUV of 18F-FDG changes measured by PET and VEP changes measured by MRI were also correlated and associated with clinical changes after oral corticosteroid or NSAIDs and methotrexate (10) and as the uptake of d-11C-deprenyl was reduced in 2 RA knees that received an intraarticular administration of corticosteroid (40).
Limitations of PET technology in such an application to joints include a partial-volume effect, directly related to the spatial resolution of the device, leading to an underestimation of the metabolic activity in small structures. With the advance of modern PET scanners, spatial resolution and counting statistics are significantly improved compared with the performances of the device used for this study. Furthermore, PET/CT will allow acquisition of the anatomic and metabolic data in the same session, thus facilitating the identification of foci of increased activity and the positioning of the ROIs. Further cross-sectional and longitudinal studies are of course needed before 18F-FDG PET analysis of RA joints can be considered as an established method for diagnosis and therapeutic follow-up in rheumatology practice.
CONCLUSION
The metabolic activity is significantly increased in diseased joints of patients with RA. 18F-FDG PET results are correlated with validated clinical methods for assessing disease activity. PET is a suitable and quantitative method for clinically evaluating RA patients.
Acknowledgments
We thank Elisabeth Mailleux for her expertise in joint assessment; Etienne Deflandre, Catherine Lust, Christian Hauwaert, Marco Hirsh, and Anne-Marie Jeugmans for their clinical collaboration; and Veronique Jonart for her editorial assistance.
Footnotes
Received Oct. 27, 2003; revision accepted Jan. 13, 2004.
For correspondence contact: Michel G. Malaise, MD, PhD, Department of Rheumatology, Room 155 BC + 3, Centre Hospitalier Universitaire Sart-Tilman B35, B-4000 Liège, Belgium.
E-mail: Michel.Malaise{at}ulg.ac.be
REFERENCES
In this issue


Jump to section
Related Articles
Cited By...
- Oncologic Staging with 68Ga-FAPI PET/CT Demonstrates a Lower Rate of Nonspecific Lymph Node Findings Than 18F-FDG PET/CT
- Total-Body 18F-FDG PET/CT in Autoimmune Inflammatory Arthritis at Ultra-Low Dose: Initial Observations
- Whole-Body Macrophage Positron Emission Tomography Imaging for Disease Activity Assessment in Early Rheumatoid Arthritis
- Early prediction of treatment response in rheumatoid arthritis by quantitative macrophage PET
- A model of chronic enthesitis and new bone formation characterized by multimodal imaging
- 18F-FEDAC as a Targeting Agent for Activated Macrophages in DBA/1 Mice with Collagen-Induced Arthritis: Comparison with 18F-FDG
- In Vivo Imaging of Cell Proliferation Enables the Detection of the Extent of Experimental Rheumatoid Arthritis by 3'-Deoxy-3'-18F-Fluorothymidine and Small-Animal PET
- 18F-FDG PET as a Tool to Predict the Clinical Outcome of Infliximab Treatment of Rheumatoid Arthritis: An Explorative Study
- Contrast-enhanced Coded Phase-inversion Harmonic Sonography of Knee Synovitis Correlates with Histological Vessel Density: 2 Automated Digital Quantifications
- Inflammatory Cytokines and Hypoxia Contribute to 18F-FDG Uptake by Cells Involved in Pannus Formation in Rheumatoid Arthritis
- Positron emission tomography with computed tomography imaging of neuroinflammation in experimental autoimmune encephalomyelitis
- Increased 18F-FDG Uptake in Degenerative Disease of the Spine: Characterization with 18F-FDG PET/CT
- FDG-PET/CT scan of inflammatory spondylodiscitis lesions in ankylosing spondylitis, and short term evolution during anti-tumour necrosis factor treatment
- 18F-FDG PET in Rheumatoid Arthritis: There Still Is a Long Way to Go