


Abstract
We determined the prevalence of abnormal spinal 18F-FDG uptake and assessed the relationship between the severity of findings on 18F-FDG PET and the severity of degenerative spinal disease (DSD) on CT. Methods: PET/CT scans of 150 patients >18 y old, referred for whole-body 18F-FDG PET/CT for evaluation of known or suspected malignancy from June to July 2002, were analyzed retrospectively for the presence of increased 18F-FDG uptake in the spine and for anatomic correlates. Initially, PET images were examined and foci of 18F-FDG uptake in the spine were graded on a 0–4 scale based on intensity of 18F-FDG uptake (0 = definitely normal, 1 = probably normal, 2 = equivocal, 3 = probably abnormal, 4 = definitely abnormal). From PET alone, an impression as to whether lesions were most likely metastases or degenerative, as well the level of the spine involved, was also recorded. CT images of all 150 patients were reviewed independently by a musculoskeletal radiologist, who was unaware of patient identification, history, and findings of other imaging modalities, with the location recorded and severity graded on a 4-point-scale (0 = normal, 1 = mild, 2 = moderate, 3 = severe for both degenerative disk and facet disease). The relationship between PET and CT findings was then determined. Results: Of the 150 patients, 63 (42.0%) had no abnormal findings in the spine on PET (grade 0), 27 (18.0%) had grade 1, 25 (16.7%) had grade 2, 17 (11.3%) had grade 3, and 16 patients (10.7%) had grade 4 18F-FDG uptake for DSD. Two additional patients had apparent spinal metastases with no degenerative changes. Five patients had metastases and DSD (included above). Of the patients who had abnormal spinal findings graded as probable or definite for DSD on CT (grades 3–4), 11 had abnormal findings in the cervical spine, 16 in the thoracic spine, and 23 patients in the lumbosacral spine. Seven patients (4.7%) had PET findings suggestive of spinal metastases. For patients with a maximum regional DSD score of 3, the mean 18F-FDG uptake for that spinal level was 1.4 ± 1.5, whereas for patients with a maximum regional DSD score of 0, the mean PET grade was significantly lower at 0.4 ± 0.9 (P = 0.0001). Conclusion: Incidental findings on PET suggestive of DSD are common (22% of patients), most common in the lumbosacral spine, and can be recognized on CT. The severity of PET findings correlates with the severity of degenerative disk and facet disease as graded by CT, likely due to the fact that the inflammatory process that accompanies DSD is evident on PET. Increased 18F-FDG uptake in DSD should not be confused with metastatic disease.
Dedicated PET/CT, the combination of dedicated PET and CT, is a powerful tool that provides both metabolic and anatomic information (1). CT enhances PET by enabling more accurate localization and characterization of PET findings, shortens scanning time, and provides improved diagnostic accuracy and certainty in common conditions such as lung and colon cancer (1,2). The spine is a common site of skeletal metastases in cancer patients. However, degenerative spinal changes also are very common in that same patient population and must not be confused with malignancy. 18F-FDG PET helps us to differentiate benign from malignant lesions in the spine. PET with 18F-FDG has been reported to have fewer false-positive studies in the spine than bone scans with 99mTc-diphosphonates (3). Because degenerative changes and spinal metastases are typically located at different sites and have different morphologies, they can be well recognized by the CT portion of 18F-FDG PET/CT. This can also explain the better specificity of 18F-FDG PET/CT compared with 18F-FDG PET alone in the detection of spinal metastases (4).
18F-FDG PET has additional uses in the evaluation of spinal disease. Stumpe et al. found 18F-FDG PET to be useful for the differentiation of degenerative from infectious endplate abnormalities in the lumbar spine detected on MRI (5). 18F-FDG PET was also useful in diagnosing infection (6–8). Although 18F-FDG PET was found to correlate with MR and clinical findings in quantifying inflammatory activity in the wrist (9), this relationship has not been explored in the spine.
The objective of this study was to use the strengths of 18F-FDG PET and CT to systematically determine the prevalence of abnormal focal 18F-FDG PET findings in the spine and determine if any were caused by degenerative spinal disease (DSD) as well as to assess the correlation between the severity of findings on 18F-FDG PET with CT. Our expectation was that at least some foci of 18F-FDG avidity in the spine were attributed to DSD and that these could be clearly identified with 18F-FDG PET/CT.
MATERIALS AND METHODS
All 150 consecutive patients >18 y old who were referred for whole-body 18F-FDG PET/CT for evaluation of known or suspected nonbrain malignancy from June to July 2002 (69 males, 81 females; age, 19–88 y; mean age, 60.4 ± 14.5 y) were reviewed retrospectively for the presence of increased 18F-FDG uptake in the spine and independently for the presence or severity of degenerative disease of the spine. This was a retrospective blinded review and thus ruled as an exempt study by the institutional review board with regard to written informed consent. All 18F-FDG PET/CT scans were performed with the Discovery LS PET/CT scanner (GE Healthcare). Patients fasted for at least 4 h before 18F-FDG injection. Blood glucose levels were checked before 18F-FDG injection and the patient received 8.14 MBq/kg (0.22 mCi/kg) 18F-FDG intravenously. The patients received READI-CAT barium sulfate oral contrast (E-Z-EM Canada Inc.) for non–head and neck cancer imaging. For patients weighing >68 kg, 2 bottles were administered before 18F-FDG injection and 1 bottle was administered 30 min after 18F-FDG injection. For patients weighing ≤68 kg, 1.5 bottle were administered before 18F-FDG injection and 1/2 bottle was administered 30 min after 18F-FDG injection. A tracer uptake phase of approximately 60 min was allowed, during which the patients sat in a quiet room without talking. The patients were instructed to breathe normally during CT and 18F-FDG PET acquisition. No intravenous contrast material was administered in these patients.
CT Scanning
CT was performed before 18F-FDG PET emission acquisition. Patients were normally positioned with their arms up. Images were acquired with the patients positioned the same as for the emission scan by adjusting the table in linear increments. The CT portion of the Discovery LS scanner consists of a multidetector helical CT scanner (LightSpeed Plus; GE Healthcare). The imaging parameters used for a typical 6-bed–position PET/CT acquisition were 140 kVp, 80 mA, 0.8 s per CT rotation, a pitch of 6, a table speed of 22.5 mm/s, a 31.9-s acquisition time. The milliamperes were adjusted upward in larger patients on the basis of body weight. CT data were resized from a 512 × 512 matrix to a 128 × 128 matrix and were smoothed to match the 18F-FDG PET data to allow for fusion of the CT and 18F-FDG PET images. A CT transmission map was used for attenuation correction; 512 × 512 CT images were also available digitally for interpretation.
PET Scanning
18F-FDG PET emission data were acquired for 5–7 bed positions, generally from the base of the skull to the level of the midthighs. Emission data were obtained for 5 min for each bed position in the 2-dimensional mode. Each bed position had 35 scanning planes with a 14.6-cm longitudinal field of view and a 1-plane overlap between scanning bed positions. CT data were used for generation of the transmission map. 18F-FDG PET images were reconstructed to a 128 × 128 matrix using CT data for attenuation correction with the ordered-subsets expectation maximization algorithm (2 iterations, 28 subsets) and an 8-mm gaussian filter. Both CT attenuation-corrected images and nonattenuation-corrected images were reviewed.
Image Analysis
18F-FDG PET and CT studies were reviewed and interpreted retrospectively and independently by a nuclear medicine physician and a musculoskeletal radiologist, respectively, who were unaware of patient identification, history and findings of other imaging modalities. The studies had previously been interpreted clinically, but the clinical reports were not used for this study. All 18F-FDG PET and CT images were reviewed on an interactive computer display using commercial fusion software (eNTEGRA; GE Healthcare). 18F-FDG PET and CT studies were reviewed in a random order, followed by 18F-FDG PET/CT studies in a separate reading session, also in a randomized order, without access to the previous 18F-FDG PET reading.
18F-FDG PET images of all 150 patients were reviewed and analyzed retrospectively by a board-certified nuclear medicine physician with 2.5 y experience in PET. Initially, 18F-FDG PET images were examined without CT, and foci of 18F-FDG uptake in the spine were identified and scored on a 0–4 scale based on the intensity of tracer uptake relative to surrounding background tissues about that region of the spine as follows: 0 = definitely normal (uptake less than or equivalent to background), 1 = probably normal (mild 18F-FDG accumulation near background level), 2 = equivocal (focal uptake equivocally greater than background), 3 = probably abnormal (focal uptake probably greater than background), 4 = definitely abnormal (focal uptake clearly greater than background). From 18F-FDG PET alone, an impression as to whether lesions were most likely metastases or degenerative was also recorded with lesions obviously in the vertebral body viewed as most consistent with metastases. These scores were recorded for regions of the spine, so that a maximum score was recorded for each area of the spine (cervical, thoracic, and lumbosacral spine). Thus, 3 scores were recorded per patient. In the patients with metastases, the scan at the tumor site was not included in the analysis.
CT images of all patients were reviewed for DSD by an experienced musculoskeletal radiologist and graded using established criteria (10–13). Diagnostic grading for degenerative disk disease on CT was graded as follows: 0 = normal, 1 = mild (no disk narrowing, osteophytes < 2 mm, no significant canal narrowing), 2 = moderate (visible disk narrowing, osteophytes > 2 mm, canal stenosis central or lateral 150–250 mm2), 3 = severe (complete loss of disk height, osteophytes > 2 mm, canal stenosis 100–250 mm2 or touching cord). Diagnostic grading for degenerative facet disease was graded as follows: 0 = normal, 1 = mild (sclerosis, no hypertrophy), 2 = moderate (hypertrophy, no narrowing of neural foramina), 3 = severe (neural foramina narrowing). The location and type (disk or facet) of the degenerative changes were recorded by precise vertebral number and region, as for 18F-FDG PET. Other CT findings such as metastases were also recorded. Metastases were lytic, blastic, or mixed in character, as assessed on standard CT bone windows. For metastases, a binary “yes” or “no” scale was applied based on typical radiographic criteria. A sclerotic lesion with morphologic characteristics not typical of bony island (sclerotic focus with thorny borders) was classified as suspicious for metastatic disease. A lytic or mixed lytic lesion with an ill-defined or permeative appearance not typical of endplate changes associated with degenerative disk disease was also classified as suspicious for metastatic disease. Finally, spondylolysis was also recorded on a binary “yes” or “no” scale based on the presence or absence of pars defects.
Region-by-Region Analysis
The grades of the 18F-FDG PET findings in the spine were compared directly with the CT grading, region by region and for the entire spine. The spine for this purpose was divided into sections: cervical, thoracic, and lumbosacral spine.
Statistical Assessment
Descriptive statistics regarding the CT and PET findings were generated. Grading of 18F-FDG PET and CT were compared directly for each region using the Mann–Whitney test. P < 0.05 was considered statistically significant. Correlation coefficients were also determined between the qualitative 18F-FDG PET readings and the qualitative CT readings. Because the CT and PET grades used are categoric, Spearman correlation was calculated. As many of the foci of degenerative disease were small, including in the facet joints, standardized-uptake-value (SUV) determinations were not done because of the difficulties associated with partial-volume corrections for small and irregularly shaped structures.
RESULTS
Of the 150 patients studied, 63 patients (42.0%) had no abnormal findings in the spine on 18F-FDG PET (grade 0). Twenty-seven patients (18.0%) had minimal PET findings in the spine, graded as probably normal (grade 1). Twenty-five patients (16.7%) had equivocal PET findings (grade 2). Seventeen patients (11.3%) had abnormal PET findings, graded as probably abnormal (grade 3), and 16 patients (10.7%) had PET findings graded as definitely abnormal for DSD (grade 4). Two patients had metastases only on 18F-FDG PET, whereas 5 patients had metastases and DSD (included above).
Of the 150 patients, a total of 450 regions could be assessed by PET (3 spinal levels for each patient). These findings are summarized in Table 1. Of the 33 patients who had abnormal spinal findings graded as probable or definite for DSD (grades 3 and 4), 11 patients had abnormal findings in the cervical spine, 16 patients had abnormal findings in the thoracic spine, and 23 patients had abnormal findings in the lumbosacral spine.
Distribution of Degenerative PET Grades in Various Spinal Levels
Of the 150 patients, a total of 900 regions could be assessed by CT (3 spinal levels, as well as disk vs. facet joint for each level). In 2 patients (1.3%) the maximum CT grade of abnormality in any spinal level was 0, in 26 patients (17.3%) the maximum CT grade was 1, in 71 patients (47.3%) the maximum CT grade was 2, and in 51 patients (34.0%) the maximum CT grade was 3.
Of the 450 spinal levels considered (3 for each of the 150 patients), in 104 spinal levels (23.1%), the maximum CT grade seen (facet and disk spaces combined) was 0. In 110 spinal levels (24.4%), the maximum CT grade seen was 1. In 173 spinal levels (38.4%), the maximum CT grade seen was 2. In 63 spinal levels (14.0%), the maximum CT grade seen was 3.
The distribution of the CT grades in the disk and facet joints in the cervical, thoracic, and lumbosacral spine for all patients combined is shown in Tables 2 and 3. In our patient population, degenerative changes seen on CT (CT grades 1, 2, and 3) were most common in the lumbosacral spine. It was not uncommon for more than one area of the spine to be involved with degenerative changes.
Distribution of Degenerative CT Grades in Various Spinal Levels
Distribution of Degenerative CT Grades in Various Spinal Levels: Disk vs. Facet Joint
There is a great deal of variability in terms of the intensity of 18F-FDG uptake versus the severity of degenerative disease. Some patients with severe degenerative changes in disks or vertebrae have low 18F-FDG uptake, whereas others with severe degenerative disease have much higher 18F-FDG uptake. Although there is overlap and variability, it is clear that for both degenerative disk disease and degenerative facet disease, 18F-FDG uptake is significantly higher in patients with severe degenerative disease than in those with no obvious degenerative disease on CT. For severe degenerative disk disease, there is greater 18F-FDG uptake than in normal disks (P = 0.039). For severe facet joint disease, there is greater 18F-FDG uptake than in normal facets (P < 0.0001). For both types of DSD (disk and facet) combined, the difference between 18F-FDG uptake values was substantial, with greater 18F-FDG uptake in severe degenerative regions than in normal regions (P = 0.0001) (Table 4, 5, and 6). Of note is the larger difference between 18F-FDG uptake in regions with CT grade 0 versus CT grade 3 degenerative facet disease than between CT grade 0 versus CT grade 3 degenerative disk disease.
Comparison of CT Grading of Degenerative Disk Disease and PET Grading (per Spinal Level)
Comparison of CT Grading of Degenerative Facet Joint Disease and PET Grading (per Spinal Level)
Comparison of CT Grading of Degenerative Facet Joint and Disk Disease Combined and PET Grading (per Spinal Level)
The correlation between the maximum CT grade (disk and facet joints combined) and the PET grade for the corresponding spinal level was analyzed. In general, the correlation was positive but weak. The correlation coefficient was 0.0878 (P = 0.2855) in the cervical spine, 0.2318 (P = 0.0043) in the thoracic spine, 0.3567 (P < 0.0001) in the lumbosacral spine, and 0.2266 for all spinal levels combined (P < 0.0001). The mean PET grade ± SD for spinal levels with a CT grade of 0 was 0.38 ± 0.87. The mean PET grade ± SD for spinal levels with a CT grade of 1 was 0.49 ± 0.97. The mean PET grade ± SD for spinal levels with a CT grade of 2 was 0.71 ± 1.16. The mean PET grade ± SD for spinal levels with a CT grade of 3 was 1.38 ± 1.55. These findings are shown in Table 6. The correlation between disk grade on CT and PET grade in corresponding spinal levels was positive and significant but weak (correlation coefficient r = 0.1466; P = 0.0018). The correlation between facet joint grade on CT and PET grade in corresponding spinal levels was significant and positive but also weak (correlation coefficient r = 0.1561; P = 0.0009).
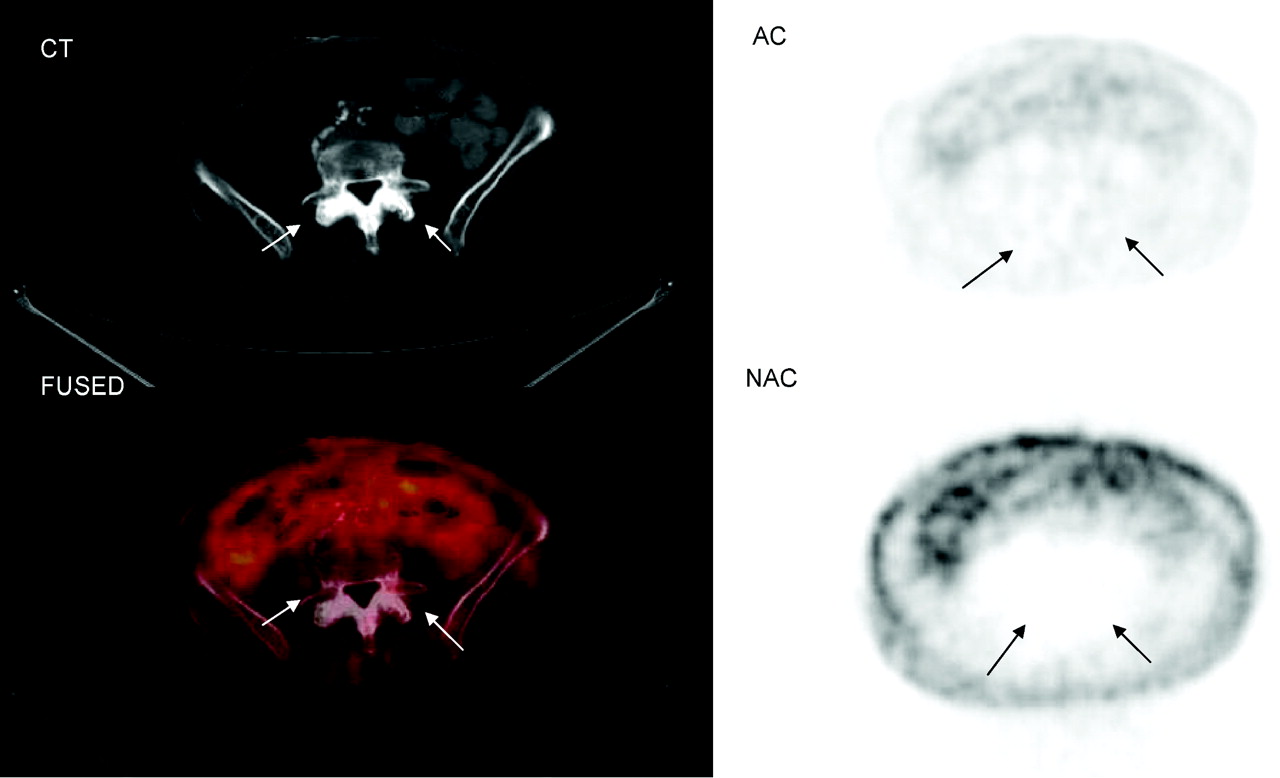
Illustrative figures demonstrate the findings described earlier. In Figure 1, 18F-FDG PET/CT images show increased 18F-FDG uptake in the region of the facet joint, corresponding to degenerative facet disease seen on CT. In Figure 2, 18F-FDG PET/CT images show abnormal 18F-FDG uptake in the region of degenerative disk and degenerative facet disease seen on CT. In contrast, in Figure 3, only minimal or no 18F-FDG uptake is seen in spite of severe degenerative changes evident on CT.

18F-FDG PET/CT images of lumbosacral spine show increased 18F-FDG uptake in region of facet joint, corresponding to abnormal findings on CT (arrows). (A) Coronal, sagittal, axial, and maximum-intensity-projection (MIP) PET images. (B) CT, attenuation-corrected, fused, and nonattenuation-corrected PET images. AC = attenuation-corrected PET image; FUSED = fused CT and PET images; NAC = nonattenuation-corrected PET image.

18F-FDG PET/CT images of cervical spine show abnormal 18F-FDG uptake in region of disk and facet joint disease seen on CT (arrows). AC = attenuation-corrected PET image; FUSED = fused CT and PET images; NAC = nonattenuation-corrected PET image.

18F-FDG PET/CT images of the lumbosacral spine show no abnormal 18F-FDG uptake in region of facet joint disease seen on CT (arrows). AC = attenuation-corrected PET image; FUSED = fused CT and PET images; NAC = nonattenuation-corrected PET image.
Seven of the 150 patients (4.7%) had PET findings highly suggestive of spinal metastases on the basis of location and intensity; of these 7 patients, 3 patients had apparent sacral metastases, 2 patients had lumbar metastasis, 1 patient had thoracic metastasis, and 1 patient had thoracic, lumbar, and sacral metastases.
DISCUSSION
18F-FDG PET is generally a very sensitive and specific method for detecting systemic metastases of a wide variety of cancers. In some studies, 18F-FDG PET has been shown to be more specific than 99mTc-diphosphonate bone scans, as 18F-FDG PET images show fewer foci of degenerative changes (14). However, some forms of degenerative and inflammatory changes do show abnormal 18F-FDG uptake (15). The accumulation of 18F-FDG in foci of inflammation is well known and has been proven useful for infection detection, among other applications (15–23). 18F-FDG uptake is also clearly increased in various inflammatory joint diseases (9,24), including rheumatoid arthritis (25–27). 18F-FDG PET also has showen promising results in the evaluation of the metabolic activity of synovitis and monitoring rheumatoid arthritis. The SUV appeared to correlate with power Doppler signal and clinical parameters (25).
DSD is very common in the age group of patients who undergo 18F-FDG PET scans for cancer and our initial clinical experience using 18F-FDG PET/CT has shown foci of 18F-FDG uptake in the spine that appeared to clearly localize to radiographic findings of degenerative disease in the spine. To date, very little has been published with regard to the characteristics of spinal 18F-FDG uptake in DSD evident on CT. The purpose of our study was to systematically determine whether our initial clinical impression that some foci of DSD were 18F-FDG avid was substantiated in our patient population. Additionally, this study aimed to assess the relationship between the severity of findings on 18F-FDG PET and CT in DSD. For this purpose, 18F-FDG PET/CT scans of 150 patients referred for whole-body 18F-FDG PET/CT for evaluation of known or suspected malignancy were reviewed and analyzed retrospectively for the presence of increased 18F-FDG uptake in the spine and for the anatomic correlates of the 18F-FDG uptake. Of the 150 patients studied, only 63 patients (42.0%) had no abnormal findings in the spine on 18F-FDG PET (grade 0), whereas 87 patients (58.0%) were found to have abnormal spinal 18F-FDG uptake of various degrees. Of the 33 patients who had abnormal spinal findings graded as probable or definite for DSD (grades 3 and 4), 11 patients had abnormal findings in the cervical spine, 16 patients had abnormal findings in the thoracic spine, and 23 patients had abnormal findings in the lumbosacral spine. Only 7 patients (4.7%) had 18F-FDG PET/CT findings highly suggestive of spinal metastases. On the basis of these findings, it appears that abnormal spinal findings of varying severities are very common on 18F-FDG PET and are commonly of benign etiologies, located most frequently in the lumbosacral spine.
In the second part of the study, CT images of all patients were reviewed blindly by a musculoskeletal radiologist and graded on a 4-point-scale (from 0 = normal to 3 = severe, for both degenerative disk and facet disease). 18F-FDG PET grading was significantly higher in those patients with severe versus normal CT grading of degenerative disk disease or facet disease. There was significantly more intense 18F-FDG uptake, on average, in patients with severe degenerative changes in comparison with those with minimal or no degenerative changes on CT. This relationship may be explained by the inflammatory process that accompanies some phases of DSD, seen on 18F-FDG PET.
Though statistically significant, the relationship we have established between severity of CT findings and severity of 18F-FDG uptake in the spine is weak. The substantial variability in 18F-FDG intensity scores in patients with severe arthritic changes is likely reflective of varying degrees of severity of active inflammation in the imaged degenerative areas. Although 18F-FDG uptake relates to the metabolic activity at one point in time, CT shows the end result of an ongoing process that evolves over many years. In patients who have severe findings on CT and only minimal or no 18F-FDG uptake, it is possible that the inflammatory process that caused the severe findings on CT had subsided with time. On the other hand, in patients who have intense 18F-FDG uptake in the setting of only minimal findings on CT, the opposite may be true. Therefore, as rheumatoid arthritis that waxes and wanes but with time results in anatomic malformations, the process of degenerative disease in the disk and facet joints should be viewed as a continuous process during which there is a variable degree of inflammation evident on 18F-FDG PET, which over the years results in the abnormalities seen on anatomic imaging.
Several limitations exist in our study. We have no biopsy proof of inflammation in regions of suspected inflammatory changes. Other causes of increased glucose use, such as proliferative processes, may be contributory as well. Additionally, the CT images reviewed were of lower z-axis resolution and lower diagnostic quality in comparison with thin-slice diagnostic bone CT. Furthermore, MRI is superior to CT in being able to detect bone marrow edema seen with inflammatory changes and was not evaluated in this study. Our study could also be strengthened by longer-term follow-up to determine the stability and significance of these findings. We did not calculate SUVs as the lesions varied substantially in size and shape; thus, it is not clear what would represent the proper partial-volume correction.
Our study clearly demonstrates that foci of 18F-FDG uptake can occur in foci of DSD evident on CT in the absence of obvious systemic metastases. The 18F-FDG uptake in such spinal foci, while variable, can be intense and is likely related to the severity of the degenerative process. Such foci of increased 18F-FDG uptake should not be confused with active skeletal metastases.
CONCLUSION
Incidental findings on 18F-FDG PET of increased tracer accumulation associated with DSD are common in the population of patients referred for clinical 18F-FDG PET. In this study, 22% of the patients referred for whole-body 18F-FDG PET/CT had findings on 18F-FDG PET most likely to be caused by inflammatory DSD, most commonly in the lumbosacral spine. 18F-FDG PET grading of DSD was related to the CT grading for DSD. The findings of moderate-to-intense 18F-FDG uptake in foci of degenerative changes in the spine should not be confused with metastatic tumor and can clearly be recognized from the CT portion of PET/CT.
Acknowledgments
This research was supported in part by a research grant from GE Healthcare. Dr. Wahl has received grant support and honoraria from GE Healthcare, CPS, Philips, and Cardinal Health.
Footnotes
-
COPYRIGHT © 2006 by the Society of Nuclear Medicine, Inc.
References
- Received for publication February 10, 2006.
- Accepted for publication April 21, 2006.


Jump to section
Related Articles
Cited By...
- [18F]FDG-PET Evaluation of Spinal Pathology in Patients in Oncology: Pearls and Pitfalls for the Neuroradiologist
- Comparison of [18F] FDG-PET/MRI and Clinical Findings for Assessment of Suspected Lumbar Facet Joint Pain: A Prospective Study to Characterize Candidate Nonanatomic Imaging Biomarkers and Potential Impact on Management
- Diagnosis and Differentiation of Bronchioloalveolar Carcinoma from Adenocarcinoma with Bronchioloalveolar Components with Metabolic and Anatomic Characteristics Using PET/CT