


Abstract
18F-FDG PET has been reported to have reduced sensitivity in detecting bronchioloalveolar carcinoma (BAC) versus lung cancers with other histologies. However, there are CT characteristics that are suggestive of BAC, and potentially these could be useful to refine diagnostic criteria so PET/CT can be more accurate in the diagnosis of BAC. We correlated tumor size and density obtained with CT and glucose metabolism obtained with 18F-FDG PET in patients with BAC and adenocarcinoma with BAC components (Adeno+BAC) to determine the roles of both the anatomic and the functional components of the PET/CT examination in diagnosing this disease. Also, the correlation between tumor size and 18F-FDG uptake or Hounsfield unit (HU) value was determined in these 2 groups. Methods: This was a retrospective study on a consecutive series of 53 patients with 57 pathology-proven lesions (26 BAC, 31 Adeno+BAC) who underwent 18F-FDG PET/CT scans. The standardized uptake value (SUV) and average HUs reported were obtained for the tumors. The tumor size, 18F-FDG uptake, and HU values in both groups were compared. The correlation between metabolic (SUV) and CT (HU) characteristics for the lesions and tumor size was assessed using the Pearson correlation coefficient. Results: A total of 26 lesions with pure BAC had a median SUVmax of 1.48 (range, 0.63–4.54). A total of 81% of patients with BAC (21/26 lesions) had SUVmax values of less than 2.5. Thirty-one lesions diagnosed as Adeno+BAC had a median SUVmax of 6.03 (range, 2.45–24) (P < 0.0001 vs. BAC). The mean SUVmax (1.77 ± 0.99) of BAC was much lower than that of Adeno+BAC (6.55 ± 4.33) (P < 0.0001). Maximum HU in BAC lesions (−111.96 ± 123.92) was substantially lower than that in Adeno+BAC (82.03 ± 33.77) lesions (P < 0.0001). The average maximum tumor dimension in the lung window was much smaller for BACs (17.63 ± 5.5) than for Adeno+BACs (49.38 ± 27.5) (P < 0.0001). A strong positive correlation between tumor size and HU was observed in the Adeno+BAC group (P = 0.0002). Conclusion: PET/CT can help differentiate between BAC and Adeno+BAC by using tumor size, CT density, and metabolic activity. Pure BAC exhibits smaller size, lower 18F-FDG uptake, and lower tumor density than does Adeno+BAC. Many BACs have low SUVs (<2.0), but their low HU on CT aids in their proper identification.
Bronchioloalveolar carcinoma (BAC) is a peripheral, well-differentiated neoplasm typically arising beyond a recognizable bronchus. It has a tendency to spread to the peripheral air spaces using the lung structure as stroma (1). The World Health Organization in 1999 revised the definition of pure BAC to include only “noninvasive” lesions with a pure bronchioloalveolar growth pattern and no evidence of stromal, vascular, or pleural invasion (2).
BAC appears radiographically as a single nodule, segmental or lobar consolidation, or diffuse nodules. On CT, the single nodular form appears as a peripheral nodule or area of localized ground-glass opacification (GGO) with or without consolidation. BAC is frequently associated with bubblelike areas of low attenuation and an open bronchus sign (3).
PET scans using 18F-FDG have gained widespread acceptance as a noninvasive method to distinguish benign from malignant lung lesions (4–9). However, 18F-FDG uptake reflecting the tumor glucose metabolic rate varies widely and depends on the histologic type and aggressiveness of the tumor (10,11). Although 18F-FDG PET may be a valuable imaging study in lung cancer, one must be aware of both false-positive and false-negative studies. BAC occasionally has been reported to be falsely negative on 18F-FDG PET studies (12–14).
Differentiation of BAC from adenocarcinoma with BAC components (Adeno+BAC) is important because their treatment options and prognosis are different. Because BAC has lower rates of regional lymph node involvement than do other lung cancers, several groups of investigators have studied the possibility of performing less aggressive resections of lung cancer in patients with pure BAC. Investigators have found equivalent oncologic outcomes in comparison with lobar resections (15–19). Arenberg and the American College of Chest Physicians in “Bronchioloalveolar Lung Cancer: ACCP Evidence-Based Clinical Practice Guidelines” in 2007 recommended sublobar resection of pure BAC (20).
Recently, the combined approach of 18F-FDG PET and CT has had a significant effect on the diagnosis and staging of lung cancer (21). The purpose of this current study was to determine the relationship between tumor metabolism measured with 18F-FDG PET and tumor attenuation obtained with CT for the detection of BAC and Adeno+BAC features, as well as to compare these 2 groups with each other. The overall goal was to evaluate the combined morphologic or PET characteristics and their ability to predict BAC.
MATERIALS AND METHODS
For this study, our institutional review board allowed expedited retrospective review of the database of patients with lung cancer who had undergone PET/CT; the institutional review board waived the requirement for informed consent.
Patient Selection
From September 2001 to September 2007, 53 untreated patients with 57 lesions (33 men, 20 women; mean age, 68 ± 13 y; range, 33–89 y), with pathologically proven BAC of the lung who had undergone PET/CT as part of their management, were identified. From this group of patients, 51 patients had primary lung tumors (4 patients had primary tumors in 2 different locations; from these 4 patients, 2 had 2 Adeno+BACs, 1 had 2 BACs, and 1 had 1 BAC and 1 Adeno+BAC). Two patients had recurrent disease (both patients had Adeno+BAC as primary and pure BAC as recurrent tumor). In 26 patients with pure BAC, 9 had nonmucinous lesions, 4 mucinous, 1 mixed, 2 sclerosing, and 1 goblet; in 9 cancers, the pathologists did not specify histologic subtype. Thus, we had 25 patients with 26 lesions of pure BAC according to the 1999 World Health Organization definition and 29 patients with 31 lesions with Adeno+BAC. As this was a retrospective study, determining the precise percentage of BAC in the Adeno+BAC group was not possible.
Surgical removal or sampling of 56 lesions was performed within an average of 37 ± 25 d after the PET study (range, 0–136 d; median, 36 d after PET). In 1 patient, lobectomy was performed a year and a half after the initial diagnosis. In this patient, the follow-up CT before surgery did not show any change in the tumor size. Overall, 47% (27/57) of the lesions were removed by lobectomy and 28% (16/57) by wedge resection or segmentectomy, and another 25% (14/57) were diagnosed by CT-guided biopsy or transbronchial biopsy.
Of the patients with pure BAC, 20 of 26 had a prior history of cancer (BAC or non-BAC). A PET/CT scan was performed in 14 of 26 patients for prior cancer follow-up, in 7 patients for abnormal chest radiography or CT findings, in 3 of 26 patients for respiratory symptoms, and in 2 patients for growing previous pulmonary nodules. All CT, PET, and fused PET/CT images were retrospectively examined by at least 1 single, experienced PET/CT reader.
In addition, the clinical records (patients' history including previous treatment in recurrent cases, report of surgery, pathology report, and other imaging studies) were reviewed.
PET/CT
For whole-body imaging, a PET scan was performed using either the Discovery LS or the Discovery ST-RX (GE Healthcare). The details of the imaging procedures are presented in the study by Rosen et al. (22).
The patients had fasted for at least 4 h before 18F-FDG was administered. The serum glucose level at the time of 18F-FDG administration averaged 106 ± 20 mg/dL. Patients received 2 bottles (450 mL per bottle) of CT contrast (barium suspension, 1.3% w/v) at least 10 min before receiving 18F-FDG intravenous injections, followed by another bottle of contrast 40 min later. This method was previously reported (23).
18F-FDG was administered intravenously at a targeted dose of 8.14 MBq/kg ([0.22 mCi/kg]; range, 481–1,032.3 MBq [13–27.9 mCi]; average dose, 648.6–114.7 MBq [17.53 ± 3.1 mCi]). 18F-FDG was synthesized using the method described by Hamacher et al. (24). A tracer uptake phase lasting about 60 min was implemented; during this phase, the patients were instructed to sit in a quiet room without talking or chewing. After the uptake phase, a nonintravenous contrast-enhanced CT image acquisition of the region from the meatus of the ear to the middle portion of the thigh was performed for approximately 20–35 s without patient breath-holding. A whole-body emission scan of the same transverse plane was performed with a 5-min acquisition period at each bed position.
The CT images were used not only to fuse images but also to generate the attenuation map that was used for attenuation correction. PET images were typically reconstructed using an ordered-subset expectation maximization iterative reconstruction algorithm (typically 2 iterations, 28 subsets), an 8-mm gaussian filter with a 128 × 128 matrix, and CT attenuation correction or the equivalent.
Image Interpretation
Images were interpreted at a workstation on which they could be displayed with or without attenuation correction for PET with registered oral-contrast CT. All clinical reports for PET/CT were examined, and 1 researcher reviewed all original images. For qualitative analysis, the degree of 18F-FDG activity in the tumors was visually scored using the following 5-point grading system: 0, same as lung background activity; 1, greater than lung, but less than mediastinal blood-pool activity; 2, same as mediastinal blood-pool activity; 3, slightly greater than mediastinal blood-pool activity; and 4, substantially greater than mediastinal blood-pool activity. Foci of activity with grades 2–4 were considered abnormally increased on PET (13).
For quantitative analysis, an experienced nuclear medicine physician drew a circular region of interest (ROI) around the whole area of 18F-FDG accumulation in the tumor inside the lung. In some cases, no tumor was detected by PET because of very low (ROI) 18F-FDG uptake. In such cases, the location of the tumor was determined by comparing the coregistered PET/CT and CT images with the ROI drawn on the basis of CT and PET. The maximum standardized uptake value (SUVmax) was calculated by using the following formula: SUVmax = C/(ID/w), where C is the activity at a pixel within the tissue defined by an ROI (in kBq [μCi]/cm3); ID the injected dose (in kBq [μCi]); and w the patient's total body weight (in g). Semiquantitative analysis of the lesion was performed by calculating the maximum SUV in the hottest single pixel.
The CT attenuation values (in Hounsfield units [HUs]) in the ROI of each lesion were also measured in the lung window on all slices in which the tumor was visible. The size of each circular ROI was adapted to encompass as much of the tumor as possible while leaving a distance of about 2 mm from the tumor borders (largest ROI) in a slice that showed the highest average tumor density. If all tumor borders could not be included in one circular ROI, we moved the circular ROI to different locations of the tumor and measured HU in different locations, considering the highest average HU in a circular ROI as average tumor density. The highest HU single-voxel value was also recorded from the circular ROI with the highest mean HU.
For measuring tumor size, the CT images from the PET/CT scan were assessed using a window level of −600 HUs with a window width of 1,700 HUs for the lung window and a window level of 25 HUs with a window width of 350 HUs for the mediastinal windows. The maximum dimensions (max D) of the tumor and the largest dimension perpendicular to the maximum axis (per-D) were determined on the lung and mediastinal windows (max D range, 9.4–115 mm in lung window and 0–115 mm in mediastinal window). In 81% of the BACs and 6.45% of Adeno+BACs, max D was less than 2 cm on the lung window. Tumor shadow disappearance rate (TDR) (25–28) was determined from the following formula: Each patient was assigned a lung cancer TNM stage on the basis of clinical and surgical–pathologic data and imaging and follow-up information, according to the revised International System for Staging Lung Cancer (29).
Statistical Analysis
Statistical analysis was performed using S-Plus software (Insightful Corp.) or Microsoft Excel (Microsoft). In the BAC and the Adeno+BAC groups, the mean difference in tumor size, 18F-FDG uptake, and HU values were compared with the 2-tailed Student t test for unpaired data. The association between tumor size, 18F-FDG uptake, and HU was examined using the Pearson correlation coefficient test. All P values were 2-tailed. P less than 0.05 was considered a significant difference or relationship.
RESULTS
Table 1 summarizes the characteristics of the 53 patients in the study.
Patient Characteristics
No statistically significant differences between the BAC and Adeno+BAC groups in age distribution, sex, or smoking status were demonstrated. All patients in the BAC group were diagnosed with stage 1 disease; in the Adeno+BAC group, 19 patients (61%) had stage 1 disease, 1 patient (3%) had stage 2, 4 patients (13%) had stage 3, and 7 patients (23%) had stage 4. Adeno+BAC had a significantly higher stage at presentation than did BAC (P = 0.0001).
Table 2 summarizes the results of the tumor characteristics for the 53 patients in the study.
Tumor Characteristics
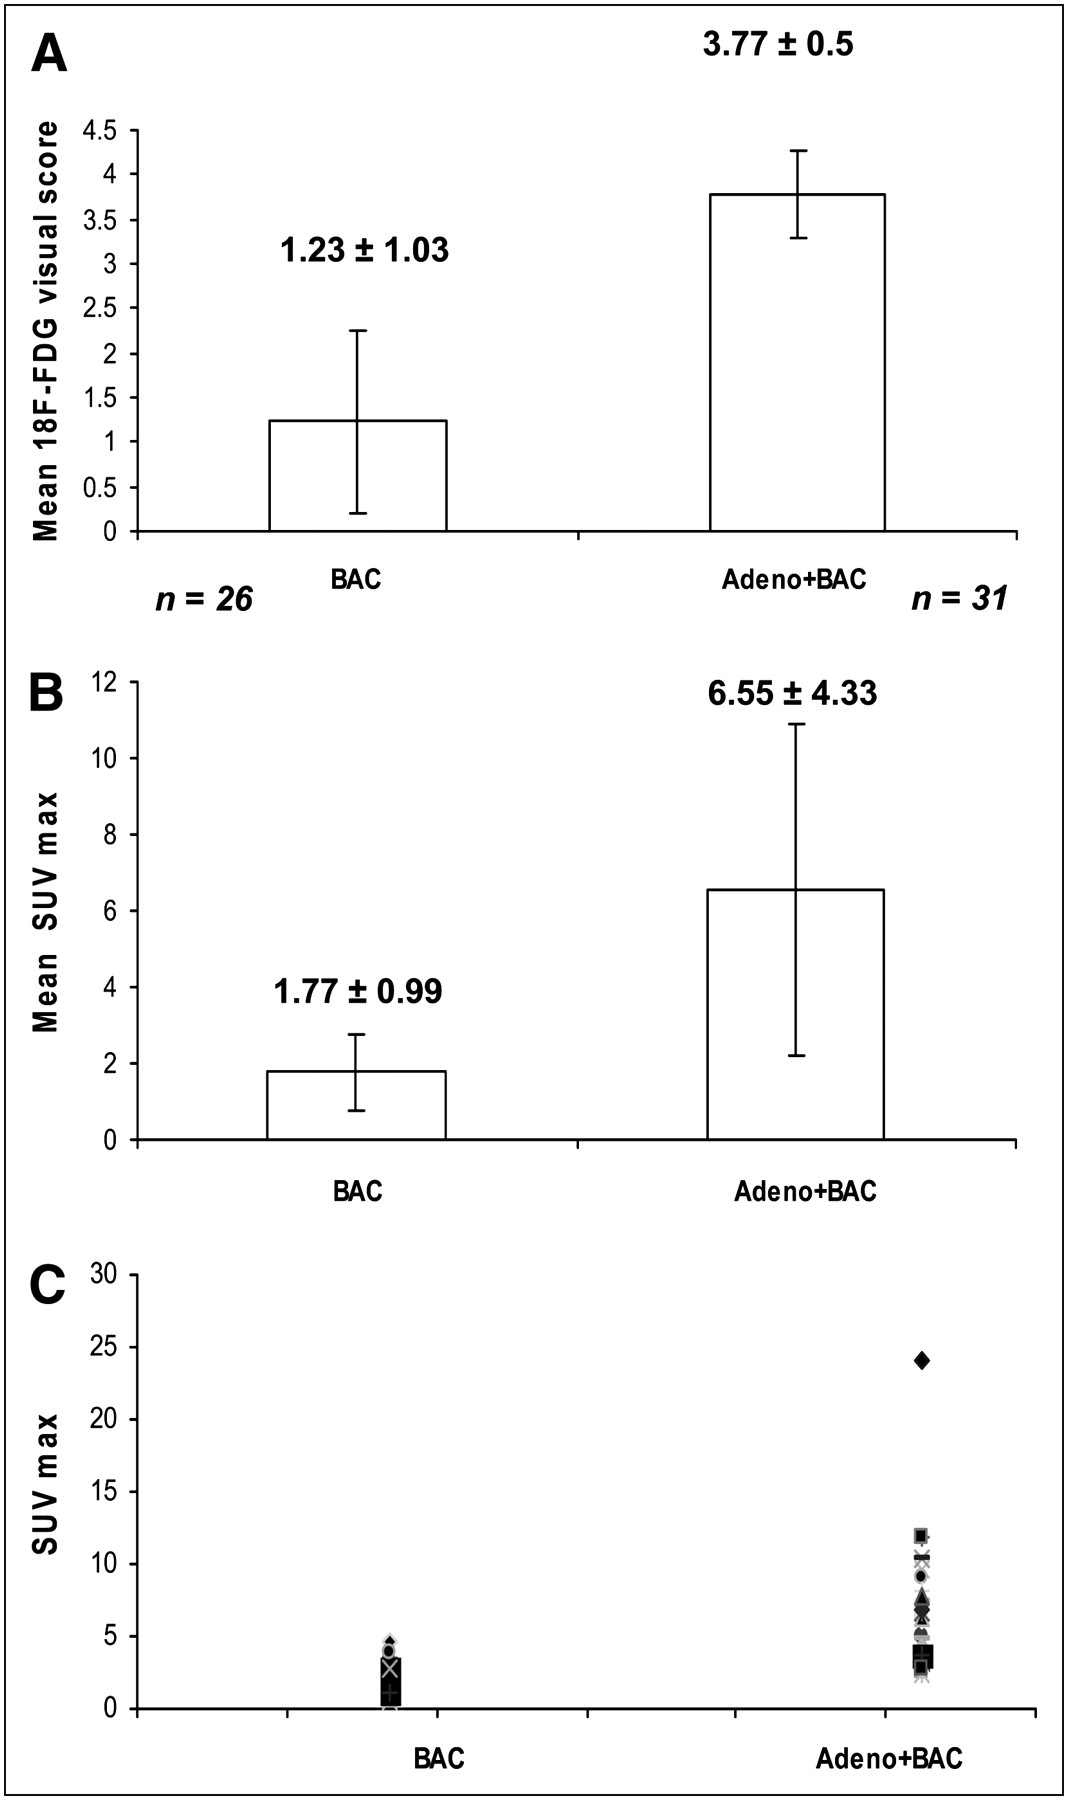
18F-FDG uptake was assessed with the visual scoring system, which was based on comparison with the mediastinal blood pool. In 26 lesions with pure BAC, 19 lesions showed negative results (grade 0, 6 lesions; grade 1, 13 lesions). Of the other 7 lesions, 2 lesions were grade 2 and 5 lesions were grade 3. No lesion with grade 4 uptake qualitatively was found. Of 31 lesions with Adeno+BAC, 1 was grade 2, 5 were grade 3, and 25 were grade 4. A typical example of a patient with BAC is shown in Figure 1. Figure 2 is an example of a patient with Adeno+BAC. The mean visual score of the BAC group (1.23 ± 1.03) was significantly lower than that of the Adeno+BAC group (3.77 ± 0.5) (P < 0.0001; Fig. 3A).

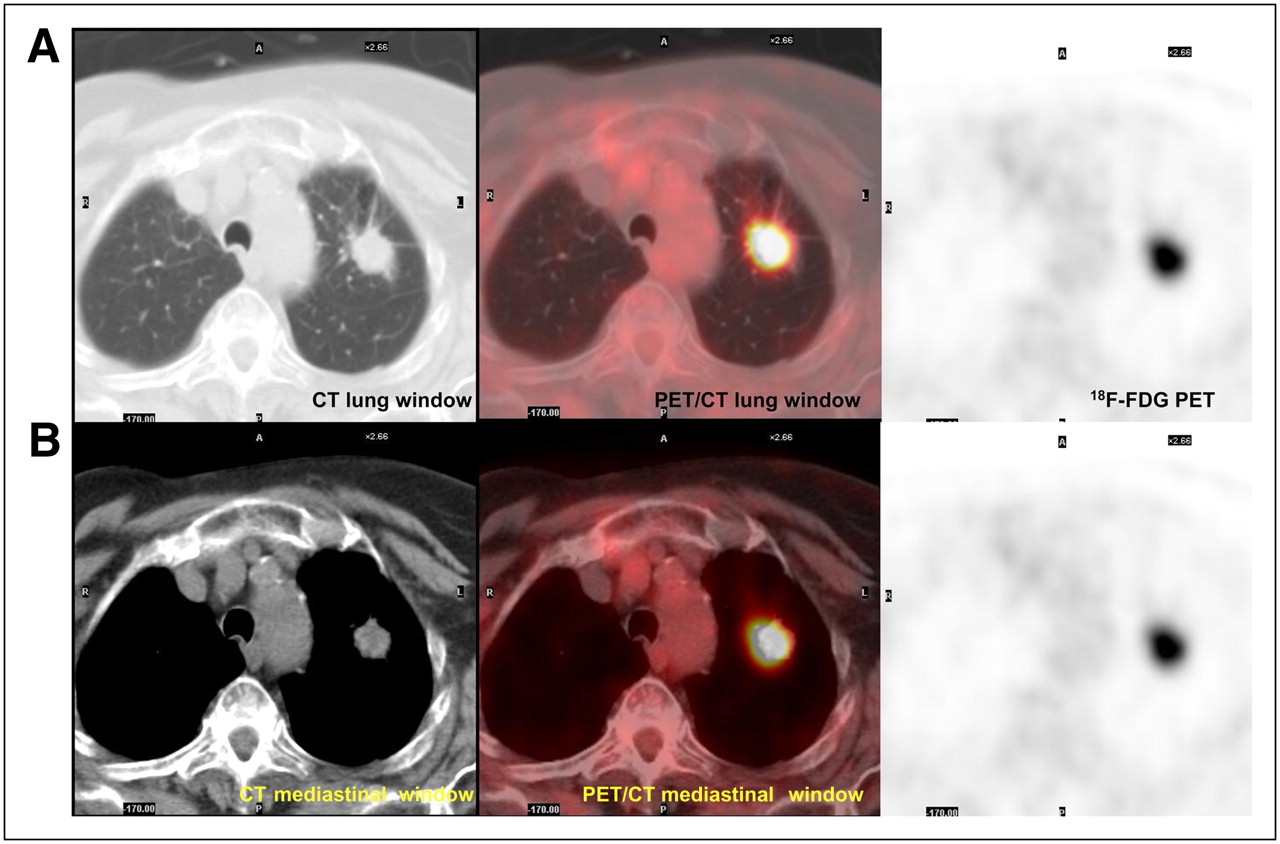
Pure bronchioloalveolar carcinoma, T1 N0 M0. (A) Tumor seen on CT and PET/CT lung window and on 18F-FDG PET images is shown (tumor size, 22 × 12 mm; HUmax, −138; SUVmax, 0.84). (B) Same tumor on mediastinal window was undetectable.

Adenocarcinoma with BAC component, T1 N0 M0. (A) Tumor seen on CT and PET/CT lung window and on 18F-FDG PET images is shown (tumor size, 29 × 19 mm; HUmax, 65; SUVmax, 11.92). (B) Same tumor on mediastinal window was measured at 20 × 17 mm.

(A) Mean visual score of BAC was significantly lower than that of Adeno+BAC (P < 0.0001). (B) Mean SUVmax of BAC was significantly lower than that of Adeno+BAC (P < 0.0001). (C) Scatter plot of SUVmax in individual lesions in BAC and Adeno+BAC.
The mean SUVmax of the BAC group (1.77 ± 0.99) was significantly lower than that of the Adeno+BAC group (6.55 ± 4.33) (P < 0.0001). In our patient population with proven cancers, if the SUVmax was between 0 and 2.5, there was a 3.2% chance that the nodule was Adeno+BAC; if the SUVmax was between 2.5 and 4.0, the chance was 29%, and if it was 4.1 or greater the chance was 67.8% (Fig. 3B). Figure 3C shows the scatter plot of SUVmax in the BAC and Adeno+BAC groups for individual patients.
The median of SUVmax for BAC lesions was 1.48 (range, 0.63–4.54), and for Adeno+BAC lesions it was 6.03 (range, 2.45–24) (P < 0.0001).
A significant difference in average size of the longest diameter in millimeters on the lung window was observed between BAC (17.6 ± 5.5) and Adeno+BAC (49.4 ± 27.5) (P < 0.0001). This difference was also significant on the mediastinal window, with a BAC average size of 2.77 ± 5.26 and an Adeno+BAC average size of 40.64 ± 29.6 (P < 0.0001). The mean percentage of TDR in BAC (99% ± 2.97%) was significantly higher than that in Adeno+BAC (40.12 ± 23.93) (P < 0.0001) (Figs. 4A–4C).
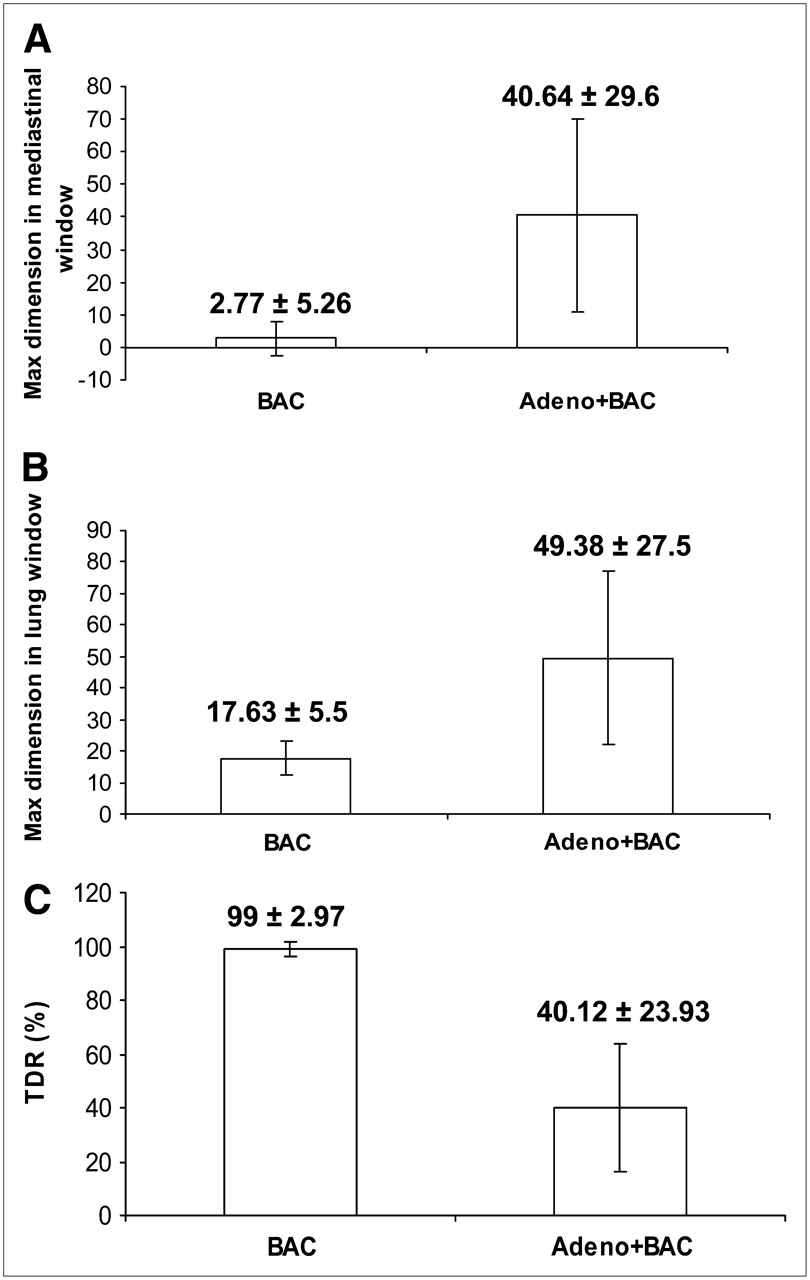
(A) Max D in mediastinal window of BAC was significantly lower than that of Adeno+BAC (P < 0.0001). (B) Max D in lung window of BAC was significantly lower than that of Adeno+BAC (P < 0.0001). (C) Mean TDR percentage of BAC was significantly higher than that of Adeno+BAC (P < 0.0001).
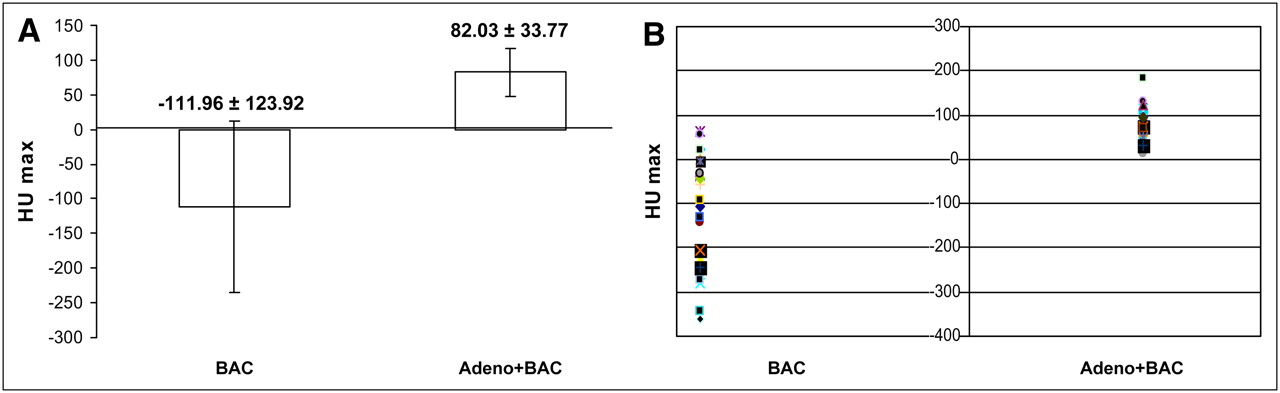
The mean of maximum HUs (HUmax) in patients with BAC (−111.96 ± 123.92) was lower than that in patients with Adeno+BAC (82.03 ± 33.77) (P < 0.0001) (Fig. 5A). Figure 5B shows the scatter plot of the HUmax of BAC and Adeno+BAC in individual patients.

(A) Mean HUmax of BAC was significantly lower than that of Adeno+BAC (P < 0.0001). (B) Scatter plot of HUmax in individual lesions in BAC and Adeno+BAC.
There was a strong positive correlation between tumor size (max D) on the mediastinal window and HU in BAC and Adeno+BAC (P = 0.002 and P = 0.0004, respectively) (Figs. 6A and 6B).
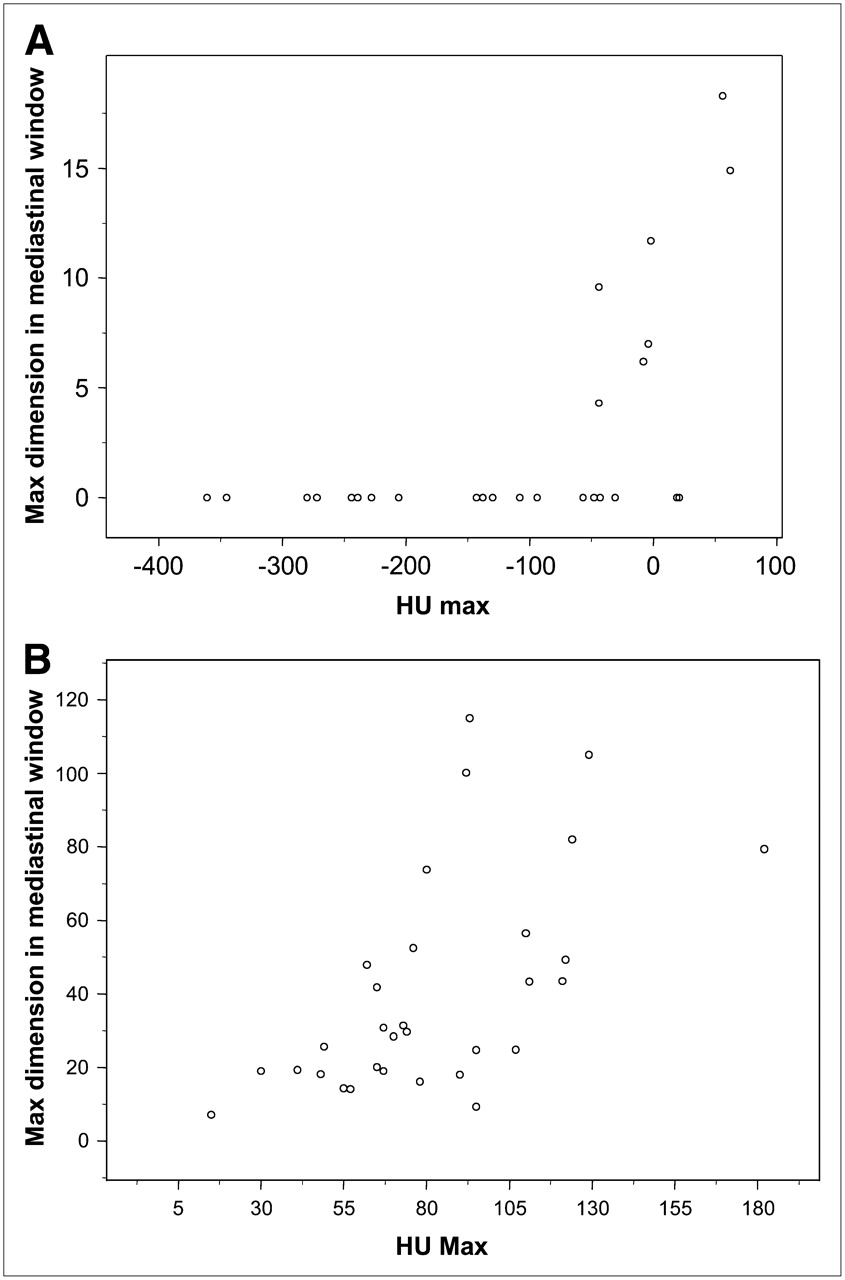
(A) Positive correlation between tumor size on the mediastinal window and HUmax in BAC (P = 0.002, R2 = 0.57). (B) Positive correlation between tumor size on the mediastinal window and HUmax in Adeno+BAC (P = 0.0002, R2 = 0.61).
In Adeno+BAC, the correlation between tumor size (max D) on the lung window and HU was also significant (P = 0.0002) (data not shown).
Also, TDR and HUmax in both groups were positively correlated, and a modest positive correlation between 18F-FDG uptake and HU and between 18F-FDG uptake and TDR in both groups existed, but these did not reach statistical significance. A stronger correlation exists between 18F-FDG uptake and HU values and between 18F-FDG uptake and TDR in the group of patients with Adeno+BAC (data not presented).
Because of larger average tumor size in the Adeno+BAC group, we performed additional analyses, which included only lesions with the longest dimension of at least 30 mm on the mediastinal or lung windows. There were still significant differences in the 2 groups in SUVmax, tumor size, and HUmax (data not presented). A similar analysis was performed comparing stage 1 tumors of the 2 groups; a significantly lower SUVmax, tumor size, and HUmax were present in the pure BAC group (data not presented).
DISCUSSION
Many BAC lesions in our series had an SUVmax of less than 2.5. Many pure BACs had only a 1+ qualitative visual uptake score as well. By contrast, 97% of the Adeno+BACs had an SUVmax greater than 2.5. Our study also demonstrated pure BAC cancers to be smaller and to have higher TDR and lower HUs than did Adeno+BAC cancers. In addition, a strong positive correlation was noted between tumor size and its CT HU density in patients with both BAC and Adeno+BAC. The positive correlation seen between tumor 18F-FDG uptake and tumor HU density was stronger in Adeno+BAC.
18F-FDG PET has been reported to be valuable in differentiating between malignant and benign pulmonary lesions (5–8). BAC is a type of adenocarcinoma that exhibits several features different from other adenocarcinomas. Several reports explain 18F-FDG PET findings in patients with BAC lung tumors (12–14). Higashi et al. reported a series of 7 patients with solitary BAC in whom the mean SUV (1.63 ± 0.82) was significantly lower than that in patients with well-differentiated adenocarcinoma (3.17 ± 1.28) (P = 0.014) (13). Kim et al. reported a significantly lower peak SUV in a group of 9 patients with solitary BAC (3.5 ± 2.2) than that in a group of 39 patients with other cell types of lung cancer (10.8 ± 4.4 for squamous cell carcinoma, 8.8 ± 3.2 for adenocarcinoma) (11). In a study by Yap et al., the average value of SUV in pure BAC was reported to be 3.0 ± 1.4 (30).
Our study confirms lower 18F-FDG uptake (mean SUVmax) in pure BAC (1.77 ± 0.99) than that found in many other cancers. Our study also demonstrates that, compared with the more aggressive adenocarcinoma with BAC components (with SUV 6.55 ± 4.33), the pure BAC had a much lower SUV.
Lower 18F-FDG uptake in pure BAC could be the result of several different factors. It might be due to a low metabolic demand of slow-growing BAC or a small number of metabolically active malignant cells. Several studies have supported a relationship between glucose metabolism measured by 18F-FDG and the growth rate or malignancy grade in lung tumors (31,32). The lower HU in pure BAC suggests lower cellularity or water density consistent with lower cell numbers per cubic centimeter.
Although the BAC group, compared to groups with other lung cancers, had lower SUV, determining a definitive cutoff value from benign nodules is difficult. Bryant et al. have reported that with an SUVmax of 0–2.5, a 24% chance exists that a suggestive nodule will represent cancer. If the SUV cutoff is higher, the possibility of malignancy will increase (33). However, the CT HUs, as well as the GGO on CT, were quite informative, leading many of our patients to have biopsies or surgery, despite their low lesion SUV.
In our patient population, which was biased by the patients' receipt of histologic confirmation, if the SUVmax was between 0 and 2.5, there was a 3.2% chance that the nodule was Adeno+BAC. If the SUVmax was between 2.5 and 4.0, there was a 29.0% chance, and if it was 4.1 or greater, the chance rose to 67.8% in this series.
In addition to cell types of lung cancer, tumor size is important in the evaluation of SUV because 18F-FDG uptake correlates positively with the number of living cancer cells and is also dependent on partial-volume considerations. In our study, the average size of the tumors in the BAC group was smaller than that in the Adeno+BAC group. There was also a positive correlation between tumor size and 18F-FDG uptake in both groups, but it was not statistically significant. Kim et al. reported that a BAC tumor tended to show peak SUV in proportion to its size, but these authors had just 2 cases with tumors larger than 2 cm. The tumors had SUVs less than 3 (11). Higashi et al. reported a 1-cm BAC tumor with high 18F-FDG uptake (13). Clearly, there is some heterogeneity in behavior, but 97% of our patients with Adeno+BAC had an SUV greater than 2.5, whereas 81% of our pure BAC group had an SUVmax of less than 2.5.
BACs usually have a GGO on the CT lung window due to the combined effects of reduction of alveolar air spaces and increased cellular components, with alveolar cuboidal cell hyperplasia, thickening of alveolar septa, and partial filling of the alveolar air spaces by tumor cells (34). GGO will typically vanish on the mediastinal window because of the exclusion of visualization of the low HU region of the BACs on the narrower and higher mediastinal window.
BACs usually have more air spaces and fewer cellular components than do Adeno+BACs, so that the BACs usually have a significantly lower CT number than do the Adeno+BACs. Takamochi et al. proposed TDR as a new preoperative radiologic variable that is calculated from the tumor shadow on both pulmonary and mediastinal window settings on CT (25). The authors showed that a higher TDR was a significant predictor of the absence of pathologic nodal involvement of the lung adenocarcinomas and used TDR as a prognostic factor preoperatively in patients with pathologic N0 disease (25).
Okada showed that both TDR and GGO were well associated with BAC ratios (i.e., the fraction of the tumor that is GGO), which are determined postoperatively. The TDR also had a stronger impact as a predictor of the BAC component (26). The authors recommended calculating TDR because it is more objective than qualitatively evaluating the ratio of GGO, which can have high interobserver variability (27).
In this study, we showed that the mean percentage of TDR in BAC was significantly higher than that in Adeno+BAC. We could not measure 19 of 26 lesions with BAC on the mediastinal window, as they had essentially “disappeared” on these windows. A significant difference in average tumor HU density in patients with BAC with detectable tumor on the mediastinal window setting (mean, 1.5 ± 39.52), compared with BAC with undetectable tumor on the mediastinal window setting (mean, −154 ± 117.36), was demonstrated (P < 0.0001). Furthermore, in this study we showed the positive correlation between tumor HUmax and TDR in BAC (P = 0.06, R2 = 0.37) and Adeno+BAC (P = 0.01, R2 = 0.44). The correlation between 18F-FDG uptake and TDR was not statistically significant but was stronger in Adeno+BAC.
In our study, the BAC mean HU (−111.96 ± 123.92) was much lower than that of Adeno+BAC (82.03 ± 33.77).
Because of scatter and little information about the correlation between CT and PET data, we sought to determine the relationship between tumor sizes, HU, and 18F-FDG SUVs in this study. Qualitative analysis of PET scans in pure BAC showed a sensitivity of 27% on 18F-FDG PET if we considered grades 2–4 as positive scans; however, if grades 1–4 were considered positive, the sensitivity increased to 77%. In this study, we used CT characteristics from the CT portion of the PET/CT study to assess correlations between CT and PET in both BAC and Adeno+BAC. We showed that changes in tumor HU density tended to be in the same direction as changes in glucose metabolism in BAC and Adeno+BAC. However, this correlation was not statistically significant in this population, indicating, not unexpectedly, that PET and CT are displaying different aspects of the lung cancer biology. Better correlations between HUs and SUVs in patients with Adeno+BAC may be because of more cellular components in adenocarcinoma that have BAC components and more consistent glycolytic characteristics.
CONCLUSION
Pure BAC has significantly lower SUV, lower HU, and higher TDR than does Adeno+BAC. A lower qualitative and quantitative threshold must be used to achieve a high-sensitivity diagnostic index in BAC. GGO lesions with a 1+ qualitative uptake score greater than lung tissue and less than mediastinal blood pool were frequently seen in pure BAC. Determining the presence of pure BAC is possible in suggestive pulmonary nodules by using PET/CT and determining TDR, HU, and SUV. This distinction will likely be helpful in surgical planning for the extent of lung resection. With proper differentiation of BAC from Adeno+BAC, 18F-FDG PET/CT may be sufficiently useful to allow for sublobar resection rather than for total lobar resection for surgically treated BACs. Combining the complementary data from the PET and the CT components of PET/CT should enhance the diagnosis, characterization, and management of BAC and Adeno+BAC.
Acknowledgments
We thank Judy Buchanan for her assistance in the preparation of the manuscript.
Footnotes
-
COPYRIGHT © 2008 by the Society of Nuclear Medicine, Inc.
References
- Received for publication March 25, 2008.
- Accepted for publication June 2, 2008.


