


Abstract
For calculation of radiation dose to the marrow, standard dosimetry for radiopharmaceuticals that do not bind to the marrow includes dose contributions from radioactivity in blood and the remainder of the body. For a pure β -emitter such as 90Y, marrow dose is usually determined by the blood contribution. However, myelotoxicity from 90Y-antibody therapy often correlates poorly with marrow dose estimated using the blood method. This study proposes a method to address 2 possible factors affecting marrow dose estimates. These include (a) recycled 90Y in bone/marrow space after 90Y-antibody has been processed in the liver and (b) use of the marrow mass of Reference Man for individual patients. Methods: Thirty-three patients with advanced non-small cell lung cancer were treated with 90Y-anti-TAG-72 murine antibody (CC49). TAG-72 is often expressed in epithelial-derived tumors but not in normal marrow. 111In-CC49 was used as a tracer. The marrow doses from blood were calculated on the basis of radioactivity concentrations in blood. Marrow dose in the lumbar vertebrae was estimated from images for 111In-CC49 uptake in L2–L4. In 20 patients who had CT images, trabecular bone volumes of L2–L4 were measured from CT images to estimate patient-specific marrow mass in L2–L4. The fraction of baseline platelet counts at nadir was used as an indicator of myelotoxicity. Results: Marrow dose per unit injected radioactivity estimated from blood was lower than that from L2–L4 uptake values. Prediction of myelotoxicity using marrow dose estimated from blood was poorer than that using injected dose per body surface area (GBq/m2) (r = 0.31 vs. 0.51). Prediction was improved using marrow dose estimated from L2–L4 uptake, assuming the marrow mass of Reference Man (r = 0.67 for n = 33; r = 0.70 for n = 20). Prediction was worse if reference marrow mass was adjusted by body weight (r = 0.56 for n = 33; r = 0.63 for n = 20). Prediction was not improved if adjusted by body surface area or lean body mass but was improved if adjusted by height (r = 0.72 for n = 33; r = 0.78 for n = 20). The best prediction was obtained (r = 0.85 for n = 20) using patient-specific L2–L4 marrow mass estimated from CT. Conclusion: Marrow dose estimated from the blood radioactivity method was not a good predictor of myelotoxicity for non-marrow-targeting 90Y-antibody therapy. Thrombocytopenia in this group of patients correlated much better with dose estimated from lumbar vertebrae imaging and patient-specific marrow mass than with that estimated from GBq/m2 or standard marrow dose based on blood.
Radiation-induced myelotoxicity is often the dose-limiting factor in radionuclide therapy that does not involve bone marrow reconstitution. The ability to predict peripheral blood counts after radionuclide therapy is important for treatment planning of radioactivity to be administered. To determine the radiation dose to the marrow, standard dosimetry for radiopharmaceuticals that do not bind to the marrow includes dose contributions from radioactivity in the blood and the remainder of the body (1). For antibodies labeled with the pure β-emitter 90Y, marrow dose is determined mainly by 90Y concentration in the blood because the radiation contribution to marrow from tissues other than skeletal is small. However, myelotoxicity induced by 90Y-antibody therapy often correlates poorly with marrow radiation dose estimated from 90Y in blood.
Two possible factors may account for the poor prediction of myelotoxicity using marrow dose estimated from 90Y in the blood. First, an unpredictable fraction of administered 111In/90Y can be recycled into marrow/trabecular bone space after 111In/ 90Y-antibodies have been metabolized, mainly in the liver. Second, a 1-size-fits-all model using the marrow mass of Reference Man for individual patients can introduce substantial error due to the large variation of actual marrow mass.
The purpose of this study was to address these 2 problems. Image quantification of lumbar vertebrae was used to determine recycled 111In/90Y in marrow/trabecular bone space after 111In/90Y-antibody was metabolized. Patient-specific marrow mass in the lumbar vertebrae was estimated by scaling the red marrow (RM) mass of Reference Man in lumbar vertebrae with trabecular bone volume of lumbar vertebrae determined from CT scans. We evaluated this image-based patient-specific marrow dosimetry method in patients with advanced non-small cell lung cancer, whose previous chemotherapies were less myelosuppressive than that commonly prescribed for patients with lymphoma.
MATERIALS AND METHODS
Patients
Thirty-three patients with TAG-72-expressing advanced non-small cell lung cancer were treated in a phase I study with 90Y-anti-TAG-72 murine antibody (CC49). The patients were 32–76 y old and 15 had prior chemotherapy, predominantly with carboplatin plus etoposide or paclitaxel. Six of these 15 patients had also received external beam radiation. Two patients received prior external beam radiation with no prior chemotherapy. All patients were at least 4 wk from prior therapies and had recovered from their effects. At baseline, there was no clinical or radiographic evidence of bone marrow compromise. Each patient received a single intravenous therapy dose of 90Y-CC49. The dose of 90Y-CC49 was escalated in sequential patient cohorts between 0.30 and 0.74 GBq/m2 (8–20 mCi/m2). 111In-CC49 was used as a tracer and was injected at the same time as 90Y-CC49. Hematologic toxicity was evaluated weekly for at least 6 wk and until blood counts recovered to the initial baseline.
All 33 patients had planar imaging that allowed marrow dose to be estimated from lumbar vertebrae uptake. Twenty-seven patients had adequate blood samples for marrow dose to be estimated from blood. Twenty patients had thoracic CT scans available for measuring trabecular bone volume of lumbar vertebrae.
Radiopharmaceutical
TAG-72 is often expressed in epithelium-derived tumors, including most colonic adenocarcinomas (2) and non-small cell lung carcinomas but not in normal marrow. The monoclonal antibody CC49, a high-affinity murine product that reacts against tumor-associated glycoprotein TAG-72, was radiolabeled using the (4-aminophenyl)ethyl-dodecanetetraacetic acid (PA-DOTA) chelator. Radiolabeling and quality control procedures were performed on the day of administration as described (3). Briefly, CC49 PA-DOTA was labeled to a specific activity of 0.19–0.56 GBq/mg (5–15 mCi/mg) for 90Y and 0.19–0.37 GBq/mg (5–10 mCi/mg) for 111In, respectively. High-performance liquid chromatographic analysis demonstrated no aggregates.
Pharmacokinetics and Marrow Dose Using Standard Method Based on Blood
For pharmacokinetics, serial blood samples (5 mL) were drawn immediately after infusion and at 2, 12, 24, 48, 72, and 168 h. Samples were allowed to clot and were spun; the serum was then separated. 111In concentration in the serum was assayed using a well counter. The data were fitted with a monoexponential clearance curve to determine cumulated radioactivity. Assuming identical cumulated 90Y and 111In in the plasma, 90Y-radiation dose to the RM was calculated using MIRD Pamphlet No. 11 data for the marrow mass of Reference Man (4). The cumulated 90Y in the RM, Ã RM, was determined as:
 Eq. 1 where Cplasma is the cumulated 90Y concentration in plasma, RMPLR is RM-to-plasma ratio based on an RM extracellular fluid fraction of 0.19, patient-specific hematocrit is implicitly used for RM-to-blood ratio (5), and mRM is RM mass of the Reference Man (1,500 g) as listed in MIRD Pamphlet No. 11 (4). Marrow dose was calculated as:
 Eq. 2 where DRM is the mean absorbed dose to RM. S(RM←RM) is the S value for RM to RM.
Quantitative Imaging of Lumbar Vertebrae and Marrow Dose with Reference Man’s Mass
The method for image data collection was similar to that reported previously (6). Whole-body images were acquired at 2, 20, 44, 68, and 144 h after 111In/ 90Y-CC49 injection. Images were acquired with a medium-energy collimator and 15% energy windows centered on the 171- and 243-keV photopeaks of 111In. The posterior view of the whole-body images was used to quantify lumbar vertebrae uptake because lumbar vertebrae were not clearly visualized on the anterior view of the images. 111In in the lumbar vertebrae was quantified using methods described by DeNardo et al. (7), Macey et al. (8), and Lim et al. (9). Because part of L1 and L5 often had tissue overlapping or significant scatter from adjacent organs with a relatively high 111In uptake, only L2–L4 were included in the marrow region of interest. An effective point source method (10,11) was used to determine 111In in lumbar vertebrae with a measured linear attenuation coefficient of 0.109 cm−1. The depth of the lumbar vertebrae from the posterior body surface was determined from CT images.
Cumulated radioactivity in L2–L4, ÃRM(L2–L4), was obtained by fitting the serial uptake data to a monoexponential clearance curve if uptake did not increase over time. If uptake increased over time, ÃRM(L2–L4) was determined by adding the area under the curve between 0 and 144 h and a tail assuming a constant uptake after 144 h. Assuming the RM in L2–L4 is equal to 6.7% of the total RM (9), the RM dose was determined as:
 Eq. 3 where S(RM←RM) is the S value of Reference Man obtained from MIRD Pamphlet No. 11 (4).
Patient-Specific Marrow Dose
Patient-specific marrow mass was estimated by measuring the trabecular volume of lumbar vertebrae from CT images acquired 1–3 wk before administration of 90Y-CC49. Assuming RM mass in lumbar vertebrae is proportional to the trabecular bone volume, RM mass in L2–L4 was determined by scaling the RM mass of Reference Man with the trabecular bone volume:
 Eq. 4 where V(trabe)L2–L4 patient is the patient’s trabecular volume of L2–L4 measured from CT scans. The number of CT slices containing V(trabe) was determined from scout images. The visual boundaries of trabecular bone in the lumbar vertebrae were clearly identified on CT images. The region of interest for V(trabe) on each slice was manually determined and multiplied by the slice thickness to obtain V(trabe) in each slice. Because the trabecular volume of L2–L4 for Reference Man was not listed in the publication (12), this value was estimated using the mean volume measured in 20 patients because the mean body weight, height, and body surface were very close to those of Reference Man (Table 1).
Interpatient Variation in Body Weight, Height, Surface Area, and Trabecular Bone Volume of Lumbar Vertebrae
Patient-specific 90Y S(RM←RM)patient was determined by:
 Eq. 5 where S(RM←RM)ref man was obtained from MIRD Pamphlet No. 11 (4), which is very close to the S value from the MIRDOSE3 program (13,14). Radiation dose to L2–L4 RM was determined by:
 Eq. 6 In the present retrospective analysis, most patients had thoracic CT scans that only included lumbar vertebrae L1–L3. Therefore, V(trabe) of L1–L3 was measured for all patients and V(trabe)L2–L4 was estimated from V(trabe)L1–L3 using a scaling factor (69.7 g/66.4 g = 1.049) derived from the Reference Man (12).
Correlation of Marrow Dose to Myelotoxicity
Because thrombocytopenia is often the dose-limiting factor for radionuclide therapy, platelet nadir expressed as percentage of the initial baseline (%) was selected as an indicator for myelotoxicity. Linear correlation was evaluated between the platelet nadir (%) and the marrow dose estimate using 1 of the following methods:
The standard method based on blood (Eq. 2),
Lumbar vertebrae imaging and S(RM←RM) of Reference Man (Eq. 3),
Lumbar vertebrae imaging and S(RM←RM) of Reference Man adjusted by body weight (Eq. 3):
 Eq. 7 where 70 kg is the body weight of Reference Man (12).
Lumbar vertebrae imaging and S(RM←RM) of Reference Man adjusted by body height (Eq. 3):
Eq. 8 where 170 cm is the height of Reference Man (12).Lumbar vertebrae imaging and S(RM←RM) of Reference Man adjusted by body surface area (BSA) (Eq. 3):
Eq. 9 where 1.8 m2 is the BSA of Reference Man (12).Lumbar vertebrae imaging and S(RM←RM) of Reference Man adjusted by lean body mass (Eq. 3):
Eq. 10 where LBM is lean body mass described as the maximum effective mass (15). LBMref man was lean body mass for Reference Man of 170-cm height.Lumbar vertebrae imaging with patient-specific lumbar vertebrae marrow mass (Eq. 6).


RESULTS
Marrow Dose Estimates
The mean value for patient body weight, height, or surface area was very close to the value of the Reference Man (Table 1). In individual patients, the deviation from the value of Reference Man was as great as 46.6% for body weight, 11.8% for body height, and 26.1% for BSA (n = 33).
Using the standard method based on blood radioactivity and the RM mass of Reference Man, the cumulated radioactivity in marrow contributed from blood ranged from 4,428 to 48,197 GBq·s/GBq (1,230–13,388 μ Ci·h/mCi) with a mean value of 22,270 GBq·s/GBq (6,186 μCi·h/mCi) (n = 27). The radiation dose per unit radioactivity ranged from 0.30 to 3.11 Gy/GBq (1.1–11.5 rad/mCi) with a mean value of 1.44 Gy/GBq (5.32 rad/mCi). For treatment doses of 0.46–1.65 GBq (12.5–44.5 mCi) 90Y-CC49, radiation doses to marrow ranged from 16 to 453 cGy.
Using the lumbar vertebrae imaging method and the RM mass of Reference Man, the distances between the center of trabecular bone in L2–L4 and the posterior body surface were measured in 20 patients who had thoracic CT images (Table 1). The derived attenuation correction factor for these 20 patients ranged from 2.02 to 3.20 with a mean value of 2.46. This mean attenuation correction factor of 2.46 was used for the remaining 13 patients whose CT images were not available. The cumulated radioactivity determined in the L2–L4 ranged from 1,681 to 4,878 GBq·s/GBq (467–1,355 μCi·h/mCi) with a mean value of 2,866 GBq·s/GBq (796 μCi·h/mCi) (n = 33). The marrow dose ranged from 1.6 to 4.7 Gy/GBq (6.0–17.4 rad/mCi) with a mean value of 2.8 Gy/GBq (10.2 rad/mCi) (n = 33). For treatment doses of 0.46–1.65 GBq (12.5–44.5 mCi) 90Y-CC49, the radiation dose to the marrow ranged from 156 to 378 cGy.
For calculating patient-specific radiation doses to the RM in L2–L4, the trabecular bone volumes of L1–L3 were measured in 20 patients with CT images (Table 1). The difference in L1–L3 trabecular bone volume among 20 patients was as large as 2.2-fold. The mean trabecular bone volume of L1–L3 was 67 mL, corresponding to a mean trabecular bone volume of 70.3 mL for L2–L4 (Table 1). Patient-specific radiation doses to the RM ranged from 1.3 to 5.3 Gy/GBq (4.9–19.8 rad/mCi) with a mean value of 2.7 Gy/GBq (10.2 rad/mCi) (n = 20). For the treatment dose of 0.46–1.65 GBq (12.5–44.5 mCi) 90Y-CC49, the radiation dose estimate ranged from 146 to 370 cGy.
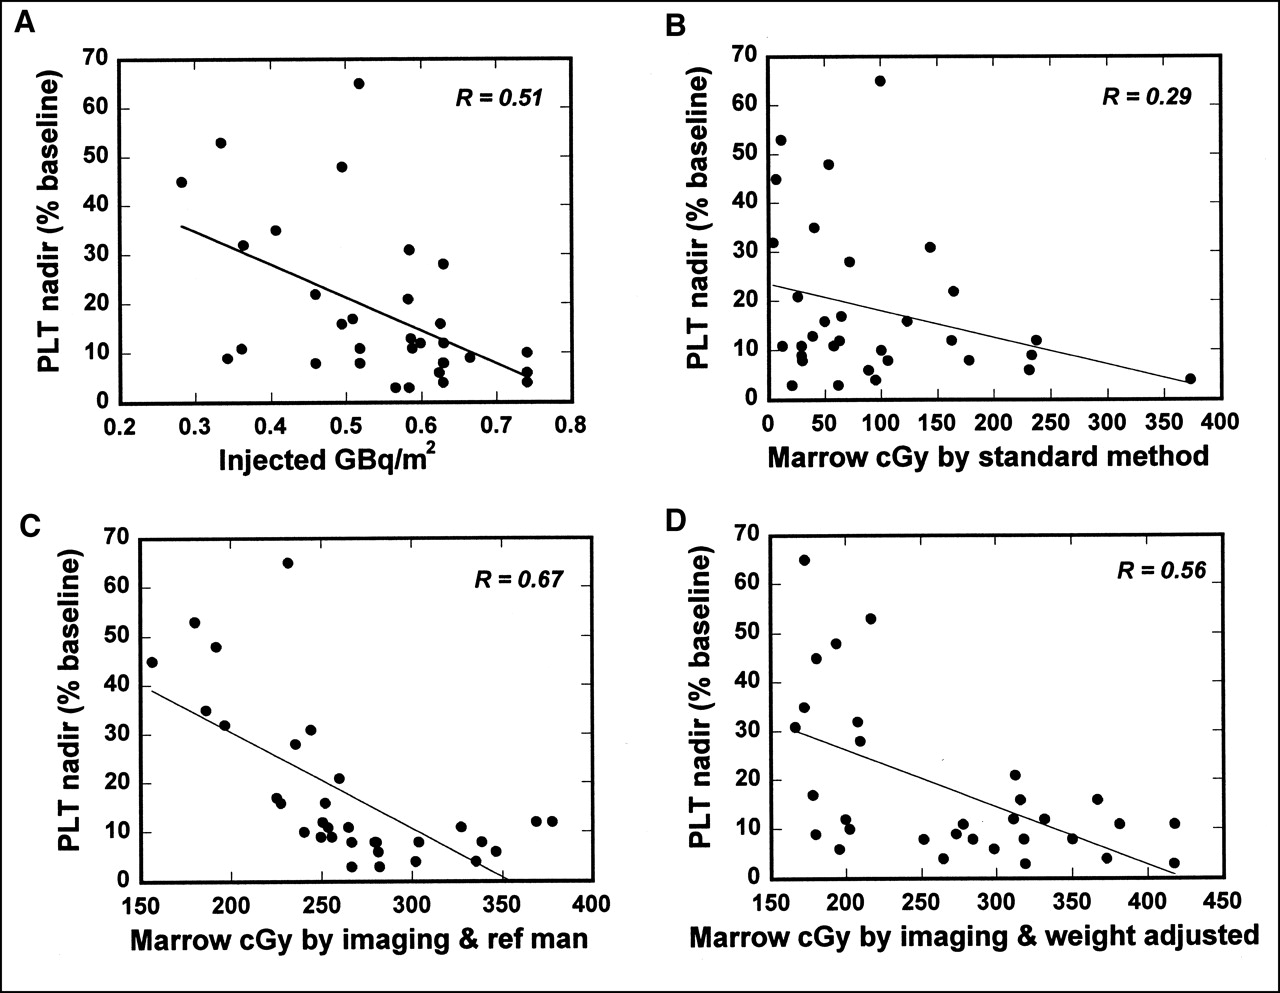
The mean radiation dose from the standard method based on blood was substantially lower than that of the other 6 methods based on lumbar vertebrae imaging. (Table 2). Many dose estimates from the standard method based on blood were relatively low considering the observed thrombocytopenia (Fig. 1B). The mean and range of marrow dose were similar between the total group of 33 patients and the subgroup of 20 patients who had CT images (Table 2).

Correlation between platelet (PLT) nadir (% of baseline) and various marrow radiation dose predictors. These predictors are injected GBq/m2 (n = 33) (A), standard marrow dose based on blood (n = 27) (B), marrow dose estimated from lumbar vertebrae imaging and marrow mass of Reference Man (n = 33) (C), and marrow dose estimated from lumbar vertebrae imaging and marrow mass of Reference Man adjusted by body weight (n = 33) (D).
Mean (Range) Marrow Radiation Doses Estimated Using 7 Methods
Correlation of Marrow Dose to Myelotoxicity
The correlation coefficients between marrow doses and platelet nadir (%) were slightly different between the total 33 patients and the subgroup of 20 patients with CT images (Table 3; Figs. 1 and 2). However, the directions for improved correlation among various methods were fairly consistent. The exception was the correlation of lumbar vertebrae imaging with the RM mass of Reference Man adjusted by BSA or by lean body mass (Table 3). Correlation between the standard dosimetry and platelet nadir (%) was poorer than that from GBq/m2 (mCi/ m2). The correlation coefficient was twice as high using lumbar vertebrae imaging and the RM mass of Reference Man compared with that using the standard method. The correlation was further improved if the RM mass of Reference Man was adjusted by patient height. In contrast, correlation became poorer if the RM mass of Reference Man was adjusted by patient weight (Table 3).

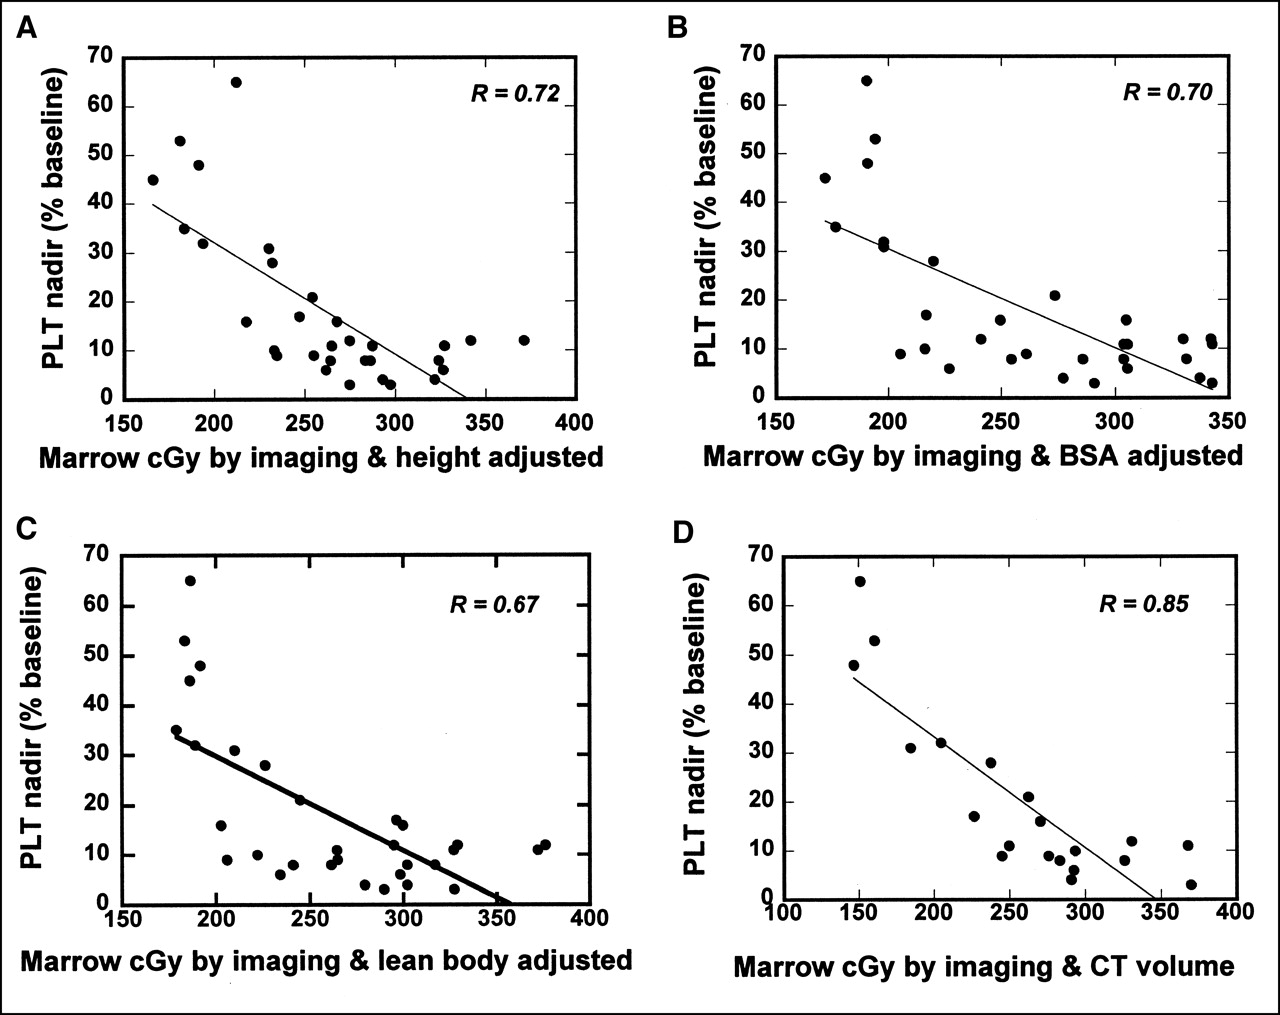
Correlation between platelet (PLT) nadir (% of baseline) and various marrow radiation dose predictors. These predictors were marrow dose estimated from lumbar vertebrae imaging and marrow mass of Reference Man adjusted by body height (n = 33) (A), marrow dose estimated from lumbar vertebrae imaging and marrow mass of Reference Man adjusted by BSA (n = 33) (B), marrow dose estimated from lumbar vertebrae imaging and marrow mass of Reference Man adjusted by lean body mass (n = 33) (C), and marrow dose estimated from lumbar vertebrae imaging and lumbar vertebrae marrow mass adjusted by trabecular bone volume from CT (n = 20) (D).
Correlation Between Platelet Nadir (% of Baseline) and Marrow Radiation Dose Predictors
The best correlation (r = 0.85) between marrow dose and platelet toxicity was found with lumbar vertebrae imaging and patient-specific L2–L4 marrow mass. The relation between RM dose and platelet nadir as percentage of baseline can be converted to a relation between the dose to produce platelet nadir (kilocounts/microliter [kcts/μL]) or toxicity grade by curve fitting with the percentage platelet decline to nadir. The percentage platelet decline could be fitted with e−α (D−D0) according to radiobiologic models (Fig. 3A). The predicted platelet nadir (kcts/μL) was obtained using the initial baseline counts and fitting to the percentage platelet decline. Good correlation was found between the predicted nadir and the actual nadir or predicted toxicity grade and the actual toxicity grade (Figs. 3B and 3C; Table 4).

Prediction of platelet (PLT) nadir and toxicity grade using relationship between marrow dose and PLT nadir (% of baseline). (A) Figure 2D fitted by curve e−α(D− D0). (B) Correlation between actual PLT nadir and predicted PLT nadir. (C) Correlation between actual toxicity grade and predicted toxicity grade in 20 patients. Many data points are overlapped on plot.
Actual Toxicity Grade and Predicted Toxicity Grade for 20 Patients Using Marrow Dose Estimated by Lumbar Vertebrae Imaging and Adjusted by CT Trabecular Bone Volume
Better prediction using trabecular bone volume suggested that trabecular bone volume could be a more relevant parameter for the RM mass. Comparing the relationship between trabecular bone volume and other parameters, correlation was relatively high between trabecular bone volume and body height or mean body mass (r = 0.56) compared with body weight (r = 0.34) in 33 patients (Fig. 4).
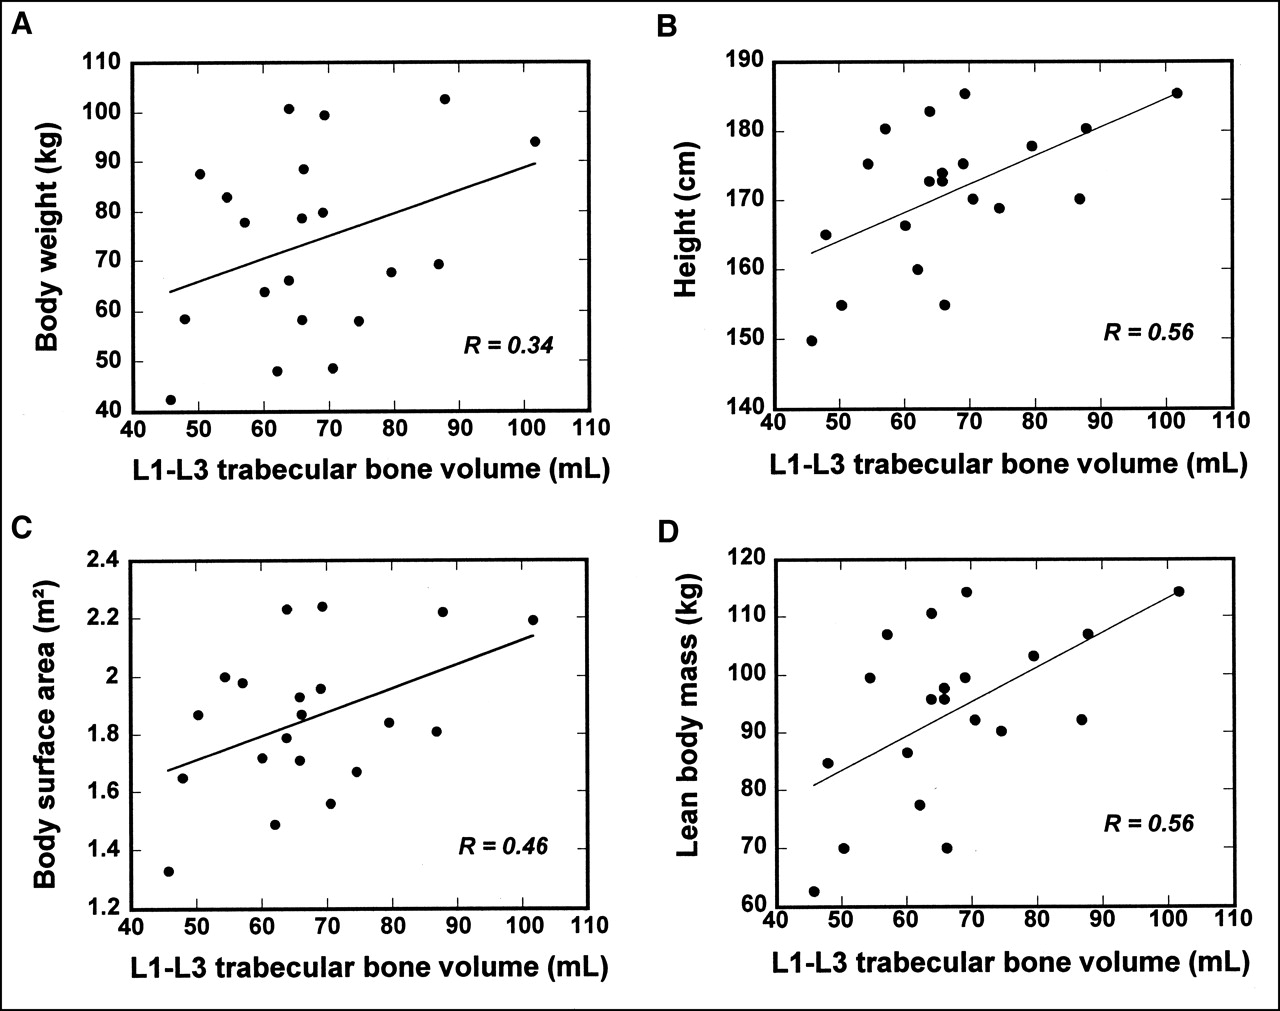
Correlation between L1–L3 trabecular bone volume and body weight (A), body height (B), BSA (C), and lean body mass (D) in 20 patients who had CT images.
DISCUSSION
The search for correlation between myelotoxicity and various predictors (such as GBq/m2), total body dose, marrow radiation dose) has been of high interest. Conceptually, marrow radiation dose estimate is a more reasonable predictor compared with GBq/m2 or total body dose. However, correlation between myelotoxicity and marrow radiation dose estimates has generally been weak (9,17–20). The weak association between the standard marrow dose based on blood and myelotoxicity became more prominent in clinical trials with 111In/90Y-antibody (21). Consequently, radiation dosimetry has not proven to be useful for planning the treatment dose for 111In/ 90Y-antibodies.
This study focused on 2 factors that may influence the poor prediction of myelotoxicity from 90Y-antibody therapy using the standard method based on blood. First, free 111In/90Y or 111In/90Y-cheletor can be recycled into marrow/ trabecular bone space after 111In/90Y-antibodies have been metabolized in the liver. This was reflected by the fact that the lumbar vertebrae were clearly visualized after 111In-CC49 in lung cancer patients but not after 131I-CC49 in prostate cancer patients (6). This was also reflected by the observation that 17 of the 33 patients in this study had increasing 111In uptake in lumbar vertebrae over time. In the remaining 16 patients, the effective half-life of 111In uptake in lumbar vertebrae was close to that of the physical half-life of 111In. Although it is possible to have small deposits of tumor cells in the marrow that are undetected by biopsy and radiographic imaging, it is unlikely that such a large uptake of 111In as was often observed was due to these small deposits of tumor cells. Because radioactivity in the blood of the marrow was only a part of the total activity in the marrow, the assumption of nonspecific marrow uptake implied by the standard blood method (1) may be invalid for the 111In/ 90Y-antibodies. The key is whether radiopharmaceuticals have localization that affects marrow radiation. In most 111In/ 90Y-antibodies studies, 111In was visualized in marrow even when the antibodies were non-marrow binding. In pretargeted NR-Lu-10/ streptavidin, where 111In was not visible in marrow, the standard blood method worked well for predicting 90Y-induced toxicity (r = 0.77) (22).
The second factor assessed in this study was individualized marrow mass. One of the major challenges in developing patient-specific marrow dosimetry has been the determination of RM mass for individual patients. For radiopharmaceuticals that do not show specific uptake in marrow or bone, patient-specific marrow dosimetry can be practically determined without knowledge of the actual marrow mass (23). However, for radiopharmaceuticals that are clearly visualized in marrow/trabecular bone, determination of the actual marrow mass of individual patients becomes necessary (24). Although MRI combined with spectroscopy has potential as a method to determine RM mass, it is not routinely used. One practical approach for patient-specific marrow mass is to adjust the reference RM mass by some patient-specific parameter(s). In our analysis, prediction of platelet toxicity became worse if the marrow mass of Reference Man was adjusted by patient body weight (Table 3; Figs. 1 and 2). The correlation consistently improved if the reference RM mass was adjusted by height or trabecular bone volume. The best correlation (r = 0.85) was obtained with trabecular bone volume adjustment, suggesting trabecular bone volume could be a more relevant parameter. The variation in trabecular bone volume measured among 20 patients was as large as a factor of 2.2.
The underlying assumptions of using L2–L4 trabecular bone volume to scale Reference Man’s RM mass are (a) that the marrow mass is proportional to the trabecular bone volume and (b) that a scaling factor of 0.067 can be used to convert S(RM←RM)total to S(RM←RM)L2–L4, assuming regional activity concentration in L2–L4 marrow represents mean activity concentration in total marrow. These assumptions could be problematic if patients have marrow involved with cancer. This is because (a) “ healthy” RM mass may not correlate with trabecular bone volume and (b) radioactivity concentration in L2–L4 may not correlate with mean radioactivity concentration in the total RM depending on distribution of the diseases. Nevertheless, these particular patients can only be dealt with on a case-by-case basis. To minimize these problems in this study, we chose a patient population with no clinical or radiographic evidence of bone marrow involvement. In this study, lumbar vertebrae were quantified because they were visualized in all patients and these sites represent a rich source of marrow. Marrow uptake can also be estimated using other sites such as the sacral vertebrae (25). A constant scaling factor (such as 0.067) can be avoided if the total skeleton can be quantified. However, clinical application of this can be limited by intensive labor in quantifying the total skeleton and its accuracy in skeletal areas with a small amount of marrow. Nevertheless, further research is needed to address these concerns.
Compared with counting blood activity, imaging quantification has its own challenges: accuracy in image quantification and accuracy in extrapolation of 90Y in marrow from imaging of 111In. Using the proper calibration for camera sensitivity, attenuation correction, and background subtraction, image quantification error can be controlled within 15% for clearly visualized source objects (26,27). By comparing biodistribution and PET imaging in mice, the difference in bone uptake of 86Y-antibody and 111In-antibody was <10% at 2 d after injection and 20% at 4 d after injection (28). The difference in cumulated 90Y and 111In in bone could be <15% on the basis of these murine data and the effective half-life observed in our patients. The improved prediction by imaging in this analysis suggested that these errors introduced by imaging methods have less uncertainty than that of using the blood method.
By selecting a patient population without a significant impact of marrow involvement and previous myelosuppressive chemotherapies, this study was able to focus on 2 major factors associated with the poor prediction of myelotoxicity from 90Y-antibody therapy using the standard method based on blood radioactivity. The improved prediction may not be obtained if this imaging method is simply applied to other patient populations, especially lymphoma patients with marrow involvement and patients heavily pretreated with myelosuppressive chemotherapies. Previous external beam radiation can also suppress functional marrow in treatment fields. This may not be a problem in this study because uniform marrow uptakes were observed in all 8 patients who had prior external beam radiation. Although problems such as marrow involvement and previous chemotherapy are beyond the scope of imaging and radiation physics, further research is needed to address these biologic problems, such as use of plasma FLT3-L levels as a marker for progenitor cell recovery, as reported recently by Blumenthal et al. (29).
CONCLUSION
Marrow dose based on blood radioactivity does not serve as a good predictor of hematologic toxicity for non-marrow-targeting 90Y-antibody therapy. Prediction of thrombocytopenia was much improved using lumbar vertebrae imaging and patient-specific L2–L4 RM mass, suggesting that this method can account for 111In/90Y recycled into marrow/ trabecular bone space and variation in patient RM mass. Because the prediction of toxicity was improved compared with that using GBq/m2, this method can be of potential use in planning administration doses for non-marrow-targeting 111In/90Y-antibody therapy.
Acknowledgments
The authors thank Gayle Elliot, BS, for her great technical support. This work was supported in part by grants from the National Cancer Institute (CM87215) and the National Health Institution (MO1, RR00032). This work was presented at the 48th Annual Meeting of the Society of Nuclear Medicine, Toronto, Ontario, Canada, June 23–27, 2001.
Footnotes
Received Oct. 11, 2001; revision accepted May 13, 2002.
For correspondence or reprints contact: Sui Shen, PhD, Department of Radiation Oncology, University of Alabama at Birmingham, 619 19th St. S., WTI 124, Birmingham, AL 35249.
E-mail: sshen{at}uabmc.edu
REFERENCES
In this issue


Jump to section
Related Articles
Cited By...
- Biokinetics and Dosimetry of 177Lu-Pentixather
- Red Marrow-Absorbed Dose for Non-Hodgkin Lymphoma Patients Treated with 177Lu-Lilotomab Satetraxetan, a Novel Anti-CD37 Antibody-Radionuclide Conjugate
- RADAR Commentary: Evolution and Current Status of Dosimetry in Nuclear Medicine
- A Method to Correct for Radioactivity in Large Vessels That Overlap the Spine in Imaging-Based Marrow Dosimetry of Lumbar Vertebrae
- High-Dose Radioimmunotherapy with 90Y-Ibritumomab Tiuxetan: Comparative Dosimetric Study for Tailored Treatment
- Mass Scaling of S Values for Blood-Based Estimation of Red Marrow Absorbed Dose: The Quest for an Appropriate Method
- Linear Regression Model for Predicting Patient-Specific Total Skeletal Spongiosa Volume for Use in Molecular Radiotherapy Dosimetry
- Planning Time for Peripheral Blood Stem Cell Infusion After High-Dose Targeted Radionuclide Therapy Using Dosimetry
- Prediction of Myelotoxicity Based on Bone Marrow Radiation-Absorbed Dose: Radioimmunotherapy Studies Using 90Y- and 177Lu-Labeled J591 Antibodies Specific for Prostate-Specific Membrane Antigen
- Blood and Bone Marrow Dosimetry in Radioiodine Therapy of Differentiated Thyroid Cancer After Stimulation with rhTSH
- Patient-Specific Dosimetry of Pretargeted Radioimmunotherapy Using CC49 Fusion Protein in Patients with Gastrointestinal Malignancies
- Radioimmunotherapy of Non-Hodgkin's Lymphoma Revisited
- Practical Dosimetry of Peptide Receptor Radionuclide Therapy with 90Y-Labeled Somatostatin Analogs
- Bone Marrow Dosimetry Using Blood-Based Models for Radiolabeled Antibody Therapy: A Multiinstitutional Comparison
- Bone Marrow Dosimetry and Safety of High 131I Activities Given After Recombinant Human Thyroid-Stimulating Hormone to Treat Metastatic Differentiated Thyroid Cancer