


Abstract
In whole-body PET, it is not unusual to shorten the study time by omitting the transmission scan and to ignore attenuation during reconstruction. If a transmission scan is available, many centers reconstruct the images with, but also without, attenuation correction. Although ignoring attenuation leads to an artifact in the reconstructed images, these images still provide valuable diagnostic information in oncologic applications. Several authors have reported that the attenuation artifact may actually increase the tumor-to-background ratio. In this study, we analyzed the causes of the artifact and proposed a new algorithm to reduce the adverse effects on visual image quality. Methods: We analyzed the causes of the attenuation artifact mathematically and numerically, and we examined its effect on tumor-to-background ratio and on signal-to-noise ratio. In addition, we showed that the attenuation artifact may lead to loss of image detail in conventional maximum-likelihood expectation maximization (MLEM) reconstruction. A new maximum-likelihood algorithm allowing negative reconstruction values (NEG-ML) was derived to reduce this loss. Results: The attenuation artifact consists of 2 components. The first component is the well-known scaling effect: The apparent activity is reduced because attenuation decreases the fraction of detected photons. The second component is a relatively smooth negative contribution that is added to attenuated regions surrounded by activity. The second component tends to increase the tumor-to-background ratio. However, a simulation experiment shows that this increase in signal may be entirely offset by an increase in noise. The negative contribution can interfere with the nonnegativity constraint of the MLEM algorithm, leading to loss of image detail in regions of high attenuation. The new NEG-ML algorithm avoids the problem by allowing negative pixel values. The algorithm is similar to MLEM in the suppression of the streak artifact but provides more anatomic information. In our department, it is in routine clinical use for reconstruction of PET whole-body images without attenuation correction. Conclusion: Ignoring attenuation may increase the tumor-to-background ratio, but this increase does not imply improved tumor detection. The NEG-ML algorithm reduces the adverse effect of the attenuation artifact on visual image quality.
Oncologic application of 18F-FDG PET is increasing. Often, a PET scan is acquired over a large part of the body for detection of possible unknown metastases. Currently, these so-called whole-body studies are sometimes done without a transmission scan and the images are reconstructed without attenuation correction. Until recently, the transmission scan had to be obtained before injection, whereas the emission scan was acquired approximately an hour after injection; the transmission scan therefore increased the total study time by more than an hour. Since the introduction of postinjection transmission scanning protocols, attenuation correction requires only a moderate increase in scanning time. However, the effect on visual image quality is controversial (1–3), and in many centers, the images are reconstructed both with and without attenuation correction if a transmission scan is available.
In this article, we present an analysis of the artifact caused by ignoring photon attenuation during reconstruction. The analysis reveals that the attenuation artifact produces not only a scaling effect (apparent decrease in tracer uptake because of photon elimination) but also an additive effect. Negative values are added to regions where attenuation is not negligible and that are surrounded by activity. Consequently, for 18F-FDG PET studies, the effect is present nearly everywhere but is most significant near the center of the patient’s body. The effect of the negative counts is somewhat similar to that of background subtraction (often applied in planar scintigraphy) and produces an apparent increase in tumor-to-background ratio. This increase has been observed by several groups (1,4,5).
We also show that the nonnegativity constraint of the classic maximum-likelihood expectation maximization algorithm (MLEM) may interfere with the artifact, causing a loss of information. We propose a new maximum-likelihood algorithm that allows negative reconstruction values, to minimize the decrease in image quality caused by this additive artifact. This article is organized as follows. One section presents an intuitive interpretation of the attenuation artifact, which is confirmed by mathematic analysis. In another section, the new maximum-likelihood algorithm is derived. A following section describes a simulation experiment that verifies the predicted increase in object-to-background ratio caused by the attenuation artifact and illustrates the effect on the signal-to-noise ratio. The results of the experiment and some clinical examples are presented and discussed in the final sections. Technical details are described in appendices.
MATERIALS AND METHODS
Theory
When no attenuation correction is applied during reconstruction of PET images, a typical and complex artifact is introduced. We will refer to this as the attenuation artifact. We show here that the artifact consists of 2 different effects. The first effect is the well-known scaling effect: Attenuation eliminates a fraction of the photons, resulting in an underestimation of the actual activity. The factor by which the value is underestimated is roughly proportional to the mean attenuation factor (obtained by averaging over all projection angles). The second effect is more subtle (6,7). In this section we present an intuitive explanation based on a simple thought experiment. A more accurate mathematic analysis is given in Appendix A.
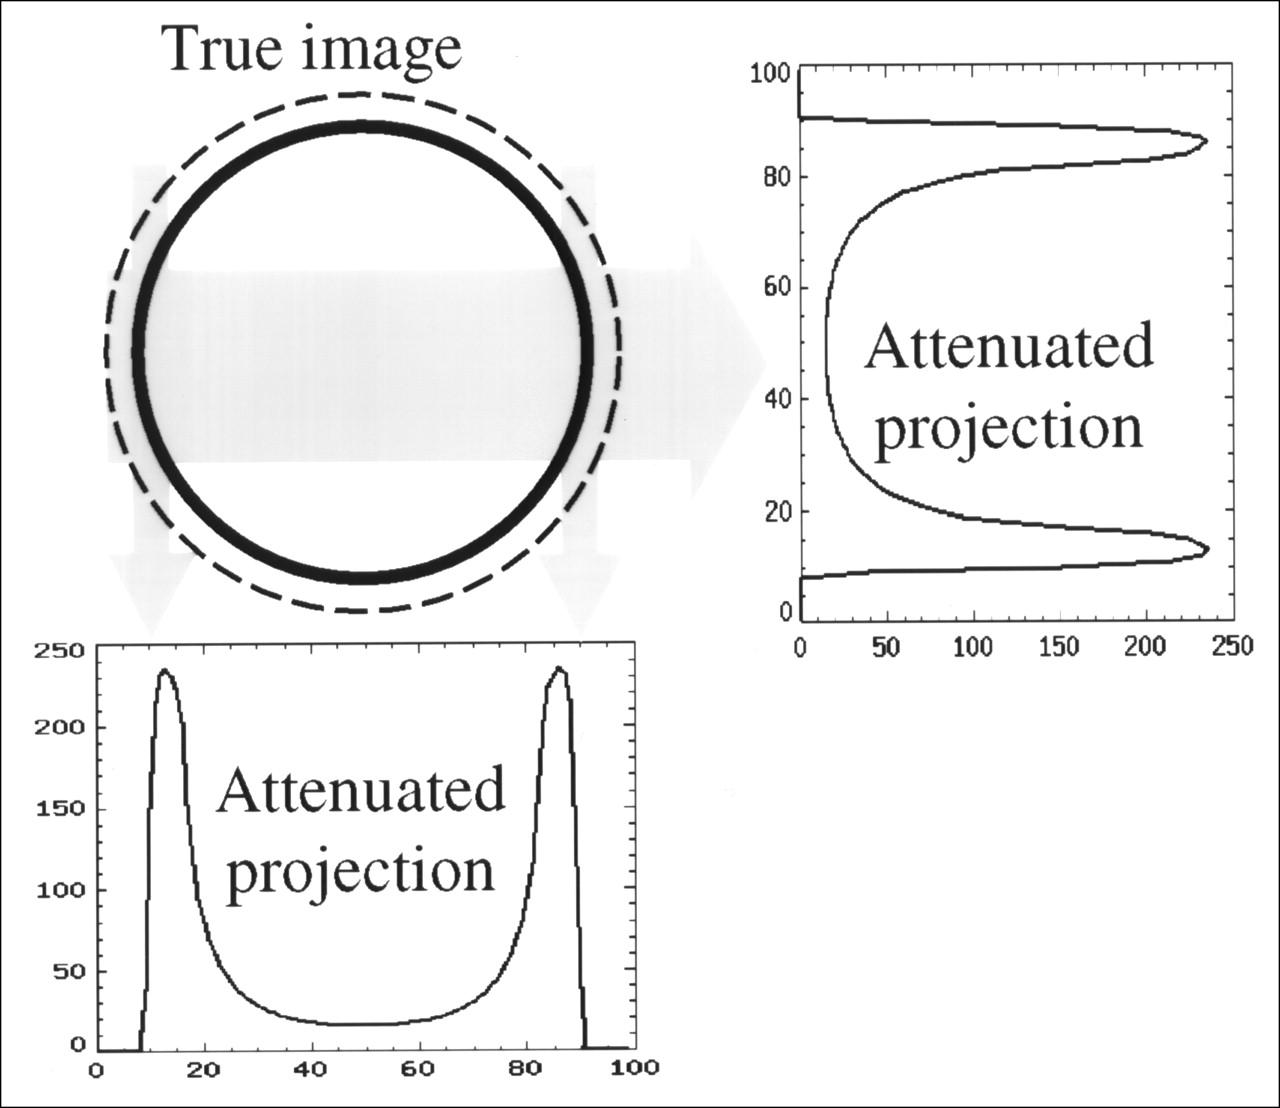
Figure 1 represents a simple test object. It consists of a radioactive ring, which is positioned concentrically in a homogeneously attenuating cylinder. The object is perfectly circularly symmetric, so in the absence of noise, projections acquired at different angles are identical. Now consider the central projection, represented by the thick shaded arrow in Figure 1. Because of attenuation, the total count obtained from the activity in the shaded area is relatively low. The same activity also contributes to a projection at 90°, represented by the 2 thin arrows in the figure. The projection is now tangential, and attenuation is much smaller. Consequently, the same activity now produces a much higher count.

Radioactive ring in uniform attenuating disk. Dashed circle represents boundary of uniform attenuation. Bold circle represents radioactive ring. Because of attenuation, projection through center (thick arrow) contains fewer counts than do 2 tangential projections (2 thin arrows), although same activity is projected.
If no attenuation correction is applied, the reconstruction program must design an object in such a way that central projections of the same activity produce fewer counts. The solution is to put negative activity in the center of the ring. This negative activity does not contribute in tangential projections, but in central projections, it cancels part of the contribution from the ring, reducing the count as required. Negative activity has no physical meaning, but the mathematics do not care about that.
Figure 2 confirms the analysis. Attenuated projections of the test object were simulated and reconstructed with filtered backprojection (FBP) without attenuation correction. The central profile reveals that the reconstructed activity within the ring is negative. Note that this reconstruction is exact, in the sense that reprojection without attenuation reproduces the original projections with excellent accuracy. The analysis in Appendix A and in (7) confirms that the exact solution is negative everywhere within the radioactive ring.
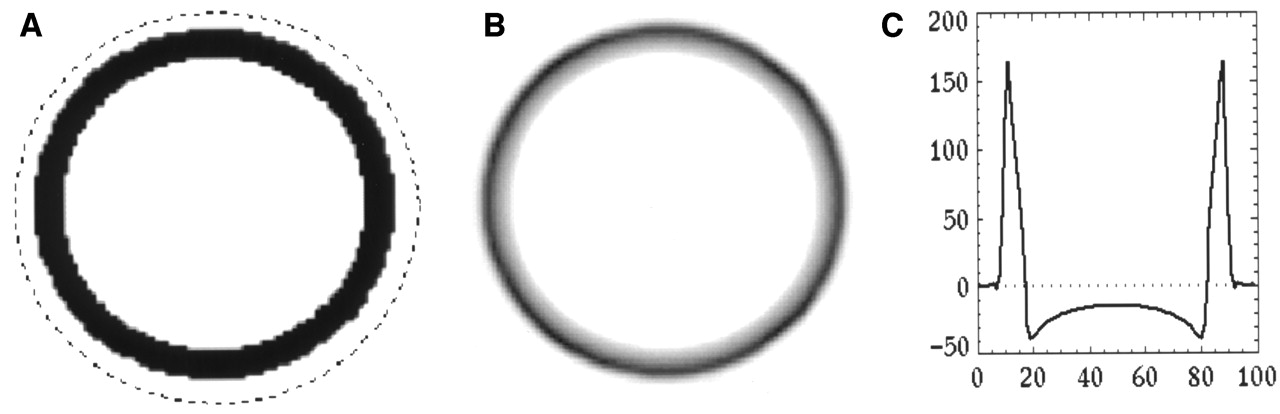
(A) Original activity distribution, with dotted circle indicating attenuating disk. (B) Reconstruction without attenuation correction from attenuated projections. (C) Profile through center of reconstruction image.
The highly symmetric object of Figure 1 allows exact mathematic analysis, but the same effect occurs in more complex objects: In non-attenuation-corrected PET images, pixel values receive a negative contribution from surrounding activity. The negative values mimic the effect of attenuation. A useful, though imprecise, interpretation is to see the negative value in each pixel in the ring as an estimate of the amount of photons attenuated by that pixel during the acquisition. Consequently, in more complex objects, the reconstructed value Pj for pixel j approximately equals:
 Eq. 1 where Tj represents the true pixel value of j, mj represents the underestimation (the scaling component) caused by attenuation of photons emitted in j, and aj is the estimate of the number of photons emitted by surrounding activity and attenuated in j. The effect of the additive component aj on the contrast is discussed in the next section.
Independently, Bai et al. (8,9) have obtained a similar result by analyzing the behavior of FBP. They proceed by constructing a software phantom for which aj is equal to mjTj for a dense object in the lungs. Thus, they show that failure to correct for attenuation may hide dense objects with moderate tracer uptake in the lungs. Here, we will discuss the effect on the contrast and detectability of tumors in regions of high attenuation and possible loss of information caused by the nonnegativity constraint in the MLEM algorithm.
Contrast.
Several groups have reported that the tumor-to-background ratio is often higher in non-attenuation-corrected images (1,4,5). The approximate equation (Eq. 1) can be used to predict the effect of the attenuation artifact on tumor-to-background ratio. We assume a tumor activity of T and a background activity of B, with T > B. We also assume that mj and aj are varying slowly with position and can be treated as (positive) constants near the tumor and that mB − a > 0. Then, we obtain for the reconstructed contrast R:
 Eq. 2 where T/B is the true tumor-to-background ratio. The additive component behaves as a background subtraction, increasing the contrast. The difference between tumor count and background count can be regarded as the signal. To assess the effect on tumor detection, it is necessary to study the noise as well. We have performed a simulation experiment to evaluate the effect of the attenuation artifact on the signal-to-noise ratio in a simple object.
Negative Values.
In large patients, the additive component of the attenuation artifact can make entire regions negative. But these regions may still contain useful visual information, superimposed on the additive component. In clinical applications, FBP often produces negative pixel values in regions where attenuation was important. However, FBP is sensitive to noise and tends to produce a disturbing streak artifact. In contrast, MLEM is more robust against noise but has a built-in nonnegativity constraint. When used with attenuation correction, this is an obvious strength, but if no attenuation correction is included, the constraint becomes a weakness and highly attenuated regions are reconstructed as uniform regions with (nearly) zero tracer uptake. As a result, useful image detail may be lost.
The NEG-ML Algorithm
The MLEM algorithm can be regarded as a scaled gradient ascent algorithm, in which the step size is scaled such that it prevents negative values (10). In Appendix B, an alternative step size is derived, allowing the inclusion of negative values while preserving the desirable features of the MLEM algorithm. The new algorithm, called NEG-ML, can be written as:


 Eq. 3 Here, yi is the measured count in detector i, λ j is the new estimate of activity in pixel j, cij is the assumed detection probability (ignoring attenuation), and the prime indicates the reconstruction available at the current iteration. The computation burden of this algorithm is identical to that of MLEM. The derivation of the algorithm is based on the following 3-step scheme: First, in every iteration, the likelihood is approximated by a quadratic function. Second, the concavity of this quadratic function is exploited to obtain a surrogate function with separated variables. Third, in every iteration, the surrogate function is maximized. This step is guaranteed to increase the value of the quadratic approximation. Assuming that the approximation is good, the likelihood value should increase as well. This approach is related to (and inspired by) the one proposed by Fessler et al. (11) for transmission tomography.
Simulation Experiment
As argued above, elimination of the attenuation correction may increase the object-to-background ratio. Some authors have suggested that this increase would indicate improved tumor detection. We have performed a simple simulation experiment to illustrate the effect of the artifact on both the tumor-to-background ratio and the signal-to-noise ratio. We have assumed that the signal detected by the observer is proportional to the difference between object and background. Because the signal detection performance of an observer depends on the signal-to-noise ratio (12), we have also computed the noise using multiple noise realizations.
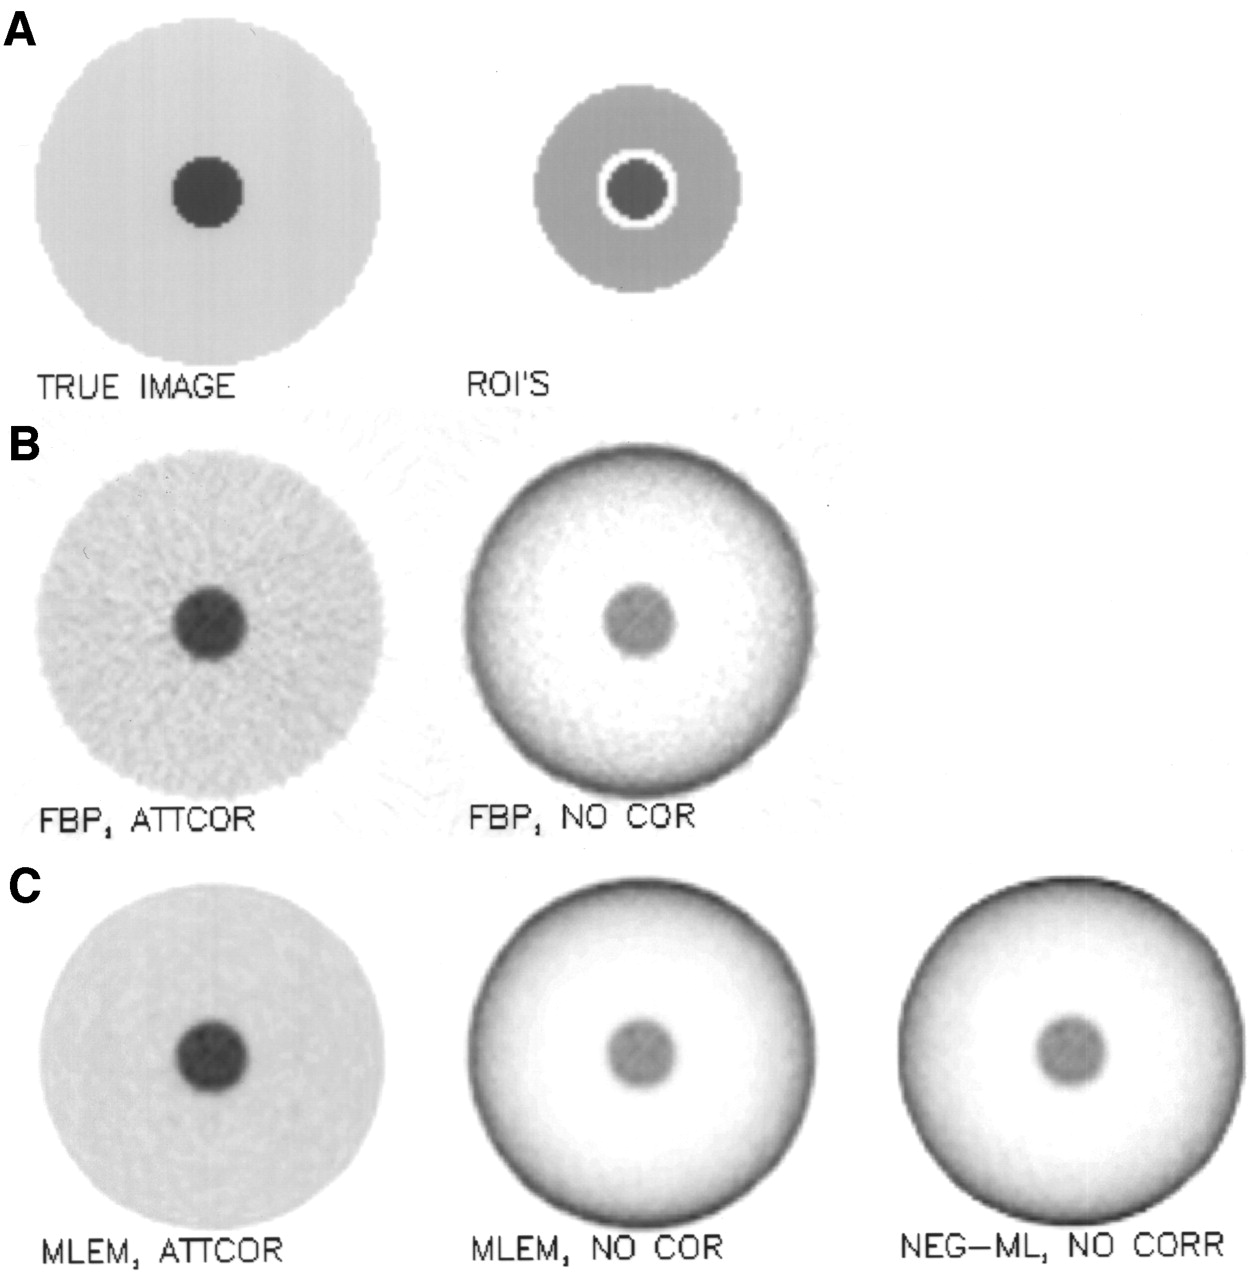
The simulated object (Fig. 3) consists of a uniformly attenuating disk (the background), with a small disk in the center (the object). The small disk has the same attenuation coefficient but a higher activity. The object-to-background activity ratio was 5. The image size was 100 × 100, the linear attenuation coefficient was 0.095 per centimeter, and the pixel size was 3.7 mm. The radii of the 2 concentric disks were 8 and 40 pixels.

Tumor detection simulation experiment. (A) True image and regions (ROIs) used to compute object and background tracer uptake. (B) FBP reconstructions with (ATTCOR) and without (NO COR) attenuation correction. (C) MLEM with and without attenuation correction and NEG-ML without attenuation correction.
Attenuated sinograms (100 projection angles over 180°) were computed and scaled to a different total count of 0.4, 0.8, 1.6, and 3.2 million. For each of those, 600 Poisson noise realizations were computed. Each noisy sinogram was reconstructed with FBP and with MLEM, once with and once without attenuation correction. FBP was done with a ramp filter. For the MLEM reconstruction with attenuation correction, the attenuation coefficients were included in the detection probabilities. In both cases, the reconstruction was stopped after 30 iterations (a typical value in clinical applications), and no smoothing was applied afterward. Also, for comparison, the reconstructions without attenuation correction were computed with NEG-ML, using 30 iterations.
Two regions of interest (ROIs) were defined. The object ROI was a circular region at the center, with a radius of 7 pixels (containing all object pixels except those near the boundary). The background ROI was an annulus positioned around the center; inner radius was 10 pixels, and outer radius was 24 pixels. For each reconstruction, the signal value was computed as the difference between the mean activity in the object ROI and the mean in the background ROI. The noise value was estimated as the SD on the signal value, computed from the 600 noise realizations. The signal-to-noise ratio was computed by dividing the signal value by the noise value. Computing the signal using the mean values of extended regions represents a strong smoothing operation. This is why there was no need to apply a low-pass filter during or after reconstruction.
RESULTS
Simulation Experiment
The results of the simulation experiment are shown in Table 1. When attenuation correction was applied, reconstruction with both FBP and MLEM resulted in excellent recovery of the true object-to-background ratio of 5. Ignoring attenuation during reconstruction increased the apparent ratio with a factor of 3. For both algorithms and all count levels, the signal-to-noise ratio decreased slightly when attenuation was ignored. This indicates that the attenuation artifact has no beneficial effect on tumor detection.
Object-to-Background Ratio and SNR for Simulations with 0.4, 0.8, 1.6, and 3.2 Million Counts
Clinical Examples
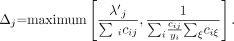
In a short pilot study, 57 patient studies were reconstructed with FBP, MLEM, and NEG-ML and the images were compared during the clinical diagnostic protocol. The physicians found that the NEG-ML algorithm is a good compromise between FBP and MLEM: Recovery of anatomic detail was similar to that of FBP, whereas noise characteristics and artifact suppression were similar to those of MLEM. These findings are illustrated in Figure 4, which compares the FBP, MLEM, and NEG-ML reconstructions for a patient study.
PET study of 10 bed positions, 4 mm per bed position, on ECAT 931 (CTI, Knoxville, TN/Siemens Medical Systems, Inc., Hoffman Estates, IL). (A) FBP reconstruction. (B) MLEM reconstruction. (C) NEG-ML reconstruction.
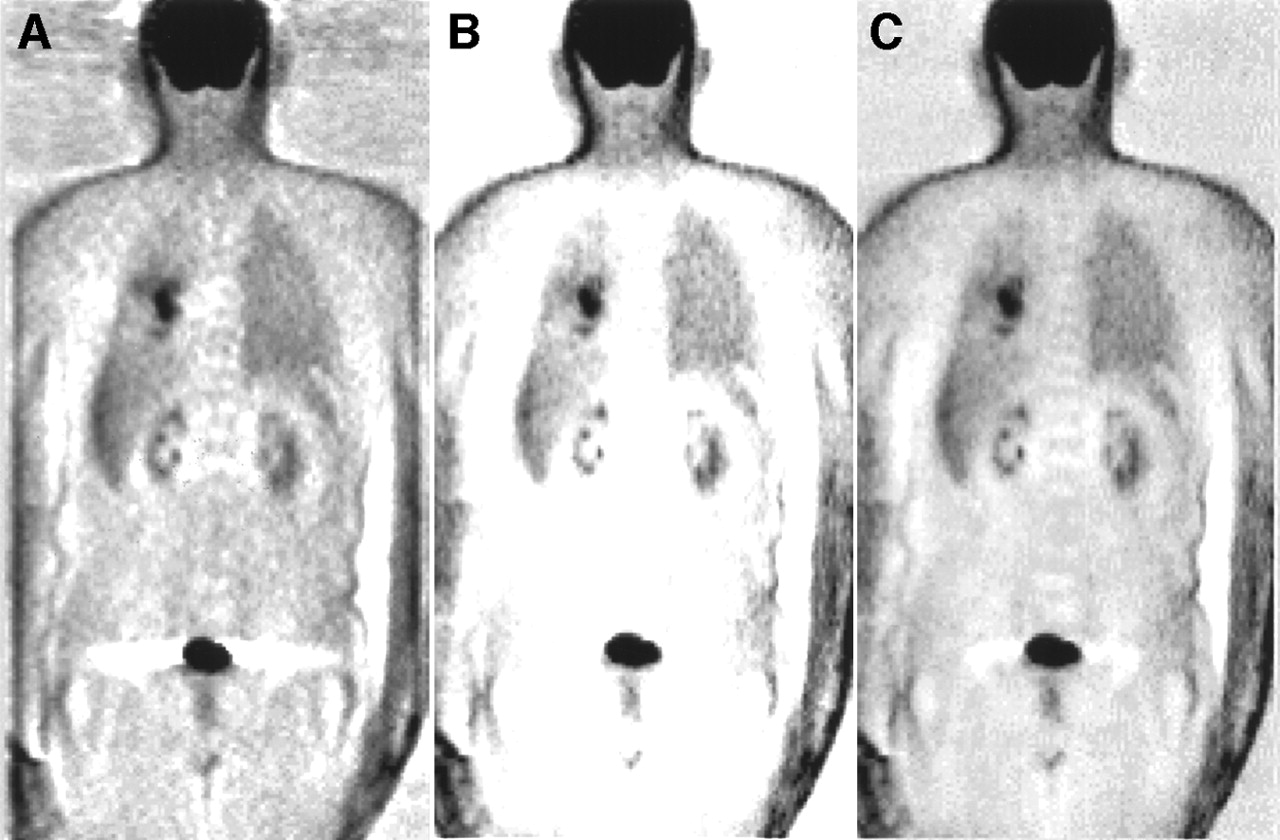
Figure 5 compares MLEM and NEG-ML coronal slices for a study with normal findings, illustrating the improved outline of the body and the spine when negative pixel values are allowed. Since its introduction to routine clinical use, the method has been applied to a few thousand studies. No convergence problems were ever noted.
PET study of 7 bed positions, 5 mm per bed position, on ECAT HR+ (CTI, Knoxville, TN/Siemens Medical Systems, Inc., Hoffman Estates, IL). (A) MLEM reconstruction. (B) NEG-ML reconstruction. Four consecutive coronal slices are shown, from anterior toward posterior, and indicate normal findings.
DISCUSSION
The simulation experiment confirms the theoretic analysis and shows that the reconstruction artifact can increase the object-to-background ratio to values far higher than the true ratio. This increase has been observed in clinical studies by several groups (1,4,5), but to our knowledge, the studies of Bai et al. (8,9) and our own study are the first to reveal the causes. The simulation also illustrates that an increased object-to-background ratio does not imply an increased signal-to-noise ratio. The exact value of the signal-to-noise ratio is affected by such factors as the number of iterations and the shape of the object, but the experiment clearly shows that signal-to-noise ratio and contrast are very different things. Several comparative studies have been performed to assess the value of attenuation correction (1,2,4,5,13–16). However, there is considerable variation in the methodology used, and the conclusions are seemingly contradictory. In our simulation, the signal-to-noise ratio seemed to depend at least as much on the reconstruction algorithm that was used (FBP or MLEM) as on whether attenuation correction was applied. This dependence may be one of the reasons that different groups have come to different conclusions.
The NEG-ML algorithm reduces loss of information by avoiding the setting of negative regions to zero by the nonnegativity constraint. This algorithm obviously lacks theoretic justification, because negative activities are meaningless. However, when attenuation correction is ignored, there is no theory supporting the application of MLEM (or indeed any reconstruction algorithm) either. Reconstruction without attenuation correction is heuristic in itself and only justified by the (remarkable) fact that the resulting images carry valuable diagnostic information. Allowing negative values increases the degrees of freedom available to the reconstruction algorithm and reduces the inconsistency of the data (the computed unattenuated projections agree better with the measured data, and NEG-ML produces a higher “likelihood” than MLEM). Thus, more information from the data can be incorporated into the reconstruction, albeit in a severely deformed way. FBP also allows negative values, but because of its different data weighting, its response to the remaining inconsistency of the data differs from that of NEG-ML, resulting in poorer visual quality.
Erlandsson et al. (17) proposed another approach to allow inclusion of negative reconstruction values (their application was the unbiased reconstruction of precorrected SPECT data). Their work is based on an algorithm that extends MLEM with a prior value for the lower and upper bounds on the reconstructed pixel values (18). This lower bound can be set to a negative value. In contrast, our method introduces no bounds, which allows a simpler update expression than in (18). The behavior of our algorithm is similar to that of regular MLEM with respect to the computation time, the convergence speed, and the effectiveness of acceleration with ordered subsets (19).
We have not systematically compared tumor detection performance for the 3 algorithms. However, an earlier careful comparison of FBP with regular MLEM revealed no difference for tumor detection in clinical practice (15). Consequently, it is expected that the introduction of NEG-ML, which behaves as a compromise between FBP and MLEM, will not yield a significant improvement in tumor detection. However, the physicians report that anatomic localization is easier and that their confidence in the diagnosis has been increased since MLEM was replaced by NEG-ML for non-attenuation-corrected whole-body PET studies.
CONCLUSION
A theoretic analysis of the attenuation artifact in PET has been presented. The analysis was confirmed by simple simulation experiments and by findings in clinical studies reported by several groups. On the basis of this analysis, a new dedicated ML algorithm for the reconstruction of whole-body images without attenuation correction is proposed. The analysis shows that the attenuation artifact can increase tumor-to-background ratio, but simulations illustrate that this increase does not imply improved detection.
APPENDIX A
Consider an infinitely thin ring of uniform activity concentrically embedded in an otherwise cold attenuating disk, as shown in Figure 6. Assume that R is the radius of the ring, RA > R is the radius of the attenuating disk, λ is the radioactivity per unit length in the ring, and μ is the linear attenuation coefficient. The attenuated projection acquired along a line with angle θ at a perpendicular distance x from the center of the disk can be written as:
 Eq. 4 where M(x,θ) is the total attenuation and A(x,θ) the total activity along the line. Because the disk is uniform, the total attenuation varies with the intersection length of the line:

 Eq. 5 The activity can be written as:
 Eq. 6 where δ(x) is the Dirac delta function and s is the position on the projection line. Substitution of u =
  and integrating finally yields:

 Eq. 7 Note that the singularity in x = R vanishes with integration over R when a ring of finite thickness is considered. Because of the symmetry of this problem, the sinogram I(x,θ) is independent of the angle. Consequently, it is consistent under the assumption of zero attenuation (20), and an exact solution exists. An integral expression can be obtained by direct application of FBP. An elegant and fast alternative is to apply an operator that computes the point spread function from the line spread function (21), which is the method we have chosen here.
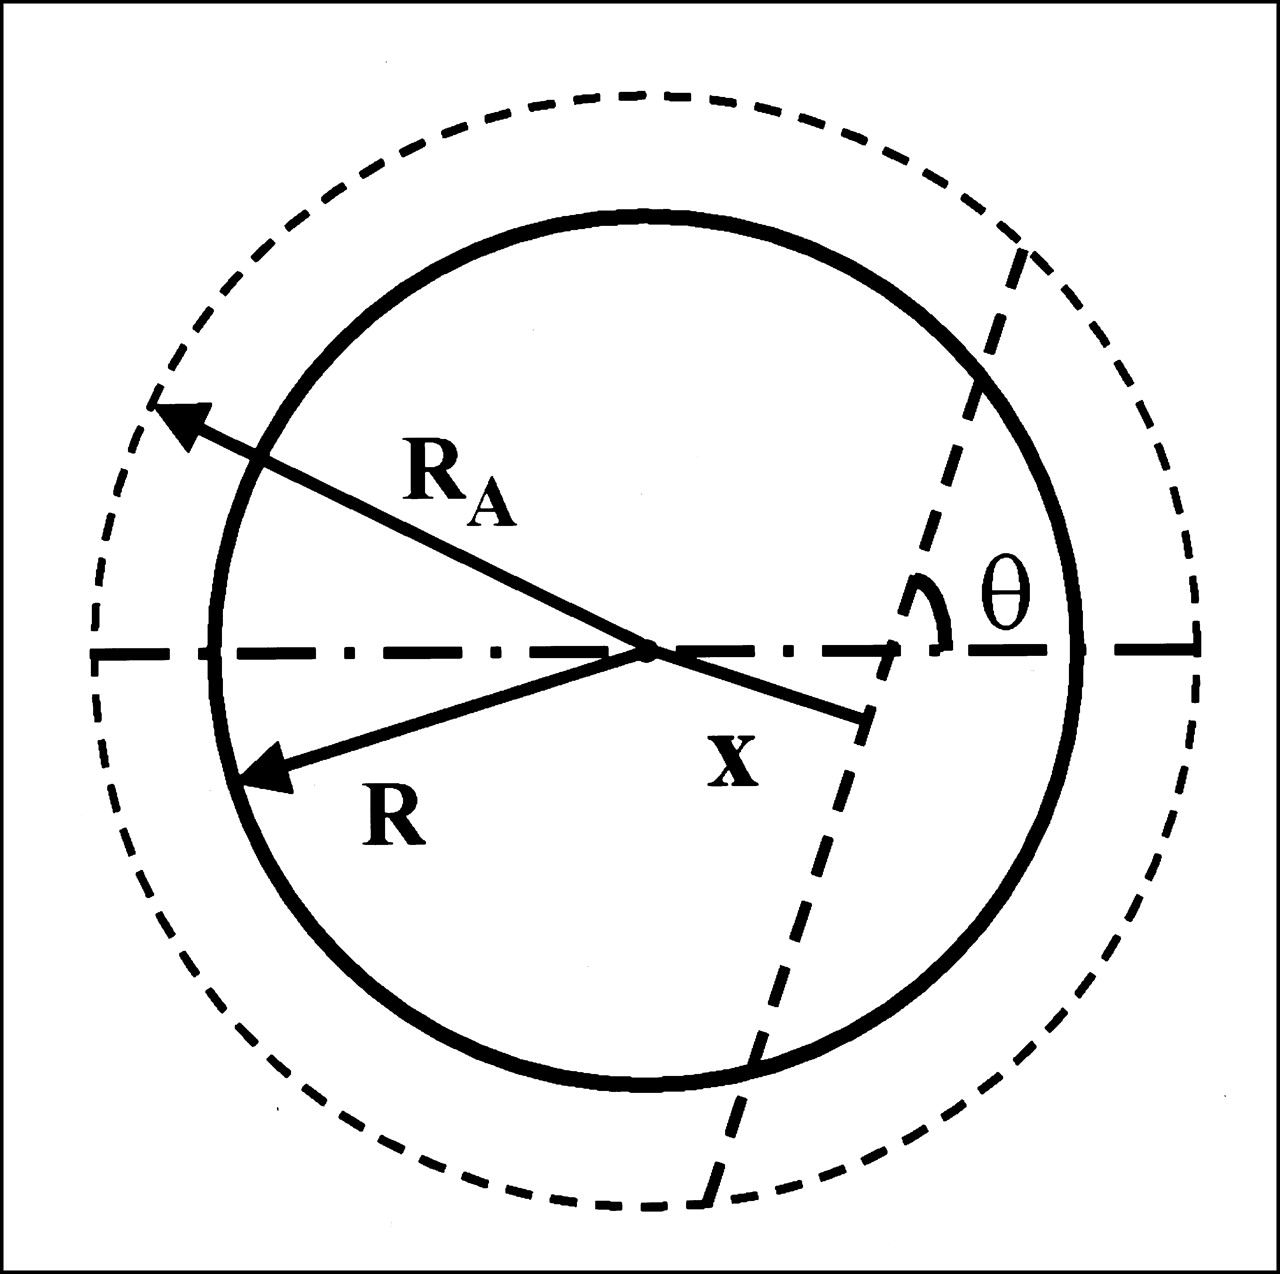
Radioactive ring in uniform attenuating disk.
Because all projections are identical, the reconstruction of Equation 7 is radially symmetric and can be represented as f(x2 + y2) = f(z). The projection can be regarded as a line spread function, and the reconstruction can be regarded as the corresponding point spread function. The solution is given by (21):
 Eq. 8 where z = x2 + y2, A(x2) = I(x,θ) is the line spread function, and v is the integration variable. Inserting Equation 7 produces:
 Eq. 9 Substituting
  and taking the derivative under the integral sign results in:
 Eq. 10 which is negative for z < R2 and μ > 0.
APPENDIX B
The logarithm of the likelihood for emission tomography can be written as (22):
 with hi(ri) = yi ln ri − ri and:
 Eq. 11 where yi is the measured count in detector i, λ j is the (unknown) activity in pixel j, cij is the assumed detection probability (ignoring attenuation), and terms independent of λ have been dropped. The MLEM algorithm can be written as a gradient ascent algorithm (10):
 Eq. 12 where the prime indicates the reconstruction available at the current iteration. As mentioned in the text, the disadvantage of this algorithm is that the step size vanishes if λ′ j goes to zero.
To derive an alternative gradient ascent algorithm maximizing L(λ⃗λ), we apply an approach similar to the surrogate function method proposed by Fessler et al. (11). In that study, the concavity of the likelihood was exploited to obtain surrogate functions in which the variables are separated. The 1-dimensional optimization of the surrogate function was executed on the basis of a quadratic approximation. Here, we first introduce a quadratic approximation and use the concavity of the quadratic function to separate the variables. This approach avoids problems related to the nonnegative support of the logarithm. (This same approach can be used to obtain an alternative derivation for our maximum-likelihood algorithm for transmission tomography (23,24).)
We assume that in every iteration, L can be well approximated by a truncated series expansion:
 Eq. 13 Here, the dot denotes the derivative and the prime indicates the current reconstruction value. Because ḧicijciξ is negative and because 2(λ j − λ′j)(λξ − λ′ξ) ≤ (λ j − λ′j)2 + (λξ − λ′ξ)2, it follows that:
 Eq. 14 This allows the introduction of a function T2 in which the variables are separated:
 Eq.15 Thus, we obtain the following relations:
 Eq. 16
 Eq. 17 Consequently, an iteration that updates λ′ to λ by maximizing T2 increases T1 (unless λ = λ′) and should increase L if the quadratic approximation (Eq. 13) is sufficiently accurate. Maximizing the quadratic function T2 is trivial because each term depends on exactly 1 variable λ j. Setting the derivatives with respect to λ j to zero yields:
 Eq. 18 The derivatives of hi are readily computed from Equation 11. For simplicity, we replace yi/r′i2 with 1/ yi in the denominator (this approximation should be fairly accurate close to the solution). This produces:
 Eq. 19 The factor between squared brackets is the step size, which does not vanish when λ j approaches zero. To avoid zero divisions in Equation 19, we replace 1/ yi or 1/r′ i with 1 whenever yi or r′ i is smaller than 1. This step size turns out to be relatively small for positive pixel values. To improve the convergence speed, we compute also the MLEM step size (Eq. 12) in every pixel and apply the larger of the two. As a result, the convergence for positive pixels is expected to be virtually identical to that obtained with MLEM, which is confirmed by our experience. Note that the step size in Equation 19 does not depend on the reconstruction. Consequently, the work done in every iteration is identical to that of MLEM, resulting in identical reconstruction times. As expected from the similarity with MLEM, our experience shows that the acceleration achieved with ordered subsets (19) is also identical to that with MLEM.
As shown by De Pierro (25), the MLEM algorithm can also be derived by introducing surrogate functions with separated variables. The surrogates used by De Pierro have a nonnegative support, and each reconstruction pixel is forced to be nonnegative. The quadratic surrogate functions used here do allow negative values. However, to coincide with the likelihood up to the first derivate, the sum ri = ∑ jcijλj will still tend to be nonnegative. As mentioned above, we force it to be at least 1 to avoid numeric problems.
Acknowledgments
The authors acknowledge Jeffrey Fessler for valuable suggestions and appreciate the discussions with Paul Kinahan. This study was supported by the Flemish Fund for Scientific Research, grant G.0106.98, and by grant OT/00/32 from Katholieke Universiteit Leuven.
Footnotes
Received Oct. 1, 2001; revision accepted Mar. 25, 2002.
For correspondence or reprints contact: Johan Nuyts, PhD, Nuclear Medicine, Katholieke Universiteit Leuven, U.Z. Gasthuisberg, Herestraat 49 B3000 Leuven Belgium.
E-mail: Johan.Nuyts{at}uz.kuleuven.ac.be
REFERENCES
In this issue


Jump to section
Related Articles
Cited By...
- HRRT Versus HR+ Human Brain PET Studies: An Interscanner Test-Retest Study
- Accuracy of 3-Dimensional Reconstruction Algorithms for the High-Resolution Research Tomograph
- Whole-Body 18F-FDG PET in Recurrent or Metastatic Nasopharyngeal Carcinoma
- An Analytic Study of the Effects of Attenuation on Tumor Detection in Whole-Body PET Oncology Imaging