


Abstract
The aim of this study was to quantify regional bone blood flow and [18F]fluoride ion influx with [18F]fluoride ion PET and correlate the results with specific static and dynamic indices of bone metabolism in healthy pigs. Methods: During continuous ventilation (fractional concentration of oxygen in inspired gas = 0.3), dynamic PET scans 120 min in duration were obtained for 9 mini pigs after intravenous injection of 10.0 ± 1.2 MBq (mean ± SD) of [18F]fluoride ion per kilogram of body weight. Iliac crest bone biopsies were performed immediately before the PET scan to determine static and dynamic indices of bone metabolism (i.e., the mineral apposition rate) by bone histomorphometry. Kinetic rate constants describing influx (K1) and efflux (k2) of [18F]fluoride as well as chemisorption and incorporation of [18F]fluoride (k3) and reverse transport (k4) were determined for 6 vertebral bodies in each animal. Blood flow estimates (f) were derived from K1 values corrected for the permeability–surface area product using a previously derived correction algorithm. A rate constant describing the net forward transport rate of fluoride (Ki) and the fluoride volume flux (Kflux) derived from a 2-tissue-compartment model was calculated and compared with the results of Patlak graphic analysis (Kpat). Results: A significant correlation was found between mineral apposition rate and Ki (P < 0.005), Kflux (P < 0.01), Kpat, K1, and f (P < 0.05). The values of f, Ki, Kflux, and Kpat did not correlate significantly with other static or dynamic histomorphometric indices or with age, serum alkaline phosphatase, or parathyroid hormone levels. The values of f and Ki correlated linearly (y = 0.023 + 0.32x; r2 = 0.74; P < 0.001). Conclusion: PET bone studies using [18F]fluoride ion provide quantitative estimates of bone blood flow and metabolic activity that correlate with histomorphometric indices of bone formation in the normal bone tissue of the mini pig. Therefore, it seem reasonable to assume that [18F]fluoride ion PET can reduce the number of invasive bone biopsies, thus facilitating follow-up of patients with metabolic bone diseases.
- [18F]fluoride ion PET
- bone metabolic activity
- bone histomorphometry
- bone blood flow
- quantitative imaging
Detailed knowledge about metabolic activity in bone is essential to understanding the pathophysiology of bone diseases and bone healing. A noninvasive imaging technique that measures bone metabolic activity quantitatively would be highly desirable for monitoring treatment changes in renal and hepatic osteodystrophy, primary hyperparathyroidism, and osteoporosis and for monitoring bone healing. Bone histomorphometry remains the gold standard for diagnosing metabolic bone diseases (1), with quantitative measurement being needed for most metabolic bone disorders to obtain a definitive diagnosis that allows specific treatment (2). Nevertheless, such measurement can be accomplished only invasively. The determination of a dynamic index of bone metabolism, that is, the bone apposition rate, can be assessed only using in vivo labeling procedures (double tetracycline labeling). Repetitive bone biopsies using tetracycline labeling are necessary to monitor the effect of treatment. Furthermore, because of considerable variation in histomorphometric estimates across different sites of the iliac crest, questions remain about whether the site of a single bone biopsy represents the true severity of the underlying metabolic bone disease (3). In addition, a bone histomorphometry quality control study found significant inter- and intraobserver differences (4).
PET allows assessment of bone metabolic activity using the bone-seeking [18F]fluoride ion. [18F]fluoride ion PET has been used to detect metastatic bone disease (5–7) and to assess femoral head osteonecrosis (8), bone graft viability (9,10), and various metabolic bone diseases (11,12). Hawkins et al. (13) were the first to quantitatively measure bone metabolism by [18F]fluoride ion PET in normal human vertebrae using a 2-tissue-compartment, 4-parameter model according to the biologic distribution of fluoride in bone. This method allows the estimation of specific rate constants describing the transport and binding of the [18F]fluoride ion. After entering the bone tissue, a certain fraction of fluoride either binds to bone tissue on the surface or undergoes ionic exchange with hydroxyl groups of hydroxylapatite Ca10(PO4)6(OH)2 to form fluorapatite Ca10(PO4)6F2 (incorporated fraction). The rate constants describing these processes are as follows: K1 and k2 for the forward and reverse capillary transport, k3 for the binding to the bone matrix, and k4 for the release reaction. These rate constants (microparameters) and the net transport of [18F]fluoride ion into bone (macroparameter) can be estimated with dynamic [18F]fluoride ion PET.
According to the compartment model used, the rate constant K1 is defined as the product of bone blood flow and the extraction fraction of the tracer (Eq. 3). Because many of the [18F]fluoride ions are transported into bone in a single capillary passage (14), the magnitude of K1 is strongly related to bone blood flow. Recently, we showed that extraction of the [18F]fluoride ion into bone tissue is a function of bone blood flow (15). Under low and normal flow conditions, extraction of the [18F]fluoride ion approaches 100%. Therefore, K1 adequately represents bone blood flow under these flow conditions. Because of diffusion limitations, extraction of [18F]fluoride decreases considerably in regions of high blood flow. This necessitates the correction of K1 if bone blood flow is to estimated with [18F]fluoride ion PET.
This study was performed to investigate whether specific indices of bone formation can be estimated on the basis of certain rate constants of [18F]fluoride metabolism using dynamic [18F]fluoride ion PET. Because bone blood flow is metabolically regulated by bone remodeling (16), and because capillary filtration is associated with the bone formation rate (17), we investigated the quantitative relationship between [18F]fluoride ion transport and bone formation rate. Of particular interest was the relationship between certain macroparameters of [18F]fluoride ion kinetics (influx constant, metabolic rate of [18F]fluoride ion) and specific markers of bone formation. Therefore, we also investigated which macroparameter best represents bone metabolism.
MATERIALS AND METHODS
Nine female adult mini pigs (age range, 1.5–6.7 y; mean age ± SD, 3.5 ± 2.0 y; weight range, 25.0–70.0 kg; mean weight, 50.6 ± 14.7 kg) were used to investigate bone metabolism. The animals were premedicated with an intramuscular injection of 120 mg azaperone, 2 mg flunitrazepam, 200 mg ketamine, and 1 mg atropine sulfate. After tracheal intubation, anesthesia was maintained by continuous ventilation with a respirator (Sulla 800 V; Dräger, Lübeck, Germany) as described previously (15). Oxygen and nitrogen were mixed in a proportion of 3:7 to set the fraction of inspired oxygen to 30% (fractional concentration of oxygen in inspired gas = 0.3). The tidal volume of ventilation was set to 10–13 mL/kg of body weight with a frequency of 11–12 per minute and was modified according to the results of frequent arterial blood gas analysis to keep the partial pressure of carbon dioxide (pCO2) within the reference range. Body temperature was maintained at a constant 37°C using a heating mat. Electrocardiography findings and systemic blood pressure were recorded continuously (model 78354 A monitor; Hewlett Packard, Böblingen, Germany). A large biopsy sample (approximately 2 × 3 × 1 cm) was taken from the iliac crest. Bone biopsy samples were immediately fixated into 40% and 70% ethanol. Polyurethane catheters were inserted into the external jugular vein and abdominal aorta through the femoral artery to allow blood sampling and infusions of 0.9% saline. For PET scanning, the animals were comfortably positioned in a heated plastic tub with legs and body restrained by bandages while anesthesia was continued.
The experimental protocol was reviewed and approved by the Animal Research Committee of the Administration District of Tübingen. The institutional guidelines for the care and use of laboratory animals were followed throughout the study.
Blood Measurements
Serum calcium, phosphate, hemoglobin, serum total protein, albumin, and alkaline phosphatase were measured using standard methods. The fluoride serum level (unlabeled) was measured with an ion-sensitive electrode method before tracer injection. Serum intact immunoreactive parathyroid hormone was measured using a commercially available radioimmunoassay test kit (Mallinckrodt Diagnostica, Dietzenbach, Germany), which included determination of the C-terminal fragments. Before the investigation, all animals received a standardized pig diet for at least 1 mo.
Bone Histomorphometry
Histomorphometric analyses were performed on biopsy samples of the iliac crest. Quantitative bone histomorphometry was performed using the standard techniques established by Parfitt et al. (18). All animals received 2 short courses of intravenous tetracycline hydrochloride (15 mg/kg of body weight for 2 d) before bone biopsy to achieve double tetracycline labeling of bone (10-d labeling interval). Using light microscopy and fluorescence microscopy (DM RBE; Leica, Bensheim, Germany) for tetracycline-derived parameters, we assessed the histomorphometric indices according to the guidelines of the American Society for Bone and Mineral Research (18). Quantitative measurements were performed using a computerized analysis system digitizing the microscopic field to the computer screen, where the field could be analyzed by dedicated software (Quantimet 600S; Leica). Histomorphometric data were expressed in terms of 2 dimensions. In each biopsy sample, 20 fields were averaged to calculate static parameters: the area of trabecular bone (in percentage of total bone), the trabecular bone perimeter (in μm/mm2), the trabecular width (in micrometers), the trabecular thickness (in micrometers), the osteoid area (in percentage of total bone), the osteoid perimeter (in μm/mm2), the osteoid width (in micrometers), and the osteoid thickness (in micrometers). Using double tetracycline labeling, the dynamic index of bone formation, the mineral apposition rate (MAR, in μm/d), was calculated. In addition, the osteoblasts and osteoclasts were counted (per mm2).
In initial experiments, we investigated the relationship between bone histomorphometric data of lumbar vertebrae and bone histomorphometric data of iliac crests. In 5 mini pigs of the same age group (mean age, 3.4 y), bone biopsies were taken from the fifth or sixth lumbar vertebra (intraabdominal access) and the iliac crest on the same day. Using paired t tests, we found no significant differences in histomorphometric parameters between biopsy sites. The MAR was 1.74 ± 0.24 in the iliac crest and 1.84 ± 0.11 in the vertebrae. Because of 2 severe complications caused by the vertebral biopsies (1 case of intraabdominal bleeding and 1 vertebral bone fracture), vertebral biopsies were not taken in further experiments.
Measurement of Bone Mineral Density
Within 1 d before or after PET scanning, bone mineral density (BMD) was measured for 5 animals using CT scanning. A dual-energy CT scanner (Somatom DR 3; Siemens, Erlangen, Germany) with rapid kilovolt switching (85 and 125 kV), which minimizes errors caused by the varying fat content of bone marrow, was used. The data on trabecular and cortical bone density were calculated using dedicated software (EVA dialog program, version D; Siemens). To allow bone densitometry, an algorithm exclusively registering signals between 200 and 2,000 Hounsfield units was used. For each CT scan, the density of a calcium hydroxylapatite (CaHa) body was measured as a reference. For CT scanning, the animals were anaesthetized for approximately 15 min with an intramuscular injection of flunitrazepam and ketamine and kept in a supine position. Midsection slices 4 mm thick were selected from the 6 lumbar vertebrae of each animal. Regions of interest (ROIs) were individually drawn in the center of the vertebrae to obtain the average density of trabecular bone and around the borders of the vertebrae to obtain the average density of cortical bone. To allow intermodality matching with PET data, corresponding ROIs were drawn on the PET and CT images, averaging the BMD of trabecular and cortical bone of the 2 upper lumbar vertebrae. The BMD was expressed as milligrams of CaHa per cubic centimeter of bone tissue.
Radiotracer
[18F]fluoride was produced through the 18O(p,n)18F nuclear reaction in a cyclotron (PETtrace; General Electric Medical Systems, Neu Isenburg, Germany) by irradiating 1.5 mL 18O-water (97% enrichment) with 16.5 MeV protons. The production yields were 2,200 ± 100 MBq/μA/h at the end of the bombardment. [18F]fluoride was diluted in 10 mL 0.9% saline solution for intravenous injection and was passed through a 0.22-μm filter for sterilization. Quality control was performed on 100-μL samples. The radiochemical purity of [18F]fluoride was always >99% as determined by silica gel 60 thin-layer chromatography (Merck, Darmstadt, Germany; CH3CN:H2O = 95:5 [v/v]; Rf = 0). The solutions were found to be pyrogen free (LAL-5000; Pyroquant Diagnostik, Walldorf, Germany).
Data Acquisition
PET was performed using an Advance scanner (General Electric Medical Systems). Briefly, a 20-min transmission scan using a pair of rotating 68Ge sources was obtained after positioning. Simultaneously with the injection of 10.0 ± 1.2 MBq of [18F]fluoride per kilogram of body weight, a dynamic sequence of 32 emission scans was performed for 120 min (protocol: 12 × 10 s, 6 × 30 s, 5 × 5 min, and 9 × 10 min). Arterial blood samples were drawn continuously from the aorta with a calibrated infusion pump (Gemini PC-1; IMED Corp., San Diego, CA) at a flow rate of 15 mL/min for the first 3 min. This high flow rate was previously found to produce undispersed blood input functions (15). Whole-blood radioactivity was measured continuously with a calibrated NaI detector system (model 200-31001 blood sampler, FRQ detector unit; General Electric, Uppsala, Sweden). For the remaining scan time (after 3 min), blood samples were drawn discontinuously into heparinized syringes at progressively longer intervals. [18F]fluoride concentrations from both plasma and whole blood were determined by a calibrated NaI scintillation counter throughout the scan. The whole-blood time–activity curves from the automated counting device were corrected according to the relationship of activity in plasma and whole blood. Radioactivity measurements derived from tissue, whole blood, and plasma were corrected for decay.
Mathematic Model
For [18F]fluoride ion PET studies, the kinetic parameters were estimated from the tissue and arterial plasma activity curves by a standard nonlinear least squares analysis using the MATLAB computing environment (The MathWorks, Inc., Natick, MA). Before the individual fitting, the delay of tracer arrival was optimized by least squares fitting for a large ROI summing several slices of a representative vertebra to a mean tissue response curve. In further analysis (fitting of individual rate constants), the delay of tracer arrival was fixed to the value obtained. The time delay (mean, 2.4 ± 1.5 s) was found to be stable throughout the experiments. The standard 2-tissue-compartment, 4-parameter tracer kinetic model proposed by Hawkins et al. (13) was used to estimate K1, k2, k3, and k4. A fifth parameter for the fractional blood volume (BV) was included to account for nonextracted tracer in the vascular space of the tissue (19). The net forward transport rate of fluoride to the tissue compartments (i.e., the macroparameter Ki, or fluoride influx rate), in mL/(min · cm3), was calculated as:
 Eq. 1
Eq. 1
The fluoride influx rate was also estimated by Patlak graphic analysis (Kpat) (20,21) using the same data (arterial plasma and tissue time–activity curves) as were used for the estimation of Ki without correction for BV. Kpat was estimated from the slope of the graph using data between 20 and 60 min (Kpat) and between 40 and 120 min (Kpat120) for comparison.
In addition, the fluoride volume flux (i.e., the macroparameter Kflux), in μmol/(min · cm3), was calculated as follows:
 Eq. 2
Eq. 2
In Equation 2, the fluoride influx is expressed in units of concentration per volume, necessitating measurement of the unlabeled fluoride ion concentration in plasma (19F−).
Previously, we determined the amount of [18F]fluoride ion extraction from blood into bone tissue under various flow conditions. Assuming that extraction of [15O]H2O in a single capillary passage approaches 100%, we showed flow dependency for [18F]fluoride ion extraction using dual-tracer studies with [15O]H2O and [18F]fluoride ion PET (15). The observed relationship, in mL/(min · cm3), between bone blood flow determined with [15O]H2O and K1 in healthy mini pigs followed the formula of Renkin (22) and Crone (23):
 Eq. 3
where E is the so-called unidirectional extraction fraction of the tracer, PS is the permeability–surface area product of the capillary surface, and f is the arterial flow to the tissue. To estimate the “true” regional blood flow (f) from K1 values, we had to apply an extraction correction. A lookup table of the flow-dependent extraction fraction was generated according to Equation 3 using the experimentally measured permeability–surface area product of 0.25 ± 0.007 min−1 (15).
Eq. 3
where E is the so-called unidirectional extraction fraction of the tracer, PS is the permeability–surface area product of the capillary surface, and f is the arterial flow to the tissue. To estimate the “true” regional blood flow (f) from K1 values, we had to apply an extraction correction. A lookup table of the flow-dependent extraction fraction was generated according to Equation 3 using the experimentally measured permeability–surface area product of 0.25 ± 0.007 min−1 (15).
Data Analysis
Image analysis was performed on Apollo 9000, model 735, workstations (Hewlett Packard, Palo Alto, CA). Images were reconstructed by filtered backprojection using a Hanning filter and corrected for attenuation and dead time, resulting in 128 × 128 pixel images for the entire dynamic sequence. The PET scanner reaches a spatial resolution of approximately 5-mm full width at half maximum (FWHM) at the center of the field of view (National Electrical Manufacturers Association [NEMA] performance standard) (24). The resolution is considerably lower when dynamic image acquisitions are applied (approximately 8- to 10-mm FWHM). Standardized elliptic ROIs (1.1 cm2) were drawn on 6 vertebral bodies of each animal, selecting the slice in the midsection of each vertebra. Sagittal and coronal image reconstruction of the last image frame was performed to ensure correct ROI selection. In these images, intervertebral sections were clearly visible. To avoid spillover effects caused by the intervertebral spaces, we did not use these particular slices or those directly above and below them (in the axial direction) for ROI definition.
In 5 animals, analysis of transaxial CT images revealed that lumbar porcine vertebrae contain more cortical bone than do human vertebrae. The ratio of trabecular to cortical bone in a slice from the midsection of the vertebral bodies was approximately 60:40. Therefore, even ROIs in the center of the vertebral bodies contained a considerable amount of cortical bone. According to CT images, the mean size of vertebral bodies was 2.8 cm in the transaxial direction and 1.3 cm in the sagittal direction, with little variability.
Statistical Analysis
Results are expressed as mean values ± SDs. A paired t test was used to compare the histomorphometric results of the vertebral body and iliac crest bone biopsies. In all animals, average microparameters (f, E, K1 to k4, and BV) and macroparameters (Ki, Kpat, and Kflux) were correlated with histomorphometric indices and laboratory results using linear regression analysis. Data were subjected to 1-way ANOVA followed by normality and constant variance tests. If the data were not normally distributed or if the variances were unequal between parameters, the level of significance was determined using a nonparametric test (Spearman rank correlation). P < 0.05 was taken as significant. Statistical tests were performed with JMP, version 3.2 (SAS, Erkrath, Germany).
RESULTS
Biochemical Results
Laboratory and cardiocirculatory results are summarized in Table 1. Blood gases (partial pressure of oxygen, pCO2, and oxygen saturation), hemoglobin concentrations, mean arterial blood pressure, and heart rate were stable throughout PET scanning. The variability of the serum concentrations of unlabeled fluoride was found to be fairly low (18.0 ± 3.4 nmol/L).
Laboratory Results, Cardiovascular Data, and Respiratory Data
PET Results
Figure 1 shows a transaxial image obtained 110–120 min after intravenous injection of 11.0 MBq of [18F]fluoride ion per kilogram of body weight and displays the definition of an oval ROI within the center of a lumbar vertebral body. Figure 2 illustrates the time courses of decay-corrected [18F]fluoride ion concentrations in arterial plasma and the ROI of that particular vertebral body. After tracer injection, [18F]fluoride was rapidly cleared from the circulation, whereas the activity in bone tissue increased progressively. The graph displays the least squares fit to the measured tissue data from a 2-tissue-compartment fit. According to the results of the fit, estimates for the activity belonging to the bound tissue compartment (k3/[k2 + k3]) and for the distribution volume of free fluoride in tissue (K1/[k2 + k3]) are also given. Initially, most of the activity in tissue was in the unbound tracer compartment. With increasing time, the activity in the bound tracer compartment rose rapidly. At the end of the 2-h scan, most of the activity in bone tissue was related to bound [18F]fluoride.
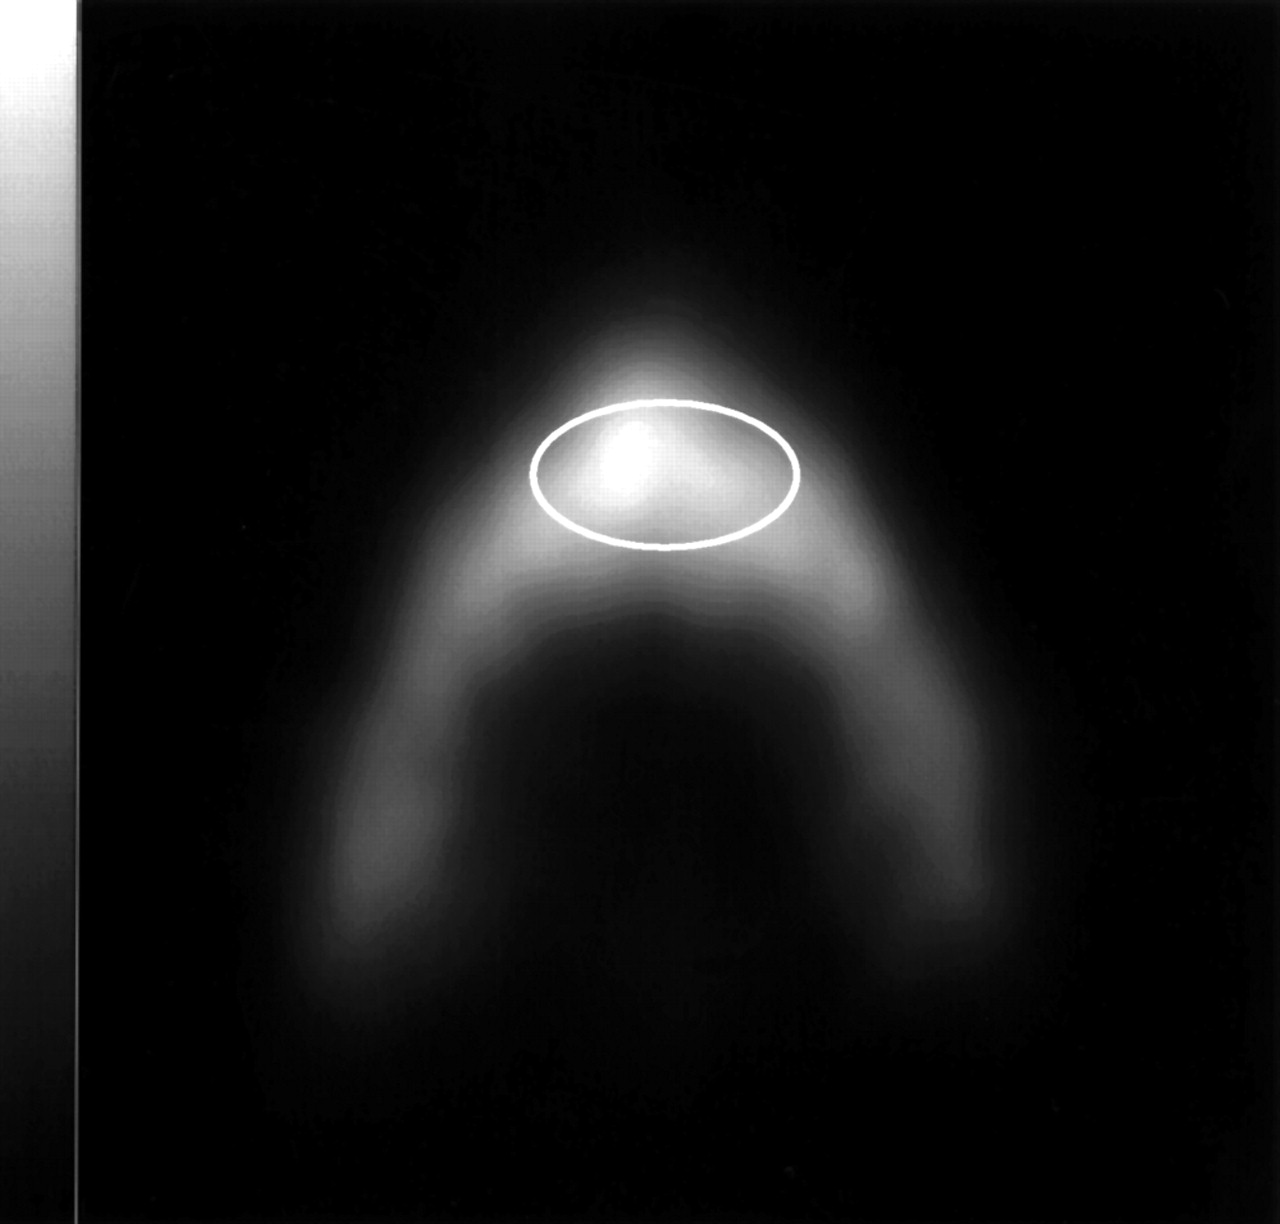
Transaxial [18F]fluoride ion PET of lumbar vertebra of mini pig. Image was obtained after intravenous injection of 11.0 MBq of [18F]fluoride ion per kilogram of body weight (frame between 110 and 120 min). Oval ROI (1.1 cm2) is defined in center of vertebral body (image scale, 0–206 kBq/cm3).

Typical time courses of decay-corrected activities from 18F in arterial plasma (•) and bone tissue (◊) of ROI in Figure 1. Dotted line with ▴ represents least squares fit to measured tissue data. Dashed line with ▿ illustrates unbound tracer activity within bone tissue, and dashed line with ▪ illustrates bound tracer activity within bone tissue.
The relationship between [18F]fluoride concentrations in plasma and whole blood was determined. The concentration was consistently higher in plasma than in whole blood (factor, 1.15–1.32). Within each animal, the ratio between plasma and whole-blood activity remained fairly constant over time.
The mean values for K1 to k4, fractional BV, Ki, Kflux, and Kpat of 6 vertebral bodies of individual animals are shown in Table 2, including estimates for the bone blood flow and the extraction fraction of [18F]fluoride. The uncertainties for parameter estimates, expressed as the percentage coefficient of variation (SD/mean × 100), varied with the individual rate parameters. The most stable parameters were the macroparameters Ki, Kflux, and Kpat, displaying a coefficient of variation of 3%–13%. The parameters K1 and f were the most stable microparameters, with a coefficient of variation of 4%–39%, whereas the uncertainties were higher for k2 to k4 and BV. The single-pass extraction fraction of [18F]fluoride was estimated to be 89 ± 9%.
PET Data
As shown in Figure 3, a highly significant correlation was found between the fit results of Patlak graphic analysis (Kpat) and the fluoride influx rate (Ki) (y = 0.003 + 0.87x; r2 = 0.92; P < 0.001). The slope, 0.87, was not significantly different from 1 (95% confidence interval, 0.64–1.11). Using an interval of 40–120 min after injection (Kpat120), instead of the 20–60 min used for Kpat, profoundly affected the estimation of the [18F]fluoride influx rate (Table 2). Kpat120 values also correlated strongly with Ki values (y = 0.0 + 0.7x; r2 = 0.87; P < 0.001), but the slope, 0.7 (95% confidence limit, 0.47–0.93), indicated a significant underestimation of Ki by Kpat120.
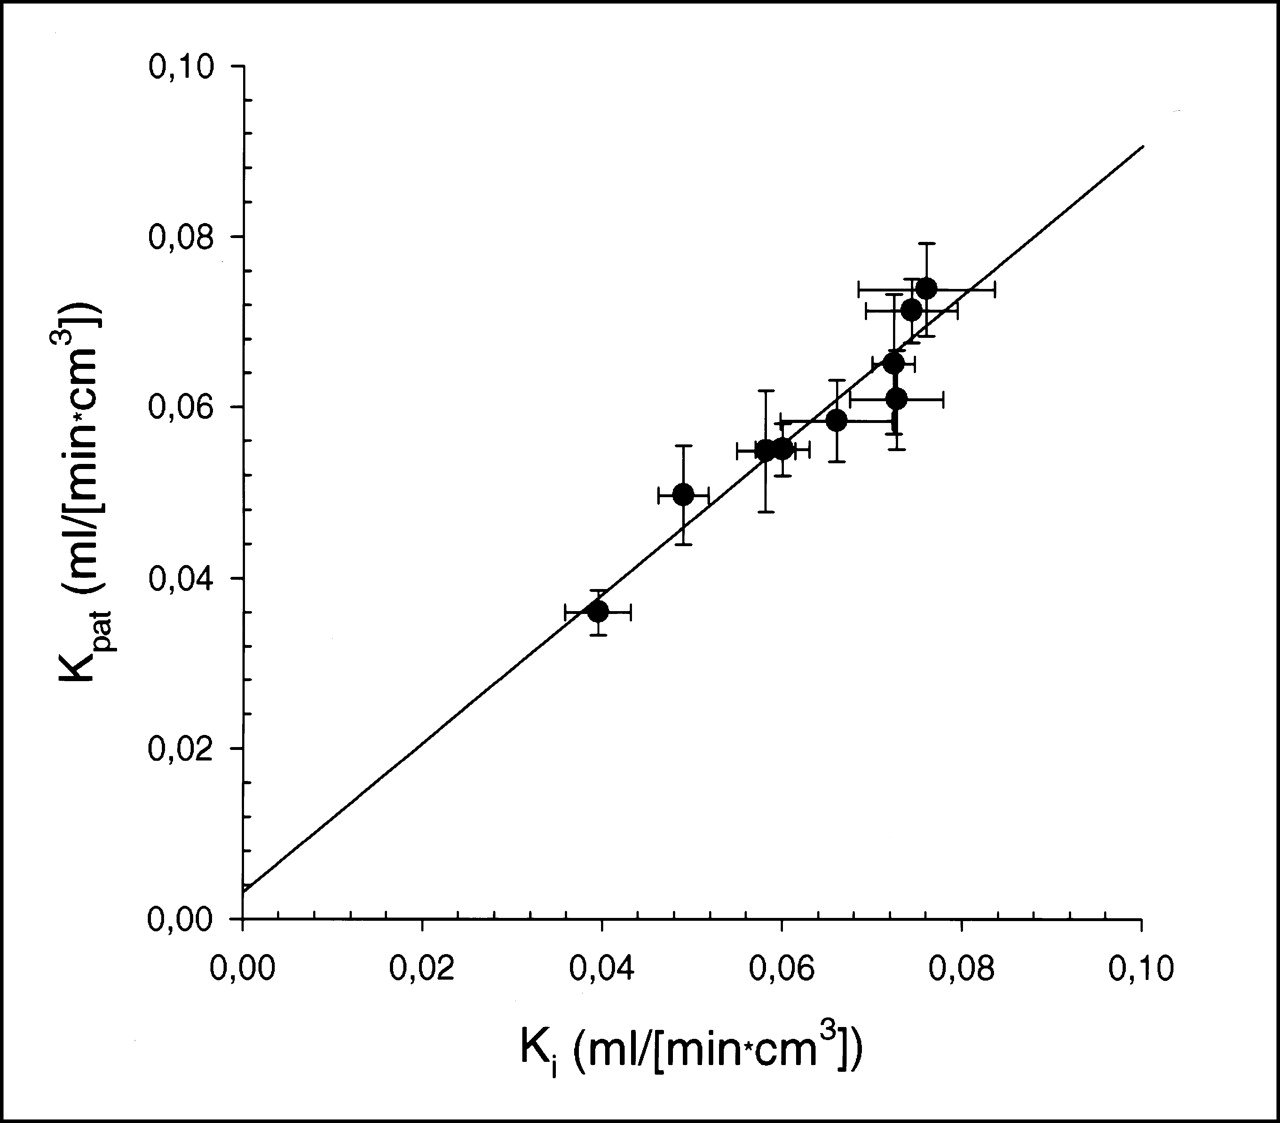
Plot of macroparameters for [18F]fluoride ion influx rates Ki and Kpat. Data represent mean of 6 ROIs with their respective SDs as error bars in both directions (x- and y-axes). Linear regression analysis yielded highly significant correlation (y = 0.003 + 0.87x; r2 = 0.92; P < 0.001).
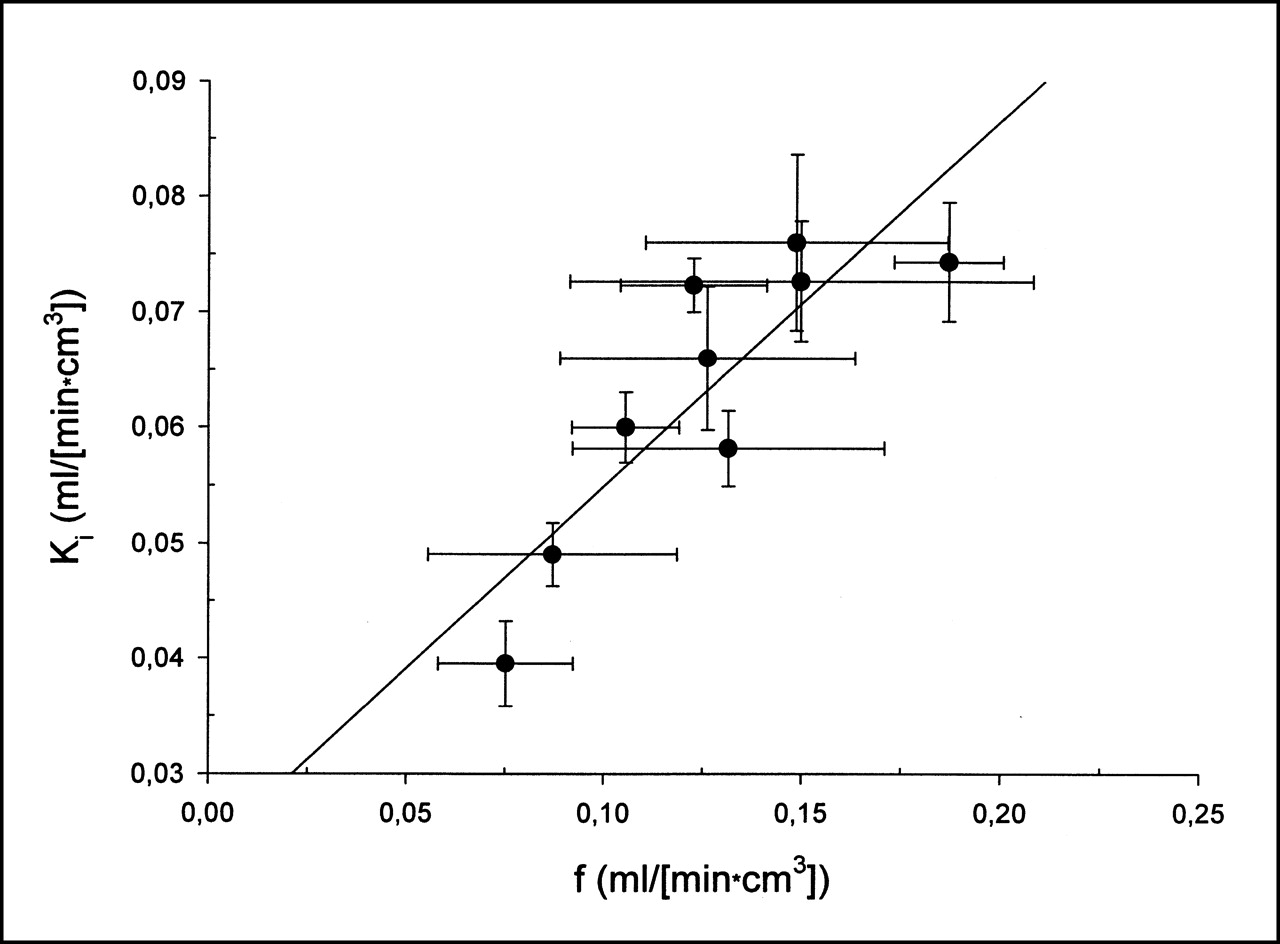
In addition, we investigated the relationship between f and Ki. In the observed range of data, we found a highly significant linear correlation between these 2 parameters (y = 0.023 + 0.32x; r2 = 0.74; P < 0.001) (Fig. 4).

Plot of blood flow estimates f and [18F]fluoride ion influx rate Ki. Data represent mean of 6 ROIs with their respective SDs as error bars in both directions (x- and y-axes). Linear regression analysis yielded highly significant correlation (y = 0.023 + 0.32x; r2 = 0.74; P < 0.001).
Bone Histomorphometry Results
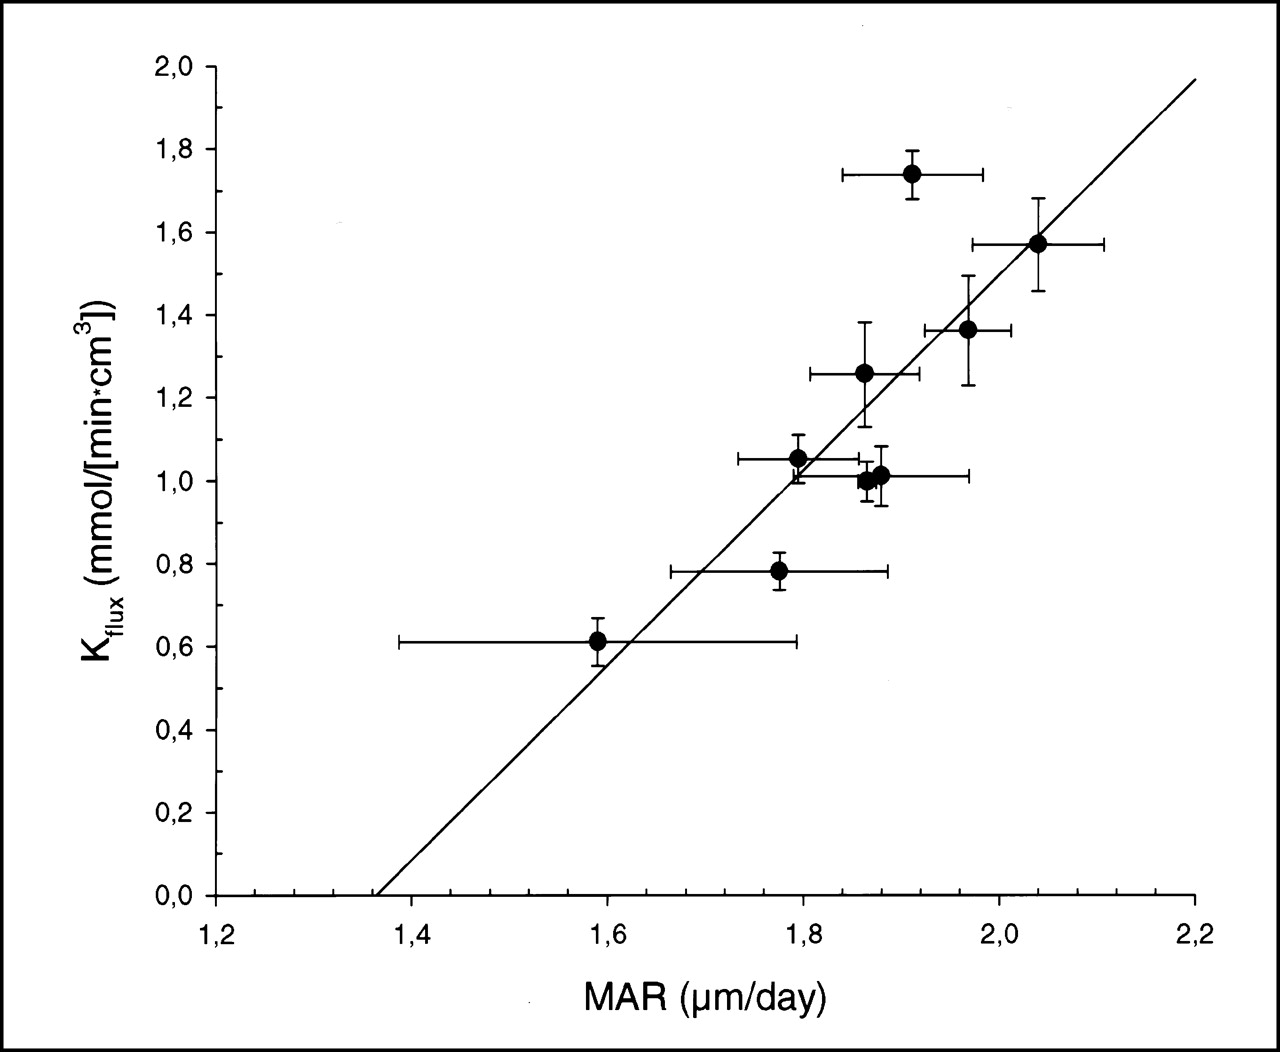
Data for the static and dynamic parameters of bone histomorphometry are listed in Table 3. We investigated the relationship between bone histomorphometric data and [18F]fluoride micro- and macroparameters. A significant correlation was found between the dynamic index of the MAR obtained from iliac crest bone biopsies and the Ki (y = −0.09 + 0.08x; r2 = 0.71; P < 0.005), Kflux (y = −3.1 + 2.23x; r2 = 0.65; P < 0.01), and Kpat (y = −0.06 + 0.06x; r2 = 0.51; P < 0.05). Figure 5 displays the relationship between MAR and fluoride volume flux (Kflux). An examination of the SD bars in Figure 5 shows that the intraindividual variation in MAR is generally higher than the variation in Kflux. The significant correlation between MAR and Ki, Kflux, and Kpat indicates that the [18F]fluoride ion influx obtained from nonlinear 3-compartment fitting and Patlak graphic analysis serves as a noninvasive estimate of bone formation. In addition, K1 (y = −0.18 + 0.15x; r2 = 0.62; P < 0.05) and f (y = −0.2 + 0.18x; r2 = 0.46; P < 0.05) correlated significantly with MAR, indicating that bone blood flow is related to bone formation in normal bone tissue. No other significant correlations between histomorphometric data and [18F]fluoride micro- and macroparameters or laboratory results were found.

Plot of MAR obtained from iliac crest bone biopsies versus fluoride volume flux (Kflux) in 9 mini pigs. Data represent mean of 20 sites of particular bone biopsy and 6 ROIs with their respective SDs as error bars in both directions (x- and y-axes). Linear regression analysis yielded highly significant correlation (y = −3.2 + 2.23x; r2 = 0.65; P < 0.01).
Histomorphometric Data
BMD Results
The BMD of trabecular and cortical bone of 6 lumbar vertebrae was measured in each of 5 animals. The mean BMD was determined to be 354.4 ± 34.3 mg CaHa per cubic centimeter of trabecular bone tissue and 443.6 ± 40.4 mg CaHa per cubic centimeter of cortical bone tissue. We performed correlational analyses between PET results and BMD measurements (average of the cortical and trabecular BMD obtained from the upper 2 lumbar vertebrae). No significant correlation was found between [18F]fluoride micro- or macroparameters and cortical or trabecular BMD in this small group of animals.
DISCUSSION
Skeletal uptake of bone-seeking radiopharmaceuticals such as 99mTc-labeled diphosphonates and [18F]fluoride ion depends on several factors, such as bone blood flow, the molecular size and net electric charge of the molecule, capillary surface, capillary permeability, local pH, and, most important, metabolic activity of the bone tissue (25–27). In contrast to anionic complexes such as 99mTc-labeled diphosphonates, the [18F]fluoride ion is small in size and is naturally incorporated into the bone matrix. The [18F]fluoride ion is extracted by bone tissue largely in proportion to bone blood flow. Previously, we determined the permeability–surface area product of [18F]fluoride in normal mini pigs to be 0.25 min−1, allowing a reliable blood flow estimation based on the microparameter K1 (15). The current study was undertaken mainly to investigate the relationship between bone metabolic activity, as indicated by bone histomorphometric data, and uptake of [18F]fluoride ion into normal bone tissue.
Bone histomorphometry is generally regarded as the gold standard in the investigation of bone formation (18). Bone histomorphometry provides several static parameters that are important in assessing the microarchitecture of bone. The dynamic parameter that quantitatively reflects bone formation and can be calculated from 2-dimensional estimators, as performed in this study, is MAR. Nevertheless, histomorphometry has several shortcomings. It is invasive and thus includes a risk of complications. Dynamic measurements are limited to in vivo labeling, and repeated measurements with repeated in vivo labeling procedures are necessary to monitor treatment effects quantitatively. The time-consuming and costly methodology is limited to specialized laboratories, and their histomorphometric estimates vary considerably across different sites of investigated bone tissue (3). Finally, significant inter- and intraobserver differences have been recognized (4). A noninvasive methodology that provides quantitative measurements of bone formation would, therefore, be highly desirable.
The mineral phase of bone functions as an amphoteric ion exchange. The anionic element [18F]fluoride, unlike cations, substitutes for the hydroxyl ions in the mineral phase (26). After extraction of [18F]fluoride into the bone tissue, a certain fraction of [18F]fluoride undergoes chemisorption onto hydroxylapatite, followed by a later exchange with hydroxyl groups in the hydroxylapatite to form fluorapatite (28,29). The relationship between the activity of osteoblasts and the activity of osteoclasts (bone formation and resorption) is believed to determine the amount of [18F]fluoride chemisorption and incorporation into the bone matrix. Therefore, measurement of [18F]fluoride ion influx with PET is an appealing concept for the noninvasive assessment of metabolic activity in bone tissues.
A relationship between uptake of bone-seeking tracers, such as 99mTc-labeled diphosphonates, and bone formation was recognized early (30–32). Like [18F]fluoride, 99mTc-labeled methylene diphosphonate (MDP) accumulates in bone because of both chemisorption of the diphosphonate onto the surface of the hydroxylapatite and incorporation into the crystalline structure of hydroxylapatite (33). Estimation of bone formation based on quantitative measurements of in vivo uptake of 99mTc-labeled MDP has been complicated by the limited spatial resolution of SPECT and by a possible dissociation of the technetium and MDP tracer in bone tissue (34).
A correlation between uptake of the [18F]fluoride ion into bone tissue and histomorphometric data was first sought by Reeve et al. (35). They found a significant correlation between initial fluoride uptake and Ca2+ influx. In addition, 2 dynamic histomorphometric indices correlated with fluoride uptake, that is, the fraction of osteoid taking up a double label and the bone apposition rate, revealing the close relationship between fluoride uptake and bone remodeling. Messa et al. (11) were the first to combine application of [18F]fluoride ion PET with bone histomorphometry in humans. These investigators evaluated bone metabolic activity in 8 patients with renal osteodystrophy and correlated the results with various histomorphometric indices. Although not all bone biopsies were obtained at the time of the PET scan (biopsy was performed within 1–4 mo of the PET study), Kpat correlated significantly with bone formation rate (r2 = 0.65), indicating that, indeed, [18F]fluoride ion influx is a noninvasive measurement of bone metabolic activity.
The current study is the first to evaluate the relationship between bone blood flow, estimates of the [18F]fluoride ion influx (Ki, Kpat), or estimates of volume flux (Kflux) and dynamic histomorphometric indices in normal bone tissue. The investigation of normal bone tissue is advantageous because specific disease-related variations in bone blood flow and bone metabolic activity interfere with histomorphometric indices, complicating interpretation of the data. Bone blood flow has also been related to bone formation. Using indicator dilution techniques, McInnis et al. (36) investigated bone blood flow and new bone formation in dogs and found a significant correlation between blood flow and endosteal bone formation in a bone defect model. The biomechanical quality of the bone is also related to regional blood flow (37). We found a significant correlation between MAR and both the microparameter K1 (reflecting bone blood flow and [18F]fluoride ion extraction) and the bone blood flow estimate, indicating that bone blood flow is indeed related to new bone formation in normal vertebral bone tissue. As shown in Figure 4, we found a highly significant linear correlation between bone blood flow and the fluoride influx rate (Ki). Figure 4 shows that bone blood flow and metabolic activity are closely linked in normal bone tissue. These results do not exclude a significant alteration of the observed linear relationship between bone blood flow and bone metabolic activity in pathologically altered bone tissue. In addition, an increase in bone blood flow caused by a general increase in cardiac output is probably not followed by a similar increase in bone metabolic activity. Therefore, reliable estimates of bone blood flow cannot be extrapolated from Ki values.
In this study, Ki, Kflux, and Kpat correlated significantly with MAR. Figure 5 shows that the fluoride volume flux (Kflux) correlated significantly and linearly with MAR (P < 0.01). The correlation was sufficiently strong for a noninvasive estimation of MAR based on Kflux values. Because the plasma fluoride concentration cannot be determined easily and is available only through specialized laboratories, the influx rate Ki may be used instead to estimate MAR. Although PET and CT measurements were performed on vertebrae, histomorphometric analyses were performed on biopsy samples of the iliac crest. In earlier experiments, we found no significant difference between histomorphometric estimates obtained from the iliac crest and histomorphometric estimates obtained from the lumbar vertebrae and, most important, the mean MAR was fairly similar in these 2 bone tissues. Although we cannot exclude differences between the MAR of the iliac crest and the MAR of the vertebral bodies in this study, it seems reasonable to assume that the MAR determined from the iliac crest serves as a valid measurement of bone formation in the vertebral column. The intraindividual variation of the Kflux values obtained from midsections of the vertebrae was smaller than the intraindividual variability of the MAR obtained from the iliac crest. This difference may be related to the known variability of histomorphometric indices obtained from the iliac crest (3) or to inherent methodologic errors (4).
Kflux, Ki, and Kpat are influenced by several parameters, such as the relationship between trabecular and cortical bone, the concentration of unlabeled fluoride in plasma, and the species investigated. Furthermore, a dramatic change in the permeability of bone capillaries, as is expected with bone repair (17), will alter the magnitude of bone metabolism. Therefore, fluoride ion extraction, chemisorption, and incorporation may change in bone tissues undergoing regeneration or degeneration, complicating bone blood flow and influx rate estimations with [18F]fluoride. Before [18F]fluoride ion PET can be used for absolute estimates of histomorphometric indices (such as MAR) in humans, the relationship between these parameters has to be defined under various pathologic conditions (such as low- and high-turnover bone diseases and bone repair).
Patlak graphic analysis has been widely used to determine the [18F]fluoride influx rate (Ki), facilitating regional quantification of skeletal [18F]fluoride uptake. Several studies reported excellent correspondence between Ki and Kpat values (10–11,13). The current study revealed the need to establish the correct interval for estimating the [18F]fluoride influx rate on the basis of the Patlak approach. We found a highly significant linear correlation between Ki and Kpat values (Fig. 3) using both intervals investigated (Kpat, 20–60 min; Kpat120, 40–120 min). Using a time frame of 20–60 min, the slope was 0.87, which was not significantly different from 1, but using a time frame of 40–120 min, the slope was 0.7, indicating a significant underestimation of Ki by Kpat120. None of the previous studies found an ideal slope of 1 between Ki by Kpat. A significant underestimation of Ki by Kpat (slope of 0.46) was also been found by Berding et al. (9), whereas Messa et al. (11) found an overestimation of Ki by Kpat (slope of 1.15) in renal osteodystrophy. These differences may be related to the method applied to determine Ki (linear (9) or nonlinear (10–11,13) fitting approach) or may be a result of the corrections applied to the data (inclusion (9–10,13) or exclusion (11) of a fractional BV) to estimate Ki.
In this study, estimates of Ki and Kflux were based on a 120-min scan. The current study revealed that the time frame used to estimate Kpat is important for estimating the fluoride influx rate. The importance of the time frame may be caused by the significant release of tracer from the bound tissue compartment that can become evident when a prolonged study protocol is chosen. The longer acquisition resulted in less variability in k4 estimates (mean coefficient of variation = 82%) than has been found by other [18F]fluoride ion PET studies of vertebral bodies (11–13). Nevertheless, estimates for k4 were consistently greater than 0. This finding violates the a priori assumption of the graphic Patlak method that no tracer is lost from the bound tissue compartment within the time frame measured.
Other possible reasons for the observed differences have to be considered. One possible explanation for differing measurements for the fluoride influx rate obtained from nonlinear fitting and the Patlak method can be a varying degree of inhomogeneity in the investigated bone tissues. Because the vertebral body of the mini pig consists of cortical and trabecular bone, the relationship between these 2 types of bone tissue, in addition to the amount of bone marrow present in each ROI, might have influenced estimation of the fluoride influx rate. These potential effects on the micro- and macroparameters of [18F]fluoride ion PET measurements have not been investigated. Therefore, these influences and species-related differences from humans have to be considered when results are compared across different [18F]fluoride ion PET studies.
Partial-volume effects may cause significant bias in the measured tracer concentration within an ROI in dynamic PET studies. Potential errors depend mainly on the size of the ROI compared with the actual size of the object and the spatial resolution of the scanner (38). Fortunately, we were able to use a high-resolution PET scanner with a spatial resolution of approximately 5-mm FWHM (NEMA performance standard) (24). Although scanner resolution decreases during dynamic data acquisition, the size of the ROI (1.1 cm2) was adequate to ensure accurate measurement of tracer concentration within an ROI. According to our CT measurements, the size of vertebral bodies in the adult mini pig exceeded the size of the ROI by more than twice the FWHM in the transaxial direction and by at least the FWHM in any other direction. In addition, slices directly above or below each intervertebral space were excluded; thus, spillover effects caused by intervertebral sections were avoided. We are therefore confident that the measured tracer concentration in the ROI accurately represents the actual tracer concentration within the object.
The mini pig is an accepted model for investigating bone metabolism (39). We chose to study mini pigs because their bone remodeling cycle is histologically similar to that of humans. Pigs also closely resemble humans in size, gastrointestinal function, and estrus cycle. On the other hand, pigs are quadrupeds and therefore have different loading patterns on the vertebral column. In addition, they have a higher bone mass and denser trabecular network than do humans (40). Therefore, species-related differences in regulation of bone metabolism and in the relationship between trabecular and cortical bone have to be considered when our results are compared with the results of human [18F]fluoride ion PET studies of the vertebral column. Still, the mini pig model is advantageous because the vertebral bodies of adult mini pigs are not much smaller than those of humans—a most important consideration in light of the resolution restrictions of dynamic PET studies.
In this study (5 experiments), the BMD of trabecular and cortical bone was determined for lumbar vertebrae using quantitative CT. Differences in the extent of partial-volume effects between PET and CT measurements might have influenced the reliability of the results. In general, partial-volume effects are much smaller in static CT imaging than in dynamic PET imaging. Although the 1.1-cm2 ROI for PET measurements was in the center of the vertebral body, the ROIs for determining cortical and trabecular bone density were in the outer rim and center, respectively. Because CT imaging revealed that an ROI in the center of a porcine vertebra consists of a significant amount of cortical bone, the PET results were compared with averaged BMD measurements of trabecular and cortical bone tissue in the particular vertebra. Therefore, an absolute coregistration of PET and CT measurements was not achieved. We found no significant correlation between any [18F]fluoride micro- or macroparameter and the cortical or trabecular BMD in corresponding midsections of the vertebrae. Even if a proper coregistration had been achieved, the observed interindividual variability of BMD and PET measurements was too small for detection of any significant correlation between BMD and [18F]fluoride ion uptake in this small group of animals. As this article describes, several factors determine uptake of the [18F]fluoride ion into bone. In adults, BMD is known to decrease with age in normal bone tissue as well as in diseased bone tissue. Therefore, a direct relationship between BMD and [18F]fluoride ion influx is not expected to be found in studies that investigate only a few subjects of a limited age range.
CONCLUSION
We conclude that [18F]fluoride ion PET can be used to estimate MAR, the important dynamic histomorphometric index, on the basis of Kflux and Ki and, with less accuracy, using the Patlak approach. In addition, the study revealed that bone blood flow is related to bone metabolic activity in normal vertebrae. Although bone histomorphometry can provide only a spatially limited view of the bone, with considerable variability in measurements, a larger proportion of the skeleton can be examined with dynamic PET. Being a noninvasive, nondestructive way to measure bone metabolism, [18F]fluoride ion PET is especially useful in follow-up studies to assess the effects of treating metabolic bone diseases and to determine blood flow and vitality in bone grafts and bone substitutes.
Acknowledgments
The authors thank the members of the PET facility and radiologic department of the University of Tübingen for their excellent and extensive support. The authors also thank Prof. Dr. Hans-Konrad Selbmann of the Institute of Medical Computing of the University of Tübingen for his assistance. This study was financially supported by Deutsche Forschungsgemeinschaft (Bonn, Germany) grants ZI 415/2-1 and PI 242/2-1 and the Fortüne project of the University of Tübingen.
Footnotes
Received Oct. 30, 2000; revision accepted Mar. 9, 2001.
For correspondence or reprints contact: Morand Piert, MD, Nuklearmedi-zinische Klinik, Klinikum rechts der Isar, Technische Universität München, Ismaninger Strasse 22, 81675 München, Germany.
REFERENCES
In this issue


Jump to section
Related Articles
Cited By...
- Is Response Assessment of Breast Cancer Bone Metastases Better with Measurement of 18F-Fluoride Metabolic Flux Than with Measurement of 18F-Fluoride PET/CT SUV?
- Quantification of 18F-Fluoride Kinetics: Evaluation of Simplified Methods
- Dynamic Bone Imaging with 99mTc-Labeled Diphosphonates and 18F-NaF: Mechanisms and Applications
- Semiautomatic Region-of-Interest Validation at the Femur in 18F-Fluoride PET/CT
- Molecular Mechanisms of Bone 18F-NaF Deposition
- Kinetic Analysis of 18F-Fluoride PET Images of Breast Cancer Bone Metastases
- Quantitative Radionuclide Studies of Bone
- Effects of Alendronate on Bone Metabolism in Glucocorticoid-Induced Osteoporosis Measured by 18F-Fluoride PET: A Prospective Study
- Long-Term Precision of 18F-Fluoride PET Skeletal Kinetic Studies in the Assessment of Bone Metabolism
- Characterization of Osteolytic, Osteoblastic, and Mixed Lesions in a Prostate Cancer Mouse Model Using 18F-FDG and 18F-Fluoride PET/CT
- Skeletal PET with 18F-Fluoride: Applying New Technology to an Old Tracer
- 18F-Fluoride PET for Monitoring Therapeutic Response in Paget's Disease of Bone
- Comparison of Different Quantitative Approaches to 18F-Fluoride PET Scans
- PET Imaging of Osteosarcoma
- Increased Sensitivity in Detection of a Porcine High-Turnover Osteopenia After Total Gastrectomy by Dynamic 18F-Fluoride Ion PET and Quantitative CT