


Abstract
The National Cancer Institute developed the Centers for Quantitative Imaging Excellence (CQIE) initiative in 2010 to prequalify imaging facilities at all of the National Cancer Institute–designated comprehensive and clinical cancer centers for oncology trials using advanced imaging techniques, including PET. Here we review the CQIE PET/CT scanner qualification process and results in detail. Methods: Over a period of approximately 5 y, sites were requested to submit a variety of phantoms, including uniform and American College of Radiology–approved phantoms, PET/CT images, and examples of clinical images. Submissions were divided into 3 distinct time periods: initial submission (T0) and 2 requalification submissions (T1 and T2). Images were analyzed using standardized procedures, and scanners received a pass or fail designation. Sites had the opportunity to submit new data for scanners that failed. Quantitative results were compared across scanners within a given time period and across time periods for a given scanner. Results: Data from 65 unique PET/CT scanners across 56 sites were submitted for CQIE T0 qualification; 64 scanners passed the qualification. Data from 44 (68%) of those 65 scanners were submitted for T2. From T0 to T2, the percentage of scanners passing the CQIE qualification on the first attempt rose from 38% for T1 to 67% for T2. The most common reasons for failure were SUV outside specifications, incomplete submission, and uniformity issues. Uniform phantom and American College of Radiology–approved phantom results between scanner manufacturers were similar. Conclusion: The results of the CQIE process showed that periodic requalification may decrease the frequency of deficient data submissions. The CQIE project also highlighted the concern within imaging facilities about the burden of maintaining different qualifications and accreditations. Finally, for quantitative imaging–based trials, further evaluation of the relationships between the level of the qualification (e.g., bias or precision) and the quality of the image data, accrual rates, and study power is needed.
Increasingly, 18F-FDG and other radiopharmaceuticals are being used as PET/CT quantitative imaging biomarkers in oncology to assess treatment efficacy (1–8). Although many factors, both physiologic and instrumental (9–12), influence quantitative accuracy, the ability to determine treatment efficacy on the basis of PET is predicated on the ability of PET scanners to provide stable measurements of radiotracer concentrations—thus allowing the treatment response to be tracked over months or years. Short-term scanner variability is expected to be low, and long-term scanner variability likely can be minimized with standardized quality control procedures (13,14). Recently, however, it was shown that long-term stability cannot be taken for granted and should be checked (15,16).
An additional complication arises when accrual for research trials is accelerated by expansion of imaging to multiple centers. Because of differences in procedures at imaging sites, some PET studies may not be quantitatively reliable or the data may not be usable in a pooled analysis. It has been reported that approximately one-third of PET studies acquired at community-based imaging facilities may lack the necessary information to obtain quantitative imaging data (17). In addition, quantitative variability in multicenter trials can be expected to be larger than that in single-center trials (18,19). In a study at a single institution with multiple PET scanners, which were clinically accredited and maintained in accordance with manufacturer standards by qualified staff, the variance of PET measurements was shown to be greater in clinical practice than under ideal study settings (20).
These reports of PET scanner bias and variability highlight the need for standardized qualification processes to minimize variability in multicenter research trials. However, the need to qualify imaging systems before participation in research trials increases the time needed to accrue trial data, because it takes time to acquire qualification data, send it to the study sponsor for analysis, and obtain approval to participate in the trial. Methods for the quantitative qualification of PET scanners include testing accuracy and basic image quality (21), prospectively assessing accuracy and contrast recovery, and developing scanner-specific reconstruction parameters to unify contrast recovery coefficients across scanners (22,23). These efforts have resulted in guidelines for tumor imaging using 18F-FDG PET in research trials (24–26).
On the basis of this understanding of the importance of the quantitative accuracy of imaging biomarkers in clinical trials, the National Cancer Institute developed the Centers for Quantitative Imaging Excellence (CQIE) initiative in 2010 to prequalify imaging facilities at all of the National Cancer Institute–designated comprehensive and clinical cancer centers for oncology trials using CT, MRI, and PET. The intention of the CQIE project was to establish a group of “trial-ready” cancer imaging facilities to minimize the time between a multicenter research trial being developed and sites beginning accrual. An overview of the CQIE program for all 3 imaging modalities is provided elsewhere (27). Here we review the CQIE PET/CT scanner qualification process and results in more detail.
MATERIALS AND METHODS
Study Time Frame
The CQIE data submissions occurred from June 2010 to March 2014. They were divided into 3 time periods: T0, T1, and T2. T0 was the baseline qualification submission and ran from June 2010 to December 2011. T1 and T2 were subsequent, approximately annual requalification submissions. T1 ran from January 2012 to December 2012, and T2 ran from January 2013 to March 2014.
PET Qualification Procedure
Sites were provided with detailed instructions and training modules. If necessary, test phantoms were provided. Sites were required to submit a series of 7 phantoms and sample patient images for review: a uniform phantom using a static body protocol, a uniform phantom using a static brain protocol, a uniform phantom using a dynamic body protocol, an American College of Radiology (ACR) phantom using a static body protocol, an ACR-approved phantom using a static brain protocol, 2 anonymized patient brain scan samples, and 2 anonymized patient body scan samples. In an effort to remain consistent with existing ACR Imaging Network (ACRIN) qualification and ACR accreditation programs, sites were requested to reconstruct all static body and brain images using their standard clinical reconstruction protocols.
Each site was requested to select 1 scanner for qualification. For the initial T0 qualification tests, imaging centers were given the option of an on-site visit by a member of the CQIE qualification team to facilitate scanning and qualification. Phantoms (if needed) and CQIE standard operating procedure materials were then forwarded to the site within 2 wk of the planned site visit. Methods for image transfer via secure file transfer protocol were also established at this time. Sites were encouraged to go online to complete a review of learning modules describing the importance of the program before their site visit. For the T1 and T2 qualification tests, there were no visits by members of the CQIE qualification team.
Uniform Phantom Data Acquisition and Analysis
The uniform phantom datasets were based on a standard fillable cylinder without features, nominally 20 cm in diameter and length. The uniform phantom was filled with a dilute 18F solution to a concentration of approximately 5.00–6.11 kBq/mL (135–165 nCi/mL). For the brain dataset, the phantom was scanned at 1 bed position using the site’s standard clinical brain acquisition and reconstruction protocols. For the body dataset, the phantom was scanned at 2 bed positions using the site’s standard clinical body acquisition and reconstruction protocols. The sites were asked to measure and report the SUV for a large central region of interest (ROI).
For the dynamic phantom study, because many sites do not routinely perform dynamic imaging, the site was required to scan the phantom using 1 bed position and a specific timing protocol. The data were then reconstructed with a protocol that likely would be used for dynamic scanning. The results from this component are reported elsewhere and are not further discussed here (27,28).
The uniform phantom images were transferred to a central core laboratory and imported into an OsiriX display platform (29) for analysis. For each phantom dataset, several fields in the DICOM (Digital Imaging and Communications in Medicine) headers were compared with the site-reported data forms to verify the accuracy of the SUV calculations. These fields included AcquisitionTime, Weight, RadiopharmaceuticalStartTime, and RadionuclideTotalDose. If these fields were found to be inconsistent, then the site was contacted and asked to clarify the discrepancy. Once any DICOM header discrepancies were resolved, a 200-cm2 (approximately 16 cm in diameter) circular ROI was placed on every axial slice in the phantom, and the mean and SD of the SUV for each voxel within the ROI were recorded. For the static brain and body phantoms, axial slices up to 1.5 cm from the axial edge of the field of view (FOV) or the edge of the phantom were excluded from the analysis because of the typical falloff at the axial edge of the FOV and potential edge effects near the ends of the phantom.
For the static body and brain protocol phantom acquisitions, a volume average SUV was computed from the average of the mean SUVs from each axial slice. The maximum axial deviation also was calculated by finding the difference between the maximum mean slice SUV and the minimum mean slice SUV and dividing that value by the volume average SUV. For a static uniform phantom dataset to pass the quantitative analysis, the volume average SUV had to be between 0.90 and 1.10 and the maximum axial deviation had to be less than 10%. If the results were outside these specifications, then the site was contacted to try to determine the reason for the failure and to resolve the problem.
ACR-Approved Phantom Data Acquisition and Analysis
The ACR-approved PET phantom (30) contains a series of 4 hot contrast cylinders with diameters of 8, 13, 17, and 25 mm, a length of 25 mm, and a nominal cylinder-to-background ratio of 4:1. The phantom was filled in accordance with standard instructions (30), assuming a patient dose of 444 MBq (12 mCi), and scanned using the same body and brain protocols as those used for the uniform phantom. The ACR-approved phantom was chosen for this study because it is a common phantom in use by many clinical centers, thus obviating the purchase of a more complicated phantom.
In addition to the phantom datasets, sites were required to submit 2 anonymized patient brain scans and 2 anonymized patient body scans. The patient test cases were acquired with the sites’ standard clinical protocols. In addition, the image acquisition and reconstruction parameters used by the sites were recorded.
The ACR-approved phantom data were transferred to a central core laboratory and imported into OsiriX for analysis. The same comparison of DICOM headers as that done for each uniform phantom dataset was done for each ACR-approved phantom dataset. The SUV analysis was done in accordance with ACR instructions. First, image planes were summed together to form images that were between 9 and 12 mm thick. The slice that best showed the 4 hot cylinders was selected, and circular background and small cylinder ROIs were drawn; the background ROI was about 6–7 cm in diameter in the center of the image, and the small cylinder ROI was drawn just inside the largest hot cylinder. Copies of the small ROI (<25 mm in diameter) were drawn over the other hot cylinders and over the air, water, and bone cylinders. As part of the core laboratory analysis, we also recorded the SUVpeak measurement for each hot cylinder. The SUVpeak was defined as the average SUV in a 1.0-cm-diameter circular ROI centered on the maximum pixel in each cylinder. The recovery coefficients (ratio of measured SUV to true SUV) for the hot cylinders were plotted as a function of the cylinder diameters.
Patient Test Case Analysis
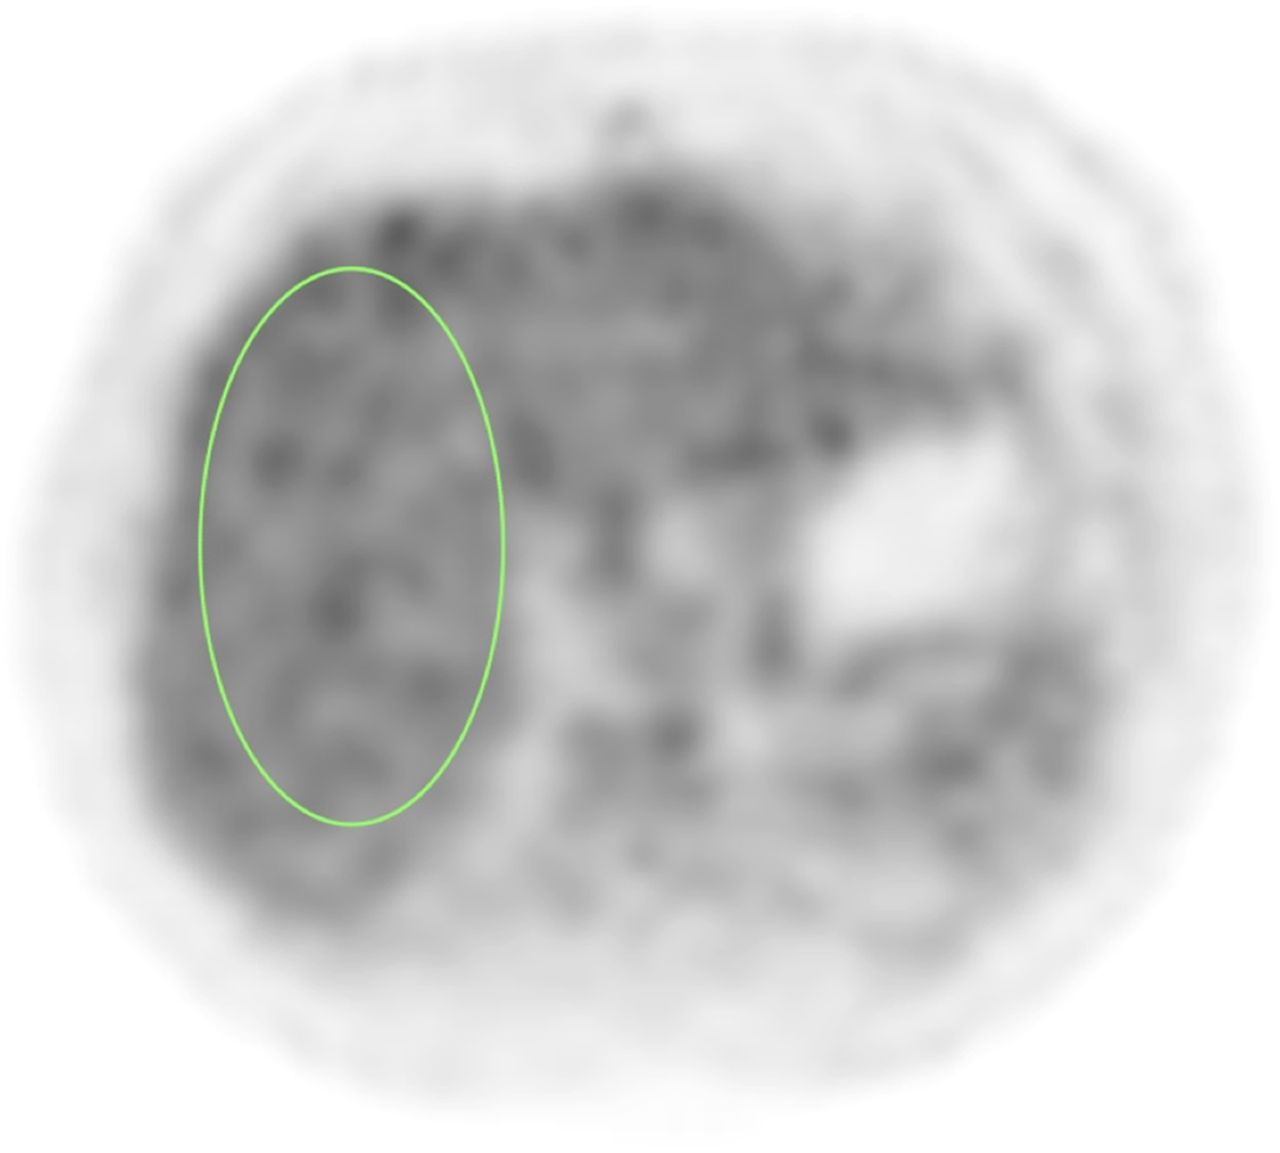
For the patient brain and body test cases, the DICOM headers were reviewed for accuracy and compared with the data forms. Any discrepancies were investigated with the site to determine the source of the discrepancies. Once any discrepancies were resolved, a qualitative review of overall image quality was performed. The fusion between the PET and CT images was checked, the patient positioning in the FOV was evaluated, and the appropriateness of the acquisition and reconstruction settings was evaluated on the basis of the overall qualitative smoothness of the PET images. For the brain test cases, SUVs were not recorded, but the ability to measure SUVs was verified. For the body test cases, SUV analysis of the liver was performed. A large, 2-dimensional, elliptic ROI was drawn on 7 consecutive transverse slices through the middle of the liver, as shown in Figure 1. The SUVmean for each 2-dimensional ROI was recorded, and an area-weighted average of the means was computed to determine the average liver SUV for each test case.

Image of 1 of 7 adjacent ROIs in liver regions used in body test cases.
Qualification Summary Comparisons of T0 and T2
For all of the T0 scanners reviewed, we determined how many scanners passed the qualification review without any failure or intervention from the core laboratory, with a single failure, or with multiple failures. A failure was considered any issue that prevented the scanner from passing the qualification review without involvement of the CQIE. The reasons for failures also were cataloged. They were divided into the following categories: uniformity problem, SUV outside specifications, phantom filling issue, reconstruction problem, improper acquisition, incomplete submission, and problem with data forms.
The same analysis of qualification results was performed for T2 scanners that had also submitted data at T0.
RESULTS
Accrual
During the T0 period, a total of 65 PET scanners underwent CQIE testing. Most of the sites opted for on-site visits by the PET CQIE team.
During the T1 period, sites that participated in the T0 period were sent reminders that requalification was needed. No specific follow-up was undertaken. In addition, no on-site visits were provided, and sites were not given access to funds to defray costs associated with scanner qualification. Site participation decreased dramatically in year 2 relative to year 1. The year 2 participation rate dropped to 39 scanners; for some of these, data were not submitted for the T0 time period. The T2 participation rate increased to 52 scanners; for 44 of these, data were submitted for the T0 time period. Because of poor data accrual during the T1 period, only data from the T0 and T2 periods are reported.
Data from 65 unique PET/CT scanners at 56 sites were analyzed for the T0 period. Data for 1 of the 65 scanners could not be reviewed because the images could not be submitted in the DICOM format. For the T2 period, data from the 44 PET/CT scanners that had also submitted data for the T0 period were analyzed.
Uniform Phantom Results
An example of a plot of the SUVmean for each image plane is shown in Figure 2, illustrating the calculation of the maximum axial deviation (MAD). The MAD is a surrogate for evaluating the quality of system normalization. In our experience at the University of Pennsylvania, we have found that renormalization decreases the MAD and improves the flatness of the “axial” profile. Also shown are a typical falloff of the SUVmean per image plane at the axial ends of the FOV and the region included in calculation of the MAD.

(Left) Typical ROI used for uniformity analysis. (Right) Example of typical plot of mean SUVs per plane in ROI and calculation of maximum (max.) axial deviation (dev.) (MAD).
For the uniform phantom, the average SUV and MAD results obtained for static brain and body protocols during the T0 time period are summarized in Tables 1 and 2.
Uniform Phantom Results for Static Brain Protocol During T0 Period
Uniform Phantom Results for Static Body Protocol During T0 Period
ACR-Approved Phantom Results
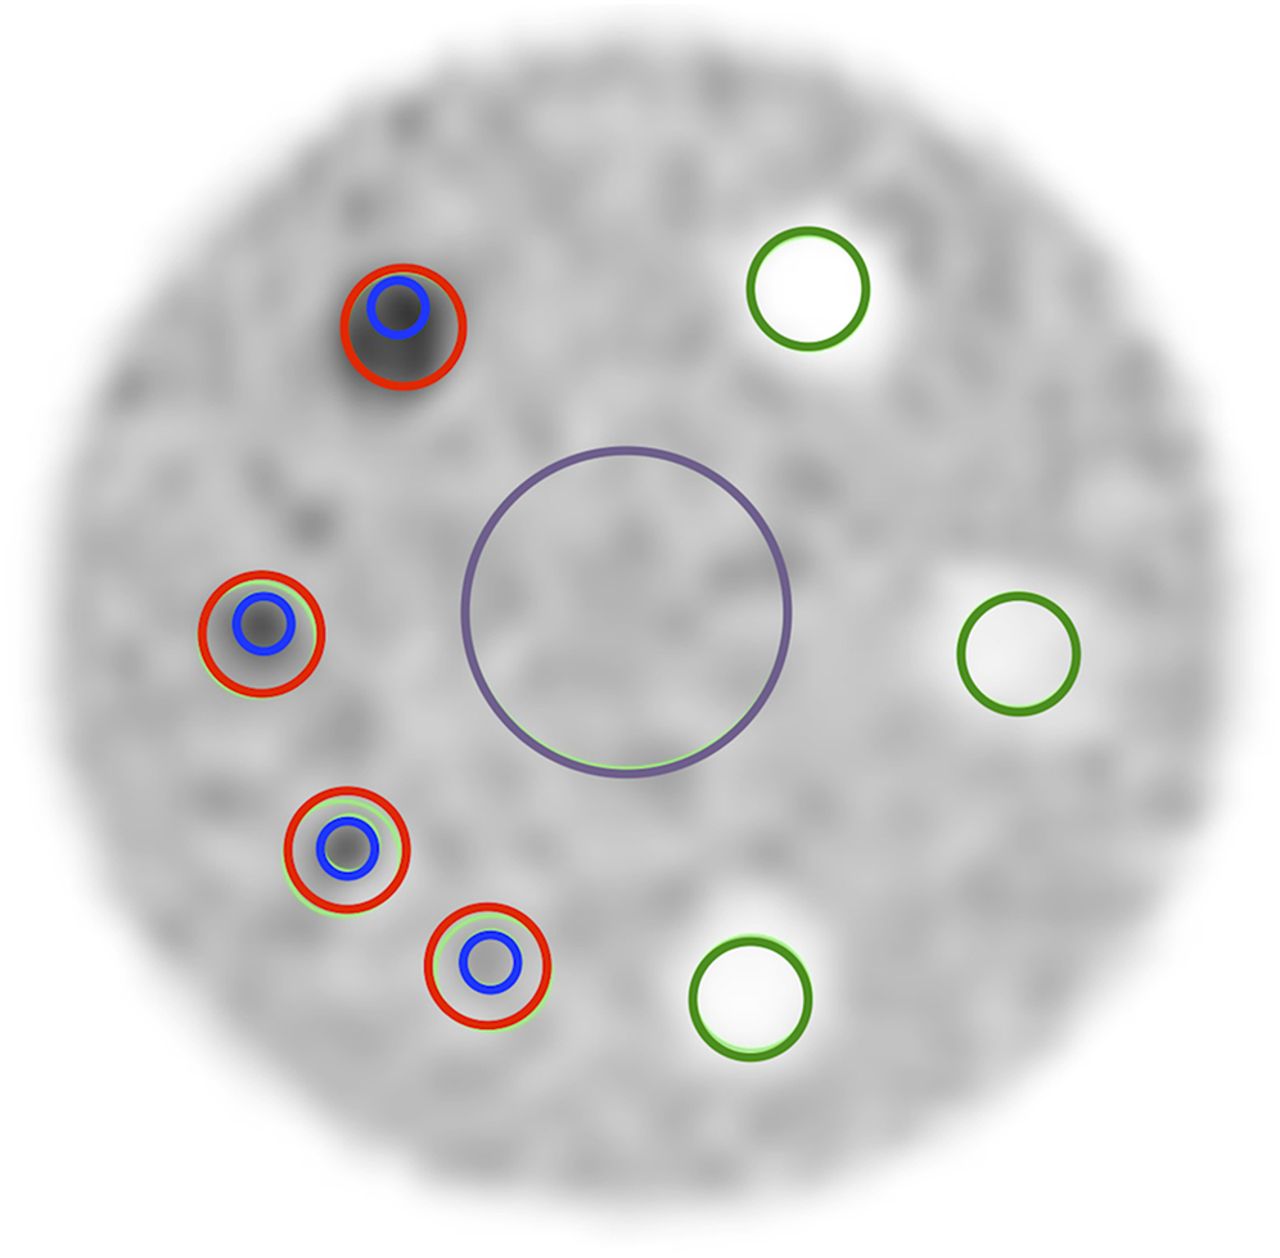
Figure 3 shows a typical image of the ACR-approved PET phantom showing the ROIs used for analysis. The contrast recovery coefficients plotted as a function of the cylinder diameters for static brain and body acquisitions with each of the 3 PET scanner manufacturers are shown in Figure 4. The error bars represent the SD for each data point.

Image of ACR-approved PET phantom. Red ROIs are used for SUVmax, and blue ROIs are used for SUVpeak. Also shown are large background ROI (purple) and smaller green ROIs for cold cylinders. Latter ROIs were not used in this analysis.
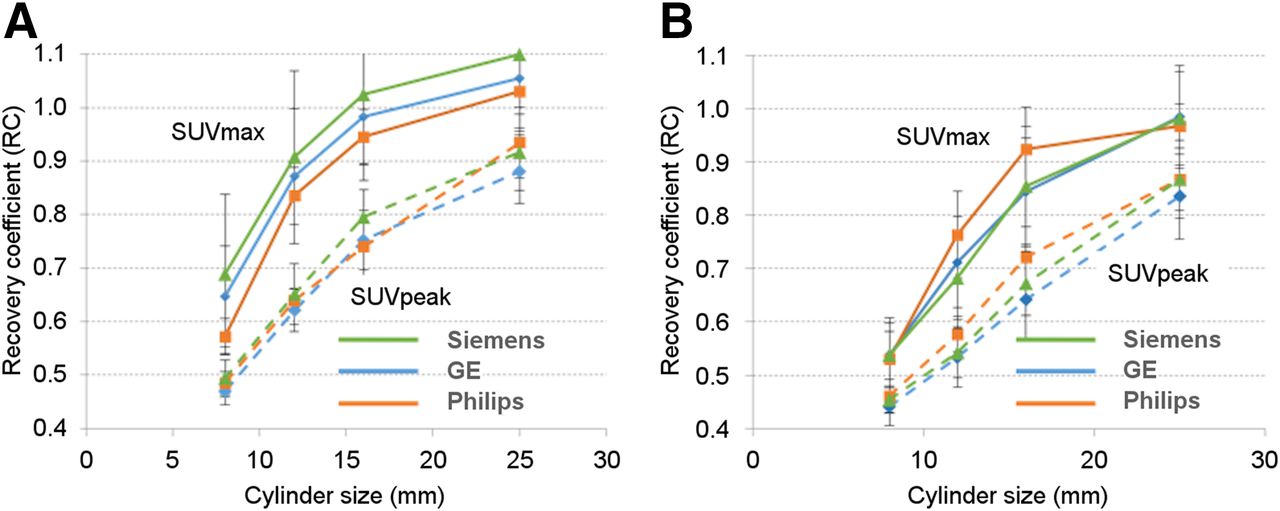
Recovery coefficients (defined as ratio of measured SUV to true SUV) as function of cylinder diameters for static brain (A) and body (B) acquisitions.
Brain Test Case Results
In some cases, a field in the DICOM header was not properly populated; this problem prevented SUV calculation. The most common reasons for this problem were that the anonymization routine removed a required field, the operator did not enter a required data field in the acquisition interface, and a required DICOM field was changed or removed at some point in the processing.
Body Test Case Liver SUVs
Table 3 shows the liver SUVs for the body test cases during the T0 period; there appeared to be a divergence of average liver values between manufacturers. Despite careful evaluation of all aspects of the image acquisition protocols and processing chain, no systematic cause was found.
Average Liver SUVs by Manufacturer
Comparisons of T0 and T2
For the T0 period, 25 scanners (38%) passed without any core laboratory intervention, 30 scanners (46%) passed after the second submission, and 9 scanners (14%) required more than 2 submissions to pass (Table 4). The most common problems were SUV outside specifications and incomplete submission (Table 5). For the 50 issues that were cataloged, 21 likely were linked to system calibration problems (uniformity problem and SUV outside specifications). The remaining 29 issues were related to operator error. The total number of issues was not the same as the number of scanner disqualifications because some qualification attempts had multiple issues.
Differences in Scanner Qualifications for 3 Time Periods
Frequencies of Specific Issues During Scanner Qualification*
For the T2 period, data were submitted for 44 scanners that had also submitted data during the T0 period. All 44 scanners eventually passed the qualification review; 31 passed without any CQIE core laboratory intervention. Table 6 shows a comparison of T0 and T2 results after the initial review in the core laboratory. Eleven of 17 scanners that passed initially during T0 passed without any intervention during T2. Twenty of 27 scanners that initially did not pass during T0 passed without any intervention during T2.
Cross-Comparison of Passing Status on Initial Review for T0 and T2 Periods for 44 Scanners That Had Submitted Data for Both Qualification Reviews*
DISCUSSION
Our primary finding was that there was a lower frequency of qualification issues during the T2 period than during the T0 period (Tables 4–6). These data indicate that a consistent scanner qualification process helps to ensure standardized scanner performance throughout the entirety of a trial. In the T0 period, 50 issues were identified with the data submissions for the 65 scanners. Quantification problems, which can be due to system calibration problems, accounted for 21 of the 50 issues (42%). The other 29 issues (58%) were attributed to user error, which should be reduced by training. In the T2 period, only 14 issues were identified with data submissions for 44 scanners; 3 of the 14 (21%) were due to quantification problems, and the remaining 11 (79%) were attributed to user error. The lower overall rate of issues with submissions in the T2 period likely indicates that the sites better understood the submission process and were more comfortable with the requirements, so that fewer mistakes and omissions occurred. The lower rate of quantification problems may also indicate that the sites were more familiar with the analysis performed in the core laboratory and the passing criteria used, so that they were less likely to submit data that failed their internal analyses. Understanding the data analysis and passing criteria may also have made the sites more sensitive to changes in performance and more likely to address potential problems with quantitative imaging sooner. However, the fact that approximately 7% of the scanners (3/44) had quantification issues that required recalibration suggests the need for periodic requalification.
The quantitative phantom results were mostly consistent between manufacturers. The uniform phantom results showed the average SUVs to be within 1 SD of the expected value of 1. The MAD for the body FOV cylinders was consistent between manufacturers, but for the brain FOV cylinder, the MAD for the Philips system was higher than that for the other 2 manufacturers. This finding may have been related to the lack of postprocessing smoothing, which is used by GE and Siemens but not by Philips. The ACR-approved phantom results for both brain and body were consistent between manufacturers. There were some differences between manufacturers, as shown in Figure 4, but the differences were within the error bars. In general, the quantitative differences between manufacturers were small.
For the current project, the inclusion of the ACR-approved phantom did not appear to add value to the qualification process, because all scanners that passed the uniform phantom analysis passed the ACR-approved phantom analysis, unless there was a phantom filling problem. This finding could have been due to the relatively wide acceptance criteria currently used for standard ACR submissions of clinical PET scanners, which were adopted for CQIE qualification. It may be appropriate to use narrower acceptance criteria for the ACR-approved phantom to better assess differences in contrast recovery that may arise from different reconstruction parameters. This discussion highlights an unresolved issue: Although it is clear that some level of qualification and routine quality assurance/quality control (QA/QC) should be included in clinical trials using quantitative imaging, the relationships between the type and degree of the qualification (and QA/QC procedures) and the quality (e.g., bias or precision) of the image data have not been established. Thus, if a higher degree of variance or bias in imaging data could be tolerated without study power being affected, then imaging-based trials might use excess resources for qualification and QA/QC to improve data quality unnecessarily or, alternatively, sites might be excluded unnecessarily—in turn, slowing down accrual. However, the opposite scenario is also possible; less rigorous qualification and QA/QC policies might allow for increased accrual rates, but at the cost of underpowering a study because of increased signal variation. Optimizing QA/QC procedures for imaging trials can, in theory, shift the power or accrual rate–versus–cost curve substantially toward better optimization of imaging trials. More evaluation of these trade-offs affecting accrual and study power is needed.
The CQIE project was affected by a lack of accrual during the T1 period. This lack of accrual may have been due to some imaging facilities giving the CQIE qualification a low priority, leading to an increased number of incomplete or faulty submissions and difficulty resolving issues. During the T2 period, the CQIE program intensified the requests for qualifications, leading to increased accrual. These issues also applied to the MRI and CT CQIE qualifications and are discussed in more detail in the CQIE overview (27).
Some sites also expressed hesitation to commit to another qualification regimen because of the time required to maintain other qualifications and accreditations, such as those from the ACR, Eastern Cooperative Oncology Group (ECOG)–ACRIN, Society of Nuclear Medicine and Molecular Imaging (SNMMI), and individual study sponsors. Committing to another qualification program was seen as overly burdensome.
The ACR, ECOG-ACRIN, SNMMI, and CQIE programs all require sites to submit phantom and patient image data to a core laboratory for analysis. The ACR and SNMMI programs require a fee to be paid for accreditation/qualification, but the ECOG-ACRIN and CQIE do not require a fee for qualification. The ECOG-ACRIN uses a uniform phantom, which should be provided by the manufacturers of all scanners, for qualification. The ACR and SNMMI use more complicated resolution phantoms; the ACR uses a cylindric phantom with fillable cylinders attached to the lid, and the SNMMI uses a chest simulator phantom that is more anthropomorphic and has spheres embedded throughout.
Unifying qualification and accreditation criteria between qualifying agencies and clinical research organizations would likely require the adoption of different levels of qualification. Depending on the specific aims of a given trial, more or less variability might be acceptable and would require more or less rigorous scanner qualification. Unifying qualification programs would require the adoption of standard uniformity and contrast phantoms industry-wide and agreement on filling and scanning procedures, analysis methodology, and passing criteria. Given the time and resources already invested into various qualification and accreditation programs, it will be difficult to develop a single qualification methodology acceptable to all organizations. However, if research organizations were more transparent about their qualification programs, including specifics about the analyses being performed and passing criteria, other organizations could more easily evaluate the qualification needs for their trials, compare the rigorousness of various qualification programs, and choose to accept specific organizations’ qualification processes.
CONCLUSION
The results of the CQIE process showed that periodic requalification may decrease the frequency of deficient data submissions. The results suggested that, as sites become more aware of the qualification process and passing criteria, they will be more likely to address problems before submitting qualification data to a core laboratory or study sponsor.
The CQIE project also highlighted the concern within imaging facilities about the burden of maintaining different qualifications and accreditations. Discussions with personnel at various facilities emphasized the need to develop a common set of qualification criteria across various research organizations to reduce the burden on imaging facilities of participating in many different clinical trials. Accomplishing this goal may encourage facilities to participate in a larger number of multicenter clinical trials.
Finally, for quantitative imaging–based trials, further evaluation of the relationships between the level of the qualification (e.g., bias or precision) and the quality of the image data, accrual rates, and study power is needed.
DISCLOSURE
This work was supported in part by NCI–SAIC subcontract 10XS070; NIH grants U01CA148131, U01CA190254, and U10CA180820; and NIH–NCI contract HHSN261200800001E. No other potential conflict of interest relevant to this article was reported.
Acknowledgments
We gratefully acknowledge the following individuals for their time and effort in support of this publication: Mark Rosen, Deborah Harbison, Joseph Maffei, Mark Muzi, Finbarr O’Sullivan, Brian Elston, Darin Byrd, and Mattie Lloyd.
Footnotes
Published online Mar. 2, 2017.
- © 2017 by the Society of Nuclear Medicine and Molecular Imaging.
REFERENCES
- Received for publication November 9, 2016.
- Accepted for publication February 8, 2017.


