


Abstract
With a large database, we aimed to evaluate sex-specific distinctive changes in brain glucose metabolism and morphology during normal aging using MRI and 18F-FDG PET. Methods: A total of 963 cognitively healthy adults were included in this study. All subjects completed a medical questionnaire, took the mini-mental state examination, and underwent brain MRI and whole-body 18F-FDG PET. The MR and PET images were statistically analyzed using 3-dimensional stereotactic surface projection. All images were corrected for whole-brain pixel value to identify the brain regions with significant changes, and regions of interest were set up with reference to Brodmann areas. We evaluated morphologic and glucose metabolic changes by cross-sectional analysis. The baseline database consisted of subjects from 30 to 40 y old, and the age-step for comparison was 5-y ranges. We also compared sex-specific differences in MR and PET images in each age group. Results: Regarding age-related changes, in both sexes brain atrophy was observed in the lateral frontal and parietal regions and glucose hypometabolism in the medial frontal regions. There were significant differences in these parameters between the sexes; parallel changes in volume and metabolism were manifested in the medial frontal cortex in men and in the lateral and medial temporal cortex in women. By contrast, metabolism-dominant reductions were manifested in the lateral and medial parietal cortex in men and in the ventrolateral prefrontal cortex, including the Broca area, in women. These differences became insignificant in individuals 66 y or older. Conclusion: Our brain mapping study with a large number of reference human brain data demonstrated age-related parallel changes between morphology and metabolism in the medial frontal regions and sex-specific hypometabolism in the parietal (male) and ventrolateral prefrontal (female) cortices. These findings may suggest an aging vulnerability in sex-specific brain regions: the parietal cortex for visuospatial ability in men and the Broca area for speech processing in women.
The current trend of an increase in the number of dementia patients, including those with Alzheimer disease (AD) (1), as well as the revised criteria for the diagnosis of dementia by the National Institute on Aging and the Alzheimer’s Association (2–5), has brought researchers to place greater attention on early, preclinical, detection of changes in brain physiology. Indeed, in familial AD, pathologic changes in the brain seem to develop 25 y before the onset of clinical symptoms (6).
To detect the preclinical stage of AD, it is necessary to catch subtle deviations from the healthy brain and, thus, to know the morphology and activity of a healthy brain for comparison. Several studies have used MRI or PET on cognitively normal people to evaluate age-related changes and sex-specific differences in the brain. To the best of our knowledge, however, the sex-specific differences in brain morphology and metabolism found by previous brain imaging studies were only in conjunction with different psychologic responses (7–10). Simple correlation analyses might have been difficult to perform because of the limited number of samples. Therefore, we used a large MRI and PET database of about 1,000 cognitively normal adults to evaluate, in greater detail, age-related changes and subtle sex-specific differences in brain morphology and glucose metabolism.
MATERIALS AND METHODS
Subjects
The current study was approved by the Institutional Review Board of Hamamatsu Medical Photonics Foundation, and written informed consent was obtained from each participant after a detailed explanation of the study. A total of 963 cognitively normal, healthy adults ranging in age from 32 to 87 y were included in this study (493 men [mean age ± SD, 54.0 ± 10.2 y] and 470 women [53.4 ± 9.9 y]) (Table 1). Psychologic testing, blood testing, and MRI verified that all subjects were cognitively normal and free of major illness. Several candidates were excluded because of incidentally identified cancer or brain abnormalities. The degree of cigarette and alcohol use by the subjects was within the usual range in this population. As shown in Table 1, 10%–20% of participants were taking oral (not intravenous or subcutaneous) medication.
Subject Demographics
MRI Scan
MRI was performed on a 1.5-T Signa Excite HD scanner (GE Healthcare). Three-dimensional structural MR images were acquired using a T1-weighted spoiled gradient echo sequence (repetition time, 25 ms; echo time, 6 ms; flip angle, 30°; number of excitations, 0.75; field of view, 24 cm; matrix size, 256 × 192; number of slices, 128; slice direction, sagittal [anterior commissure–posterior commissure line was horizontal in the sagittal image]; slice thickness, 1.5 mm).
18F-FDG PET Scan
18F-FDG PET images were obtained using a high-resolution PET scanner (SHR-92000; Hamamatsu Photonics K.K.) (11). The subjects fasted for at least 5 h before the examination, and a 3.0 MBq/kg dose of 18F-FDG was injected thorough the cubital vein. After each subject had rested in a dimly lit room for 50 min, emission scanning was performed for 15 min. A dynamic row-action maximum-likelihood algorithm was used for image reconstruction, and a CT scanner (GE Healthcare) was used to obtain images for attenuation correction (12). The matrix was 192 × 192 × 60, the pixel size was 3.2 × 3.2 × 3.2 mm, and the slice thickness of the head area was 3.2 mm/pixel.
Normalization of MR and PET Images
Three-dimensional stereotactic surface projection (3D-SSP) (NEUROSTAT) was used for the main statistical analysis of the MR and PET images (13). In the MR images, Matlab (version 7.8 [R2009a]; The MathWorks, Inc.) and statistical parametric mapping (SPM, version 8) were used to realign and segment gray matter and white matter. Afterward, the gray matter MR images and the PET data were processed with spatial smoothing (9 mm in full width at half maximum) and 3D-SSP normalization. Next, brain surface projections of MRI and PET were obtained. Finally, all images were corrected for whole-brain pixel value to identify brain regions that had an increased degree of change in comparison with the whole brain.
Reference Database
To generate baseline images for the brain surface projections, we created 4 types of database: male MRI, female MRI, male PET, and female PET. As shown in Table 1, the male baseline databases comprised 40 cognitively normal subjects aged 30–40 y (mean, 38.0 ± 2.4 y), and the female baseline databases comprised 33 cognitively normal subjects aged 30–40 y (mean, 38.1 ± 2.0 y). The lowest number of subjects in the year-based groups was 23 in women older than 70 y.
Statistical Analyses Using 3D-SSP Images
We obtained the z maps of all subjects by using a z score 3D-SSP protocol. For the MRI and PET brain surface projections, we made comparisons with the male and female databases. In the visual assessment of brain morphology and glucose metabolism, mean z maps and sex-specific t maps were used. For age-related changes, mean z maps classified by 5-y ranges were used. For sex-specific differences, t scores relevant to both sexes were calculated by t testing in every pixel of the brain surface projections. In the generation of 3D-SSP images, correction for multiple comparisons was used with the familywise error rate, and a t score was considered significant at the P < 0.05 level. The sexes were compared using 5-y-range groups.
Brain-Region Analysis
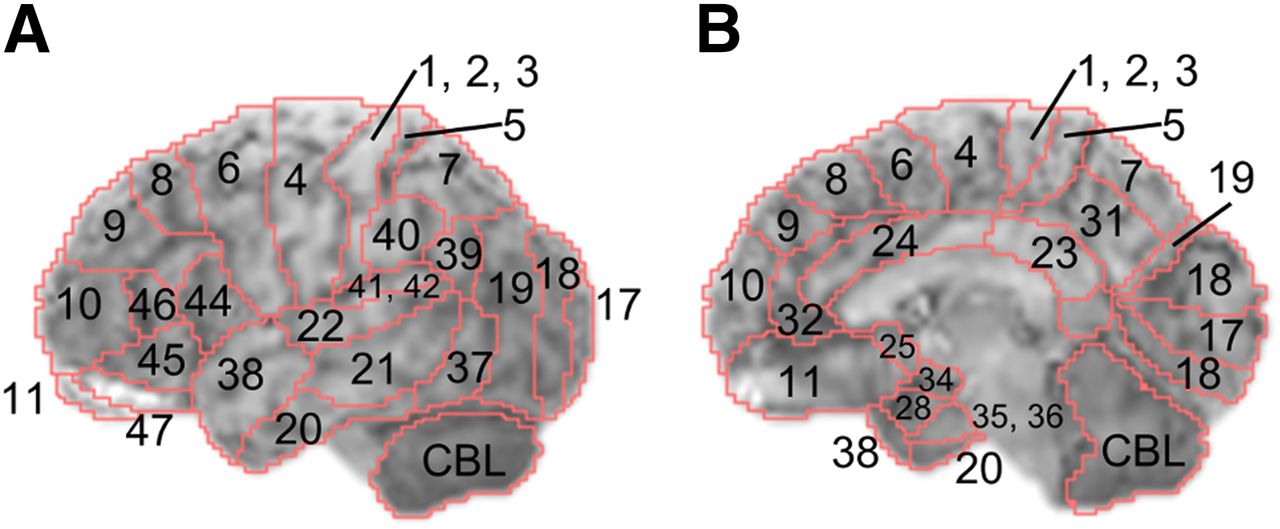
For quantitative assessment of brain morphology and glucose metabolism, we used the brain surface images that had been spatially normalized and then corrected for whole-brain pixel value. Regions of interest were set up with reference to Brodmann areas (BAs), which have been described in detail elsewhere (Fig. 1) (14). For age-related changes, the mean pixel values in each BA on the MR and PET images were calculated for men and women. The correlation between age and mean values in BAs was determined, and the Pearson correlation coefficients were transformed into t scores. For sex-specific differences, t scores relevant to both sex groups were calculated by t testing in every BA. The Bonferroni test was used for correction in multiple comparisons, and the significance level was set at a P value of less than 0.05.

BAs on 3D-SSP template images based on a previous report (14). Each BA was segmented on brain surface projection atlas (MRI template) of 3D-SSP tools. In this report, right/left hemispheres and lateral/medial cortices were distinguished and analyzed individually. Figures denote left lateral (A) and right medial (B) brain regions.
RESULTS
The age-based 3D-SSP analyses showed both sexes to have similar age-related changes (increasing atrophy and hypometabolism in subjects ≥ 46 y) (Fig. 2). Age-related brain atrophy (red in Fig. 2) extended laterally to the frontal, temporal, parietal, and occipital lobes. On the medial side of the brain, age-related glucose hypometabolism (green) was predominantly in the prefrontal cortex (BAs 8, 9, and 10). In addition, parallel declines in both brain atrophy and glucose hypometabolism (yellow) were observed in the anterior cingulate gyrus (BAs 24 and 32). These parameters differed significantly between the sexes, with parallel changes in volume and metabolism (yellow) being manifested in the medial frontal cortex (BAs 8, 9, and 24, implicated in error processing and performance monitoring (15)) in men and in the lateral and medial temporal cortex (BAs 20, 21, 22, and 38, implicated in emotional valence (16)) in women (Fig. 3). By contrast, metabolism was reduced (green) in the lateral and medial parietal cortex (BAs 5, 7, and 31, implicated in visuospatial salience (17)) in men and in the ventrolateral prefrontal cortex, including the Broca area (BAs 44 and 46, implicated in predictive and integrative speech processing (18)), in women (Fig. 3). These differences became insignificant in individuals 66 y or older.
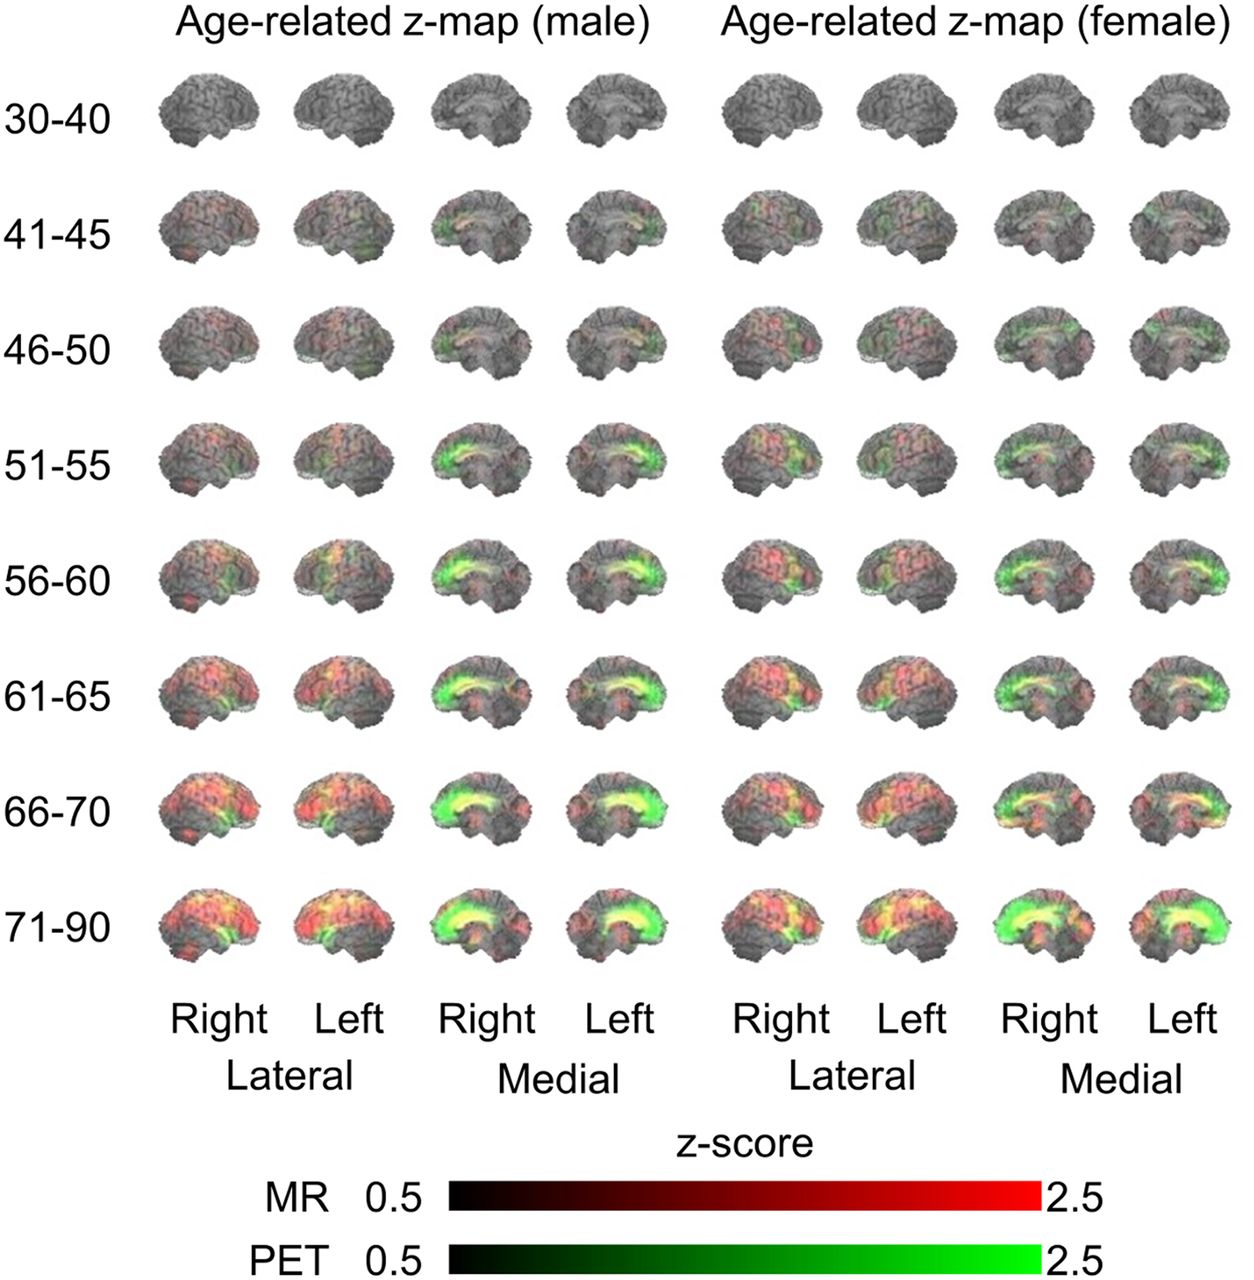
Age-related changes in 3D-SSP z scores of men and women in different age groups. Red and green indicate reductions in levels of MRI and PET values, respectively. Yellow denotes mixture of MRI (red) and PET (green) values, indicating parallel change.
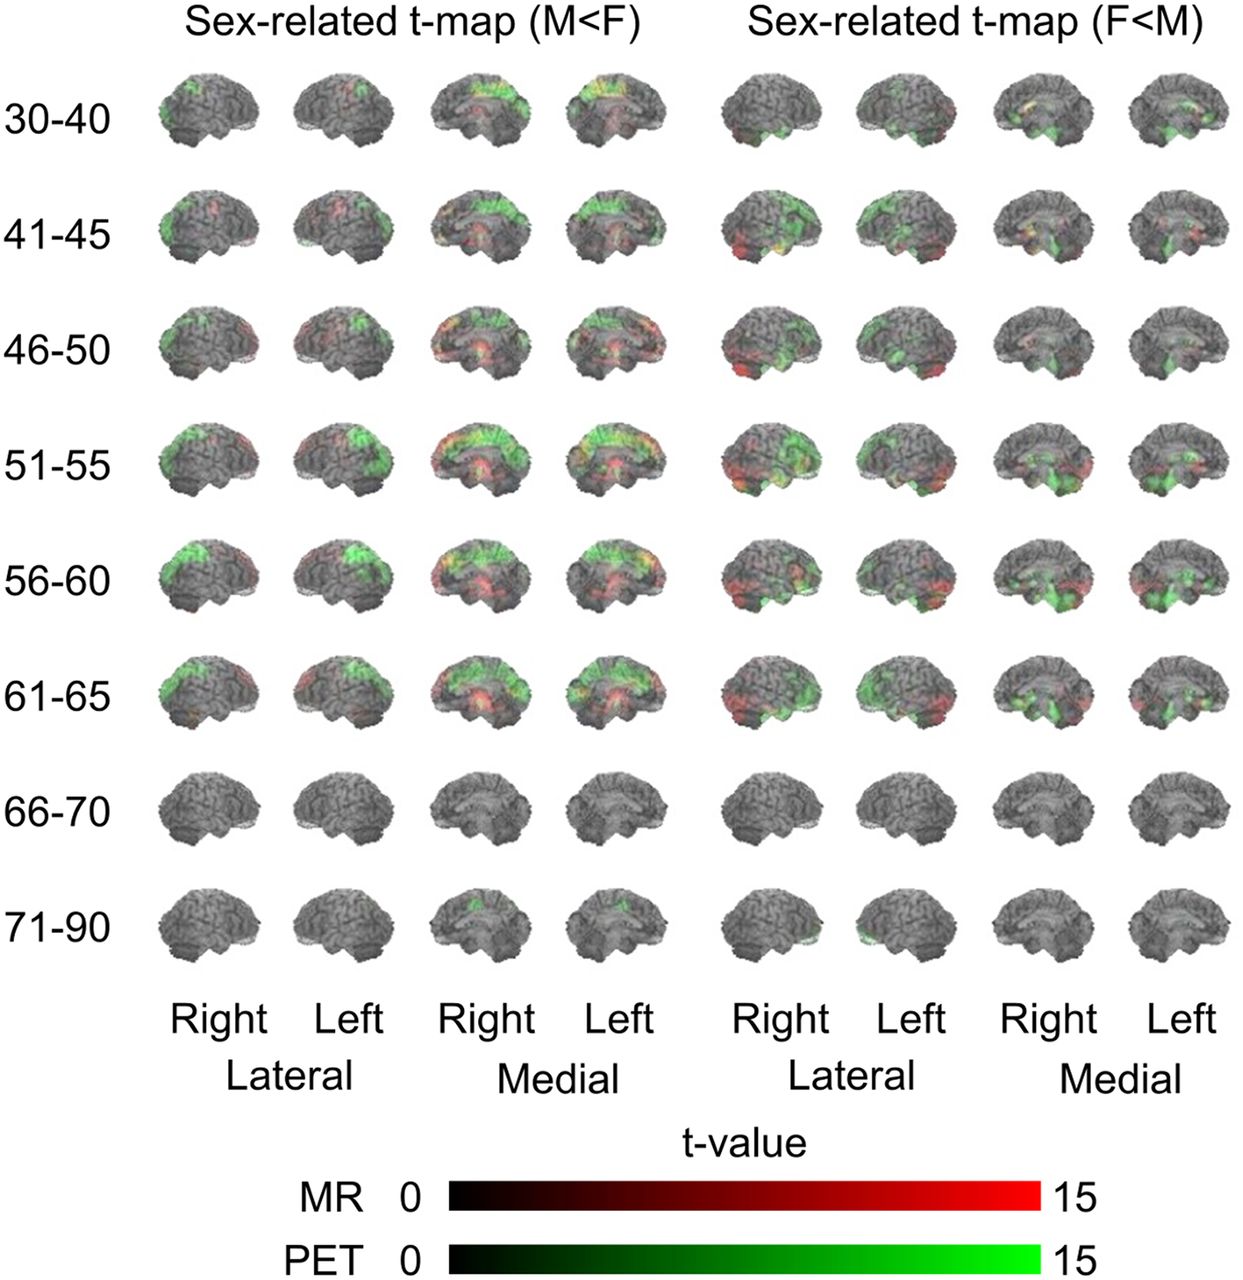
Sex-specific differences in 3D-SSP t scores (male < female and female < male) in different age groups. Red and green indicate reductions in levels of MRI and PET values, respectively. Yellow denotes mixture of MRI (red) and PET (green) values, indicating parallel change.
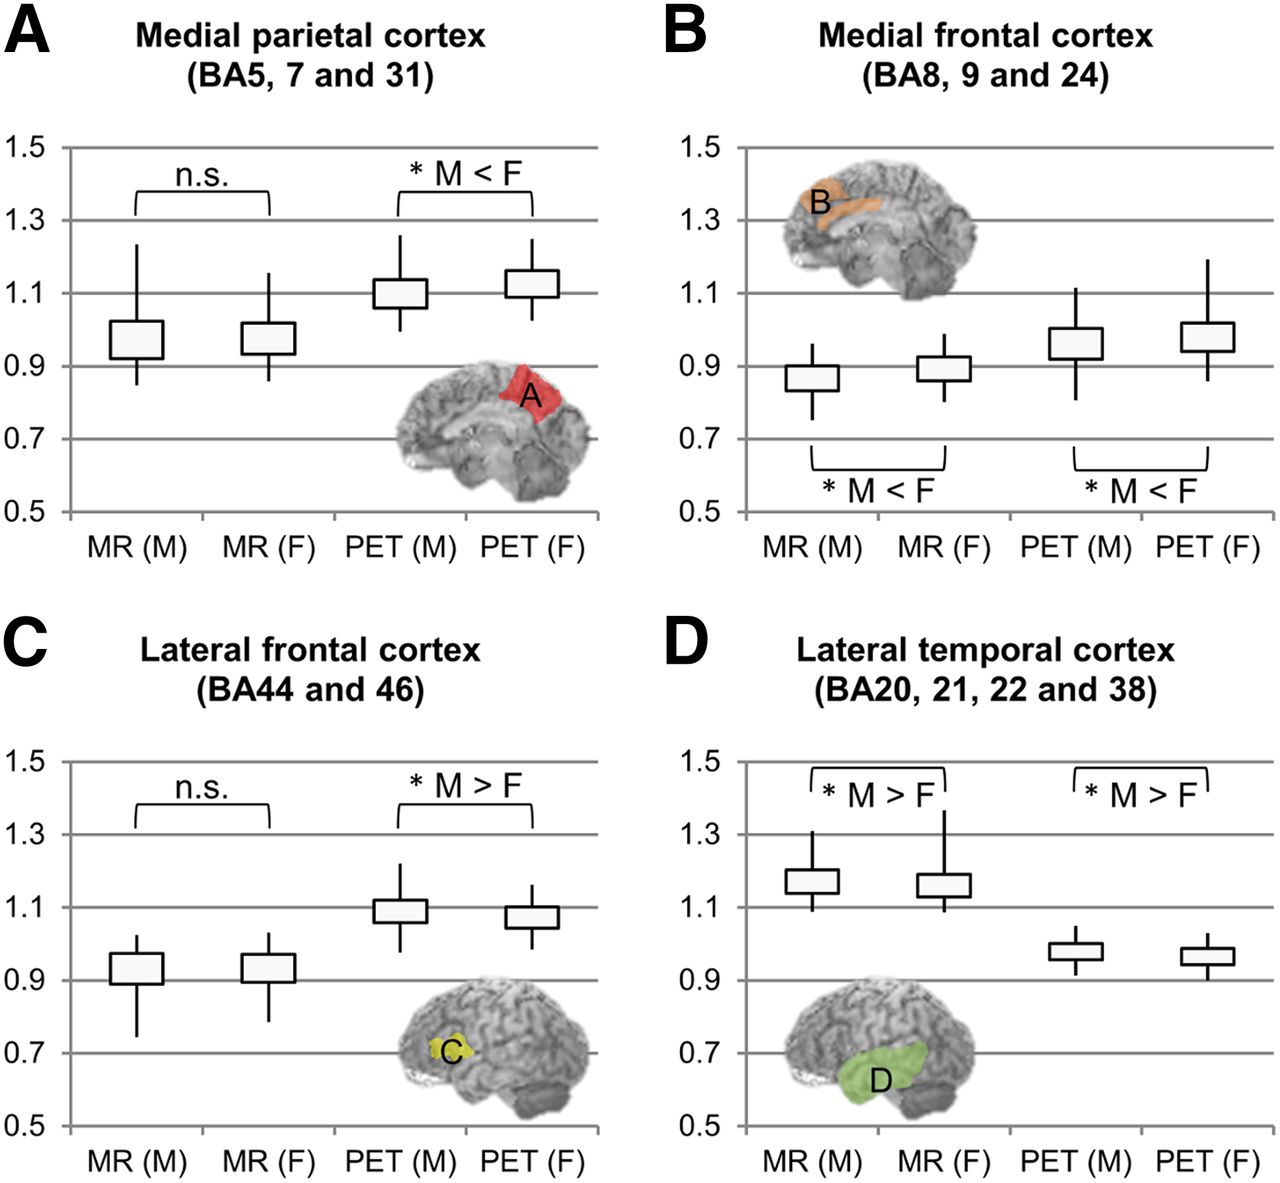
The quantitative brain-region analysis found changes similar to those found by the voxel-based analysis (Fig. 1 and Supplemental Figs. 1 and 2; supplemental materials are available at http://jnm.snmjournals.org). Figure 4, which was based on the brain-region analysis, shows BAs that have significant sex-specific differences. Compared with women, men had lower glucose metabolism in the medial parietal cortex (BAs 5, 7, and 31) and lower brain volume in the medial frontal cortex (BAs 8, 9, and 24) (Figs. 4A and 4B). In contrast, women had lower glucose metabolism in the lateral frontal cortex (BAs 44 and 46) and lower brain volume in the lateral temporal cortex (BAs 20, 21, 22, and 38) (Figs. 4C and 4D).

BA-based analysis between sexes. Vertical axes show pixel value corrected for whole-brain count. (A and C) Asterisks tagged on PET denote dominant changes in metabolism. (B and D) Presence of both asterisks (MRI and PET) denotes parallel changes in morphology and metabolism. Image insets indicate BAs of interest. n.s. = nonsignificant. *P < 0.05.
DISCUSSION
We showed an age-related reduction in gray matter volumes predominantly laterally, as reported previously (19). Although there was no significant sex-specific difference in these areas, the progression and pattern of reduction differed slightly between the sexes. Interestingly, a rapid decrease starting at 60 y old was seen in men whereas a gradual decrease starting at 40 y old was seen in women. One possible explanation is that this phenomenon is due to childbirth- or menopause-related sex hormone changes in the case of women and retirement-related lifestyle changes in the case of men. Because we acquired no data about hormones in this study, further study is needed to answer this question.
Regarding age-related changes in brain metabolism, we, like others (10,20), found age-related glucose hypometabolism in the medial frontal cortex. Our intriguing finding—unlike the previous reports—was a change not only in metabolism but in volume. Although glucose hypometabolism without brain atrophy was seen in the medial prefrontal cortex, glucose hypometabolism with brain atrophy was seen in the anterior cingulate gyrus. This suggests that the function per cell is more likely to decrease with age in the medial prefrontal cortex and that there is an age-related neuronal loss in the gray matter of the anterior cingulate gyrus.
Regarding differences in metabolic and morphologic changes between the sexes, our findings are partly incompatible with previous findings (9,10), possibly because a cohort with a large age range obscures the statistical comparison. In the evaluation of sex-specific differences, an age-matched comparison within each age group may be important. Like many studies, our study found that the frontal cortex and periventricular regions were more atrophic in men than in women, possibly because of a greater degree of alcohol intake in men (21). In fact, according to their interview sheets, men drank more alcohol than women in their daily lives (66.7% vs. 24.0%). Therefore, the morphologic changes between the sexes may reflect not innate development but external factors.
In contrast to the MRI findings, PET showed interesting changes in glucose metabolism. The subtraction analyses found reductions in glucose metabolism in men and women in the medial parietal cortex (BAs 5, 7, and 31) and lateral frontal cortex (BAs 44 and 46). The glucose hypometabolism in men corresponded to a visuospatial sensor (17,22,23), whereas that in women corresponded to an integrative speech-processing region including the Broca area (18) and a complex sentence-processing region (24). Although the age-related metabolic changes were apparent and the sex difference was manifested during adulthood, the difference became smaller as age advanced. Differences in metabolic reduction between the sexes were present only in the male parietal and female ventrolateral prefrontal cortices; these sex-specific differences might therefore be present only until neuronal attrition with age brings about greater similarity between the sexes. To explain this sex difference, further study of age-related changes in brain activation during sex-specific behaviors is necessary.
Our study measured sex-specific differences in metabolism during the resting state, as opposed to studies that have measured sex-specific differences in performance of an activity. One activation study has shown adolescent women (25) to be more efficient than adolescent men in tasks of selective attention, verbal fluency, reasoning, and speech reading; others have shown men to outperform women in tasks of visuospatial processing and mental rotation (26–29). Interestingly, the present findings of sex-specific differences in resting-state metabolism seem similar to the findings of sex-specific differences in those activation studies. Therefore, sex-specific differences in cellular levels may be present even in the resting state.
Considering the concept of cognitive reserve in healthy people—that is, professionals may differ from nonprofessionals in having a functionally specialized or energy-saving use of the brain (30,31), and healthy adults perform verbal tasks more poorly when their regional glucose metabolism is low (32,33)—it can be assumed that the results of the precisely classified between-sex subtraction analysis in our study may reflect an acquired low (efficient) energy consumption in sex-specific brain regions. Indeed, it is often said that men outperform women in tasks of visuospatial processing and women outperform men in tasks of speech processing (26–29). These sex-specific phenomena seen in daily life require scientific exploration.
Our study had several limitations. First, we analyzed only resting-state metabolic images. A future study is needed to verify whether greater reduction in metabolism at rest can follow greater activation during specific tasks in individuals with special cognitive ability. Second, the study lacked a detailed examination of neuropsychologic function in each participant, thus not allowing a comparison of cognitive valence with degree of brain metabolism at rest. Third, this study was designed not to follow individuals longitudinally but to make cross-sectional assessments. Fourth, the partial-volume effect existed in this study. Small areas might have been particularly affected by this effect and by 3D-SSP misregistration. Therefore, the pixel counts of PET images might have been influenced by the subjects’ brain morphology. Correction using MRI data might reduce the partial-volume effect.
CONCLUSION
With reference brain data on 963 cognitively normal humans, we demonstrated age-related parallel changes between morphology and metabolism in the medial frontal regions and sex-specific hypometabolism in the parietal (male) and the ventrolateral (female) cortices. These findings may partly answer the well-accepted phenomenologic question of “why men don’t listen and women can’t read maps.” To confirm this possibility, it is necessary to demonstrate sex-specific differences in activation in these regions during sex-specific tasks.
DISCLOSURE
The costs of publication of this article were defrayed in part by the payment of page charges. Therefore, and solely to indicate this fact, this article is hereby marked “advertisement” in accordance with 18 USC section 1734. No potential conflict of interest relevant to this article was reported.
Acknowledgments
We thank the staff of Hamamatsu Medical Imaging Center for their support.
Footnotes
Published online Nov. 25, 2015.
- © 2016 by the Society of Nuclear Medicine and Molecular Imaging, Inc.
REFERENCES
- Received for publication September 2, 2015.
- Accepted for publication October 26, 2015.


Jump to section
Related Articles
Cited By...
- The Uniqueness of Human Vulnerability to Brain Aging in Great Ape Evolution
- Nandrolone Decanoate supplementation promotes AMPK activation and divergent brain connectivity rearrangements in adult and aged mice
- Quality control strategies for brain MRI segmentation and parcellation: practical approaches and recommendations - insights from The Maastricht Study
- Time Courses of Cortical Glucose Metabolism and Microglial Activity Across the Life Span of Wild-Type Mice: A PET Study