


Abstract
Uptake time (interval between tracer injection and image acquisition) affects the SUV measured for tumors in 18F-FDG PET images. With dissimilar uptake times, changes in tumor SUVs will be under- or overestimated. This study examined the influence of uptake time on tumor response assessment using a virtual clinical trials approach. Methods: Tumor kinetic parameters were estimated from dynamic 18F-FDG PET scans of breast cancer patients and used to simulate time–activity curves for 45–120 min after injection. Five-minute uptake time frames followed 4 scenarios: the first was a standardized static uptake time (the SUV from 60 to 65 min was selected for all scans), the second was uptake times sampled from an academic PET facility with strict adherence to standardization protocols, the third was a distribution similar to scenario 2 but with greater deviation from standards, and the fourth was a mixture of hurried scans (45- to 65-min start of image acquisition) and frequent delays (58- to 115-min uptake time). The proportion of out-of-range scans (<50 or >70 min, or >15-min difference between paired scans) was 0%, 20%, 44%, and 64% for scenarios 1, 2, 3, and 4, respectively. A published SUV correction based on local linearity of uptake-time dependence was applied in a separate analysis. Influence of uptake-time variation was assessed as sensitivity for detecting response (probability of observing a change of ≥30% decrease in 18F-FDG PET SUV given a true decrease of 40%) and specificity (probability of observing an absolute change of <30% given no true change). Results: Sensitivity was 96% for scenario 1, and ranged from 73% for scenario 4 (95% confidence interval, 70%–76%) to 92% (90%–93%) for scenario 2. Specificity for all scenarios was at least 91%. Single-arm phase II trials required an 8%–115% greater sample size for scenarios 2–4 than for scenario 1. If uptake time is known, SUV correction methods may raise sensitivity to 87%–95% and reduce the sample size increase to less than 27%. Conclusion: Uptake-time deviations from standardized protocols occur frequently, potentially decreasing the performance of 18F-FDG PET response biomarkers. Correcting SUV for uptake time improves sensitivity, but algorithm refinement is needed. Stricter uptake-time control and effective correction algorithms could improve power and decrease costs for clinical trials using 18F-FDG PET endpoints.
A change in tumor SUV on 18F-FDG PET images has been suggested as a marker for response to therapy (1,2) and shows promise as an early indicator of response to both cytotoxic (3,4) and cytostatic therapy (5). The development of 18F-FDG PET as a quantitative biomarker has focused on both instrumentation calibration and standardization of protocols for patient preparation and scanning, to reduce measurement variability due to sources other than tumor metabolism (6–8). Uptake time (interval between tracer injection and image acquisition) is an aspect of scanning protocols that has a predictable effect on SUVs (9–11). When serial scans have dissimilar uptake times, the percentage change in 18F-FDG PET SUV may be under- or overestimated. Since it is not realistic to rigidly control uptake time (12,13) and since uptake time corrections are feasible (11,14), examining the impact of uptake time and its correction on quantitative response measurement by 18F-FDG PET is important for the efficient conduct of multicenter trials.
Current guidelines for the use of serial 18F-FDG PET measures in clinical trials recommend a standard uptake time, such as 60 ± 10 min (7) or 55–75 min (8,15), and (recognizing percentage change in SUV as a measurement of interest) no more than a 10- to 15-min difference in uptake time between pretherapy and posttherapy scans. This study examined the influence of uptake time using virtual clinical trials based on kinetic parameters and variability obtained from dynamic 18F-FDG PET scans of locally advanced breast cancer (LABC) patients.
MATERIALS AND METHODS
The first step to estimate the impact of uptake-time variation on measuring treatment response by percentage change in tumor SUV was to generate time–activity curves with simulated SUVs for 5-min frames starting from 45 to 120 min after injection. Kinetic parameters were initially estimated from 63 pretherapy 60-min 18F-FDG dynamic scans of LABC patients enrolled in an institutional review board–approved prospective observational study (1995–2007) for a 1.5-cm-diameter tumor region of interest, using a 2-tissue-compartment model with a k4 of 0 (2). The assumption that k4 was 0 was justified by findings that dephosphorylation of 18F-FDG-6-phosphate by glucose 6-phosphatase is not evident in time–activity curves until many hours after injection. Studies of brain cancer, sarcoma, and breast cancer have shown that 18F-FDG tumor uptake increases through 120 min after injection (16–18). Sets of model parameters (K1, k2, k3) were sampled from independent normal distributions with mean and variance as observed in the LABC cohort. A noiseless simulated 18F-FDG uptake curve may be generated using the kinetic parameters and a population arterial 18F-FDG input function (19). The input function used was derived from 79 cancer patients with concomitant arterial blood sampling during 120 min of dynamic 18F-FDG imaging. A thousand baseline 18F-FDG time–activity curves were generated with the constraint that the tumor SUV (average uptake in the region of interest) for the 55- to 60-min time frame was in the range of values observed for LABC patients (2.67–14.5). The maximum (14.5) was the highest SUV at 55–60 min in pretherapy scans (2). The minimum (2.67) represented tumors likely to respond to cytotoxic chemotherapy (20), for which a 30% decrease would be at least 0.8 SUV, conforming to the PERCIST criteria for response (7).
Normally distributed error was added to each simulated 18F-FDG uptake curve, with coefficient of variation scaled to a level based on counts observed for 58 pretherapy 18F-FDG PET LABC studies (55- to 60-min frame, coefficient of variation of 6.5%). This reflected errors from the scanner, as well as some variation in biologic uptake and distribution. The time–activity curves were converted to SUVs assuming a 370-MBq injection (10 mCi) and a 56.8-kg body weight. The suitability of the simulated data as representative of the LABC cohort SUVs was assessed as described in the supplemental material (available at http://jnm.snmjournals.org); simulated time–activity curves did not differ systematically from those fitted to source data.
Matched time–activity curves (n = 1,000) were also generated with a 40% decrease in activity from baseline curves. Early response, rather than baseline measures of 18F-FDG uptake, predicts breast cancer response to neoadjuvant chemotherapy. A 40% uniform decrease is justified since both low and high levels of metabolic response are observed throughout the range of baseline values (2).
The second step was to define 4 scenarios for sampling uptake times for baseline and follow-up scans (Fig. 1). Scenario 1 was a standardized static uptake time (the SUV from 60 to 65 min was selected for all scans). Scenario 2 was a rigorous PET facility. Uptake times were sampled from 2,003 PET/CT body scans conducted from 2010 to 2014 on adults with solid-tumor cancers at the University of Washington Medical Center. The PET technologists performed the scans according to standard clinical practice, with imaging commencing at a target time of 60 ± 10 min after 18F-FDG injection. The mean uptake time was 62.7 ± 7.2 min, with only 10% of uptake times being outside 50–70 min. Scenario 3 was a less rigorous PET facility. Uptake times were sampled from a gamma distribution selected to have a tail with longer uptake times to simulate instances when the patient or scanner is not ready at the 60-min target. The mean uptake time was 63 ± 10.4 min, with 24% of uptake times being outside 50–70 min. Scenario 4 was highly variable uptake time. Uptake times were sampled from 2 distributions: uptake time of 45–65 min, reflecting a desire to minimize the procedure time for the patient, and a γ-distribution with a mean uptake time of 71.4 ± 9.1 min, reflecting frequent delays. Baseline scans were selected with 75% probability from the first distribution and 25% from the second, and vice versa for follow-up scans; 38% of uptake times were outside 50–70 min.
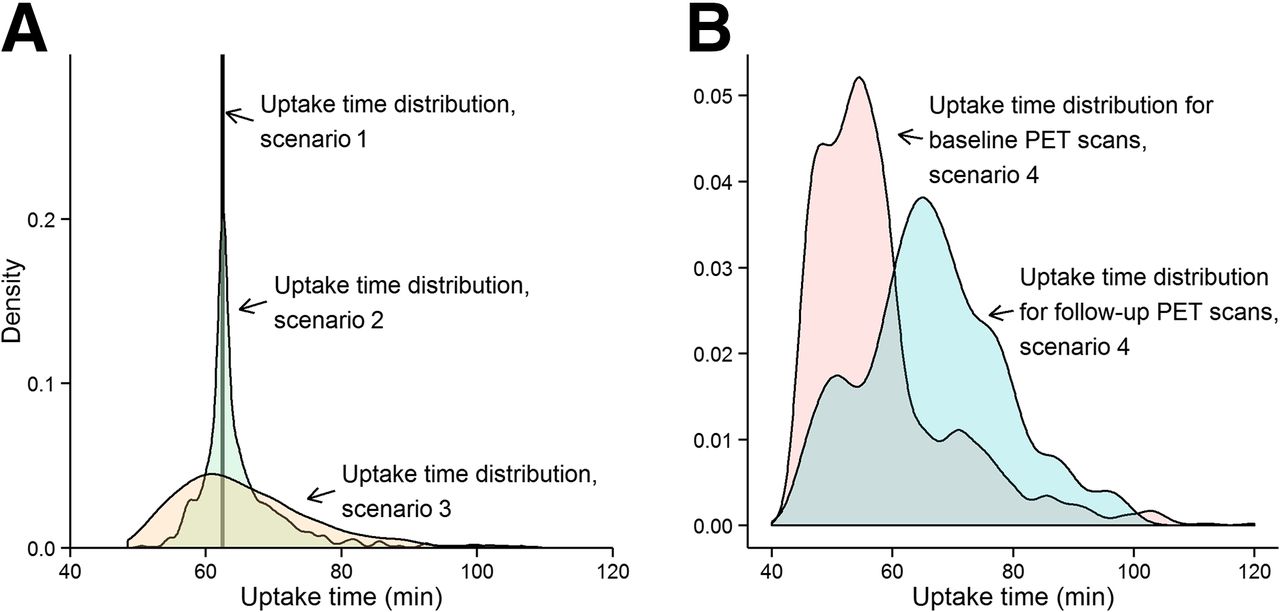
(A) Scenarios 1–3 for 18F-FDG PET SUV uptake-time distribution: all scans 60–65 min (scenario 1); actual uptake times from rigorous PET facility (scenario 2); additional spread from 60-min uptake time standard (scenario 3). (B) Scenario 4: mixture of hurried scans (75% of baseline, 25% of follow-up) and frequent delays (25% of baseline, 75% of follow-up).
A separate analysis applied a previously published uptake-time SUV correction algorithm (11) to estimate 60- to 65-min SUVs using observed SUVs and uptake times from sampling scenarios 2–4. This SUV correction was developed by fitting 2 linear models: SUV predicted by uptake time (27–75 min), and slope of the first model predicted by SUV at a reference time.
The third step was to operationalize the impact of uptake-time variations on clinical trial design. Sensitivity was defined as the probability of observing an 18F-FDG PET SUV decrease of at least 30% given a true decrease of 40%. The 30% cut point for SUV was chosen to be similar to the 30%-change PERCIST criterion for metabolic response (7). A 40% decrease in SUV is reasonable to expect as a strong response to 1 or 2 cycles of chemotherapy or anti-HER2 therapy (3,4,21), especially in tumor sites with low background uptake (22). Although follow-up scans for the 63 patients in the LABC study could have guided metabolic response in simulations, we selected a uniform −40% change to obtain the straightforward measure of sensitivity described above. Additionally, the follow-up scans in the cohort were obtained midtherapy rather than early (after 1 or 2 cycles). Specificity was defined as the probability of observing an absolute change of less than 30% given no true change (only error around the time–activity curve and uptake-time effects), reflecting a complete lack of impact on tumor glucose metabolism.
For each of the 4 uptake-time scenarios, sensitivity and specificity were calculated for all virtual patients’ observed SUVs, for SUVs corrected for uptake time (11), and for the subset of patients conforming to uptake-time protocols (60 ± 10 min, and no more than a 15-min difference between paired scans).
Estimated sensitivity was then used to calculate the required sample size for a single-arm phase II trial with a 2-sided α of 0.05 and 80% power to detect a proportion of patients with early metabolic response greater than 10%, over a range of true rates of metabolic response. This trial design would be appropriate for early phase II testing of pharmacodynamic response for a new agent to treat a group of patients for whom no other therapies have proven beneficial (23).
Simulation studies and statistical analyses were conducted using Excel for Macintosh, version 14.8.3 (Microsoft), and using version 3.1.3 of R (R Foundation for Statistical Computing) with the pwr.p.test function of package “pwr” for the power of a 1-sample test to detect a difference from a null proportion.
RESULTS
Impact of the 4 Scenarios on Measured SUV Changes
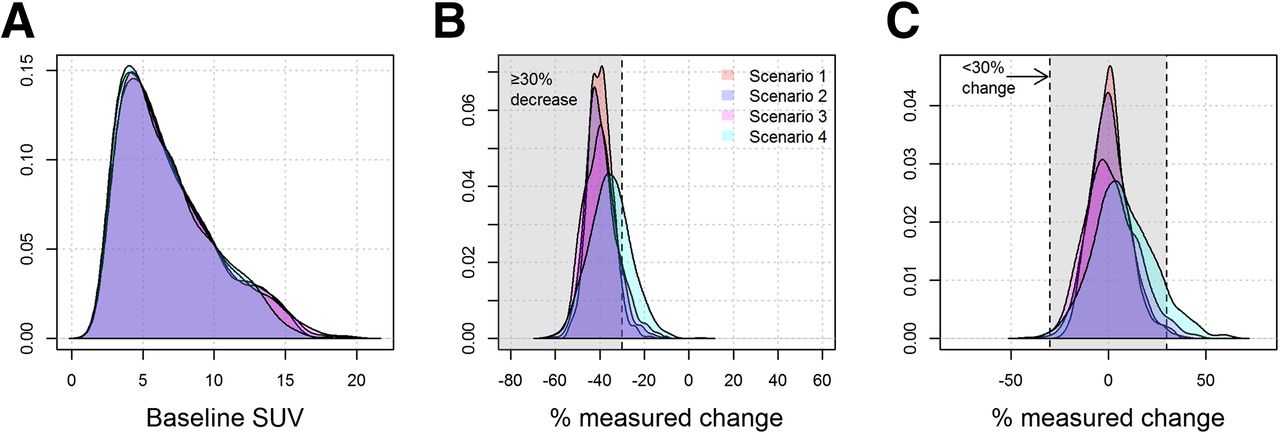
Variations in uptake time from 45 to 120 min had a marked impact on measured SUV. Figure 2 illustrates the dependence of simulated SUV on uptake time and on measurement error. Figure 3 shows the impact of the 4 uptake-time scenarios on SUV and measured change. Despite the dependence of individual SUVs on uptake time, the overall distribution of baseline SUVs was similar for the 4 uptake-time scenarios (Fig. 3A). However, uptake-time scenarios had a notable influence on the observed percentage change. When the true change was −40% (Fig. 3B) and all SUVs were acquired from a 60- to 65-min frame (scenario 1), the observed change was tightly clustered around the true value. Only 4% of the observed changes (43/1,000) were less than a 30% decrease (outside the shaded area in Fig. 3B), for a sensitivity of 96% (Table 1). As uptake time was less strictly controlled, the spread around the true value of −40% change increased, and the sensitivity decreased to 73% for scenario 4 (Table 1). Although the other uptake-time scenarios showed spread around the true value of −40% change, scenario 4 had a median of −36%, as well as greater dispersion than did scenarios 1 or 2. This is inherent in the setup for scenario 4, in which baseline scans are more likely to have uptake times of less than 60 min (with underestimated SUV compared with the 60-min standard value) and follow-up scans are more likely to have uptake times of more than 60 min (with overestimated SUV).
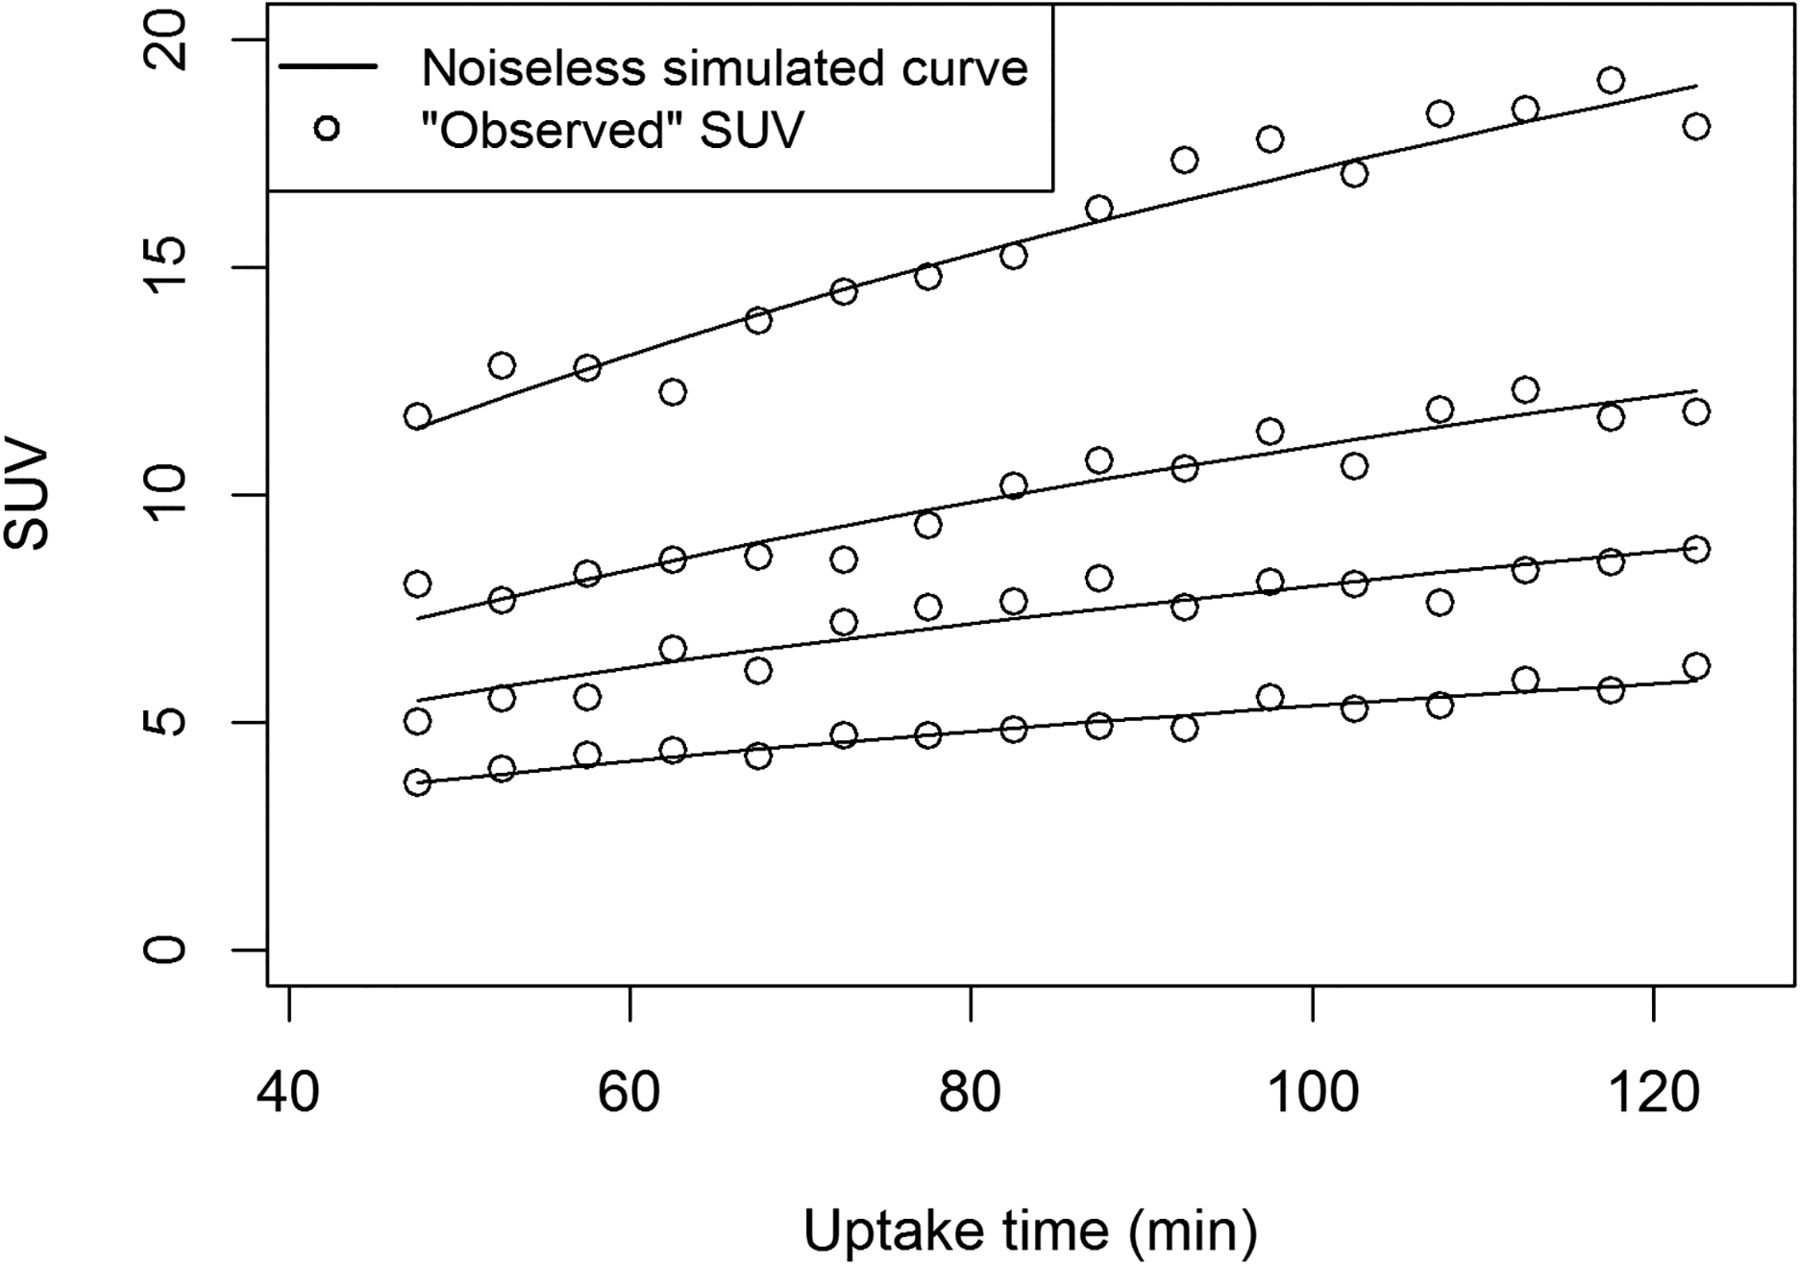
Dependence of 18F-FDG PET SUV (average uptake in region of interest) on uptake time. Solid lines are noiseless simulated 18F-FDG uptake curves with 60- to 65-min SUVs of 4.2, 6.3, 8.6, and 13.4. Observed SUVs with normally distributed error are plotted. Error coefficient of variation (6.5%) is based on counts observed for 58 pretherapy 18F-FDG PET studies on patients with LABC.

Results of virtual clinical trials under 4 uptake-time sampling scenarios. (A) Distribution of baseline SUV. (B) Observed percentage SUV change when there was a true 40% decrease. Sensitivity is proportion of observations in shaded area correctly classified as responders (≥30% decrease). (C) Observed percentage SUV change when there was no true change. Specificity is proportion of observations in shaded area correctly classified as stable disease (<30% absolute change).
Sensitivity and Specificity Derived from Simulated Time–Activity Curves and Uptake Times
The influence of uptake-time scenarios for percentage change was similar when the true change was 0% (Fig. 3C). Scenarios 1–3 had increasing spread around the true value, and scenario 4 showed bias (median 7% higher SUV at follow-up) due to the imbalance of hurried scans and frequent delays at baseline and follow-up. However, for this case of 0% true change, it is unlikely under any scenario that changes more extreme than 30% (outside the shaded area in Fig. 3C) will be observed. Specificity was no lower than 91% in the scenarios examined in Table 1.
We next examined the impact of uptake-time standardization and corrections on sensitivity and specificity. When percentage change data were excluded when either scan had an uptake time outside the 60 ± 10 min standard or if uptake time for paired scans differed by more than 15 min, then (as expected) sensitivity and specificity were improved compared with inclusion of the out-of-range measurements (Table 1). However, these out-of-range measurements still contributed accrual costs and time burdens to patients and investigators, as will be examined in sample size calculations below. Published uptake-time corrections (11) also improved sensitivity and specificity, without excluding measurements from any scans. However, although the goal of the correction is to estimate SUV at the standard frame of 60–65 min, these corrections raise sensitivity to 87%–95%, not to the 96% level attained by uniform adherence to that standard (Table 1).
Impact of the 4 Scenarios on Required Clinical Trial Sample Size
Low sensitivity affects power and sample size calculations because individual patients with a metabolic response (SUV decrease ≥ 30%) may be incorrectly classified as nonresponders. We evaluated the required sample size for a single-arm phase II trial with 80% power to provide a 95% confidence interval for the rate of metabolic response (proportion of patients on that therapy who experience a metabolic response) with a lower bound of more than 10%. The required sample size will be smaller when the true rate (proportion of patients who respond to therapy) is higher. Since specificity was high under study assumptions (observed metabolic response was unlikely with no true change), it was not a factor in sample size calculations. When sensitivity was increased by excluding out-of-range scans or pairs of scans, the study sample size was increased proportionally to the percentage of excluded scans (Table 1). Figure 4 shows sample size estimates for the scenarios examined. The black line shows the required sample size under standardized conditions (uptake time of 60–65 min for all scans). The sample size was slightly higher for a rigorous PET facility (scenario 2, Fig. 4A), with or without uptake-time correction or exclusion of out-of-range scans. Scenarios 3 and 4 demonstrate a substantial increase in required sample size with less rigorously controlled uptake times (Figs. 4B and 4C). Although excluding out-of-range scans increased sensitivity (Table 1), the increase in required enrollment makes this strategy unattractive for assessing the primary endpoint (proportion of patients with a metabolic response) in a basic phase II clinical trial.
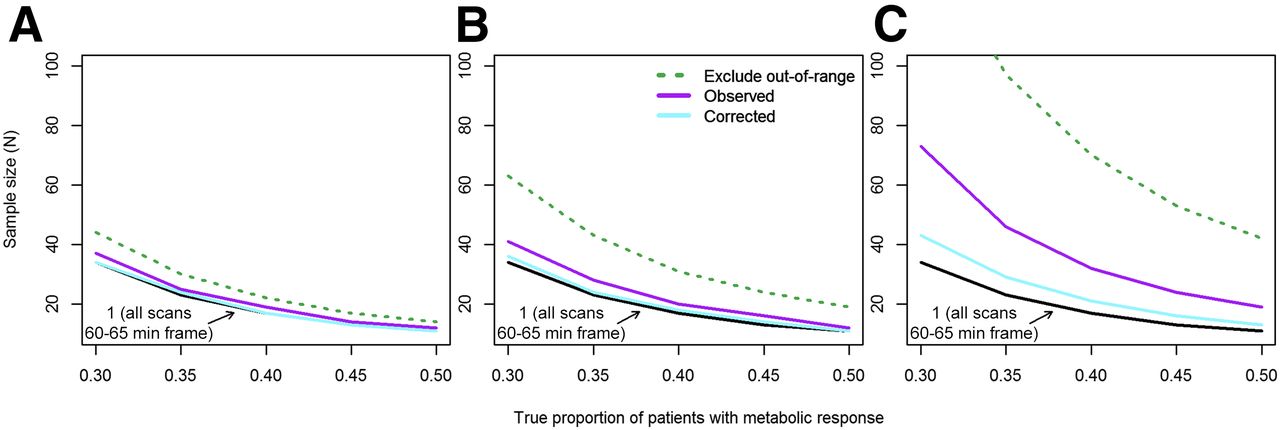
Required sample size for single-arm phase II trial with 80% power to provide 95% confidence interval for rate of metabolic response (proportion of patients on that therapy who experience metabolic response, measured as ≥30% decrease in SUV) with lower bound higher than 10%. Sample size decreases as true rate of patients with metabolic response increases. (A) Uptake times sampled from rigorous PET facility (scenario 2). (B) Additional spread from 60-min uptake time standard (scenario 3). (C) Mixture of hurried scans and frequent delays (scenario 4).
For example, the leftmost points of Figure 4B show the sample size required for 80% power (probability that the lower bound of a 95% confidence interval for the proportion of patients with a metabolic response will be >10%), assuming that the true proportion is 30%. The sample size is 34 when sensitivity is 96% (scenario 1), 41 (21% greater than for scenario 1) under scenario 3, 63 (85% greater) with replacement of patients with out-of-range scans, and 36 (6% greater) when scenario 3 uptake times are used with SUV corrections.
DISCUSSION
Variations in uptake time from 45 to 120 min have a marked impact on measured SUV, consistent with prior studies (9–11). The impact of uptake-time variation on metabolic response measures proposed for use in clinical trials was substantial. Assuming a 30% decrease as the criterion for metabolic response (PERCIST 1.0 (7)), sensitivity to a true 40% decrease was up to 23 percentage points lower than for a consistent 60- to 65-min uptake time, leading to an 8%–115% greater required sample size for a single-arm phase II clinical trial.
SUV correction for nonstandard uptake times is feasible. The use of a published correction strategy (11) improved a sensitivity of 92% to 95% and 73% to 87% (Table 1). However, the true uptake time must be reported accurately to apply this correction strategy, and it does not achieve the 96% sensitivity seen for the target uptake time. As an alternative to the standard of 60–65 min, dual-time-point scan protocols may result in SUVs that are less sensitive to uptake-time variation (24,25). Similarly, a study of test–retest variability (26) with a target 90-min uptake time found that variation at higher uptake times (primarily 80–160 min) contributed less to SUV variability than physiologic variability and other instrumentation factors. Increased adherence to uptake-time standards at the time of scanning is also desirable. In our study, the rigorous PET facility’s (scenario 2) close adherence relative to other published uptake times (12,13,26) was likely due to the facility’s ongoing participation in 18F-FDG PET standardization research and close collaboration between technologists and research staff.
Because this study was modeled closely on an observational study of 18F-FDG PET measures of breast cancer response to chemotherapy, it is not clear whether results are generalizable to measuring metabolic response to other therapies or in other tumors. Additionally, kinetic parameters (used to generate simulated time–activity curves) and simulated time–activity curve error were based on 0- to 60-min dynamic scans; synthetic curves projecting beyond the 60-min acquisition time may not reflect actual patient uptake profiles. The SUV correction (11) was based on an overlapping subset of the same source data (LABC cohort) and was applied to uptake times of more than 75 min, which may not follow the same linear association between uptake time and SUV as for 45–75 min. A final limitation is that it is an oversimplification to base conclusions about study design primarily on the sensitivity of a 30% decrease in SUV to detect a true decrease of 40%. In addition to expecting more modest metabolic responses to radiotherapy (27) or to targeted therapy such as endocrine therapy (5), we have not accounted for heterogeneity of patient response to treatment or the full extent of biologic variability demonstrated in test–retest studies. These oversimplifications are standard for simulation studies to allow focused examination of specific sources of measurement error (uptake time) while controlling others (underlying variability of response).
We concur with the Uniform Protocols for Imaging in Clinical Trials that 50–70 or 55–75 min with a follow-up uptake time within 10–15 min of baseline uptake time is an important standard (15). This level of variation should have little impact on the sensitivity and specificity of tumor response measurements. However, in a recent multicenter study, 10 of 62 patients (16%) had at least 1 scan outside the target uptake-time range (4). Discarding scans with an out-of-range uptake time can lead to clinical trial inefficiency more severe than when out-of-range scans are included in the analysis (Fig. 4). This study showed that a large variation in uptake time, which is sometimes observed in practice, substantially degraded both sensitivity and specificity for detecting metabolic response, which could result in underpowering of multicenter trials with metabolic response as a primary endpoint. Although a few percentage points in sensitivity and required accrual of 5–10 additional patients may not seem important, for a phase II trial this would be a substantial proportional increase in patient costs and recruitment efforts. Since many trials are terminated because of insufficient enrollment (28), optimal use of each patient’s data is desirable. A proposed SUV correction based on actual uptake time (11) improved sensitivity and specificity but not to the level achieved by consistent scanning at a target uptake time. Refinement of quantitative imaging biomarkers reaps benefits for clinical practice as well as clinical trials (29).
CONCLUSION
Uptake-time deviations from standardized protocols occur frequently, potentially decreasing the performance of 18F-FDG PET response biomarkers. Correcting SUV for uptake time improves sensitivity, but algorithm refinement is needed. Stricter uptake-time control and effective correction algorithms may improve power and decrease costs for clinical trials using 18F-FDG PET endpoints. Our future research will improve on the correction, using a larger set of dynamic scans for LABC (pretherapy and midtherapy), with validation using dynamic 18F-FDG PET scans from independent cohorts and different tumor sites.
DISCLOSURE
The costs of publication of this article were defrayed in part by the payment of page charges. Therefore, and solely to indicate this fact, this article is hereby marked “advertisement” in accordance with 18 USC section 1734. This work was supported by NIH grants U01-CA148131, P01-CA42045, and R01-CA72064. This work used the UPCI Biostatistics Shared Resource Facility that is supported in part by award P30-CA047904. No other potential conflict of interest relevant to this article was reported.
Acknowledgments
We thank Anthony Shields, the JNM reviewers, and the editors for their helpful feedback. We also thank Shira Abberbock, the study participants, the referring physicians, and the nuclear medicine team in the University of Washington Department of Radiology.
Footnotes
Published online Oct. 22, 2015.
- © 2016 by the Society of Nuclear Medicine and Molecular Imaging, Inc.
REFERENCES
- Received for publication June 17, 2015.
- Accepted for publication October 13, 2015.


Jump to section
Related Articles
Cited By...
- Principles of Tracer Kinetic Analysis in Oncology, Part II: Examples and Future Directions
- Principles of Tracer Kinetic Analysis in Oncology, Part I: Principles and Overview of Methodology
- Test-Retest Reproducibility of 18F-FDG PET/CT Uptake in Cancer Patients Within a Qualified and Calibrated Local Network
- Repeatability of SUV in Oncologic 18F-FDG PET
- Getting the Most out of 18F-FDG PET Scans: The Predictive Value of 18F-FDG PET-Derived Blood Flow Estimates for Breast Cancer