


Abstract
Attenuation correction in hybrid PET/MR scanners is still a challenging task. This paper describes a methodology for synthesizing a pseudo-CT volume from a single T1-weighted volume, thus allowing us to create accurate attenuation correction maps. Methods: We propose a fast pseudo-CT volume generation from a patient-specific MR T1-weighted image using a groupwise patch-based approach and an MRI–CT atlas dictionary. For every voxel in the input MR image, we compute the similarity of the patch containing that voxel to the patches of all MR images in the database that lie in a certain anatomic neighborhood. The pseudo-CT volume is obtained as a local weighted linear combination of the CT values of the corresponding patches. The algorithm was implemented in a graphical processing unit (GPU). Results: We evaluated our method both qualitatively and quantitatively for PET/MR correction. The approach performed successfully in all cases considered. We compared the SUVs of the PET image obtained after attenuation correction using the patient-specific CT volume and using the corresponding computed pseudo-CT volume. The patient-specific correlation between SUV obtained with both methods was high (R2 = 0.9980, P < 0.0001), and the Bland–Altman test showed that the average of the differences was low (0.0006 ± 0.0594). A region-of-interest analysis was also performed. The correlation between SUVmean and SUVmax for every region was high (R2 = 0.9989, P < 0.0001, and R2 = 0.9904, P < 0.0001, respectively). Conclusion: The results indicate that our method can accurately approximate the patient-specific CT volume and serves as a potential solution for accurate attenuation correction in hybrid PET/MR systems. The quality of the corrected PET scan using our pseudo-CT volume is comparable to having acquired a patient-specific CT scan, thus improving the results obtained with the ultrashort-echo-time–based attenuation correction maps currently used in the scanner. The GPU implementation substantially decreases computational time, making the approach suitable for real applications.
PET performs functional imaging by detecting pairs of annihilation γ-rays emitted indirectly by a positron-emitting radionuclide (radiotracer), allowing measurement of its biodistribution. MRI provides, among others, detailed morphologic imaging of organs or soft tissue, with excellent spatial resolution. The evolution of both modalities into complementary in vivo molecular imaging techniques has generated increased interest in the development of hybrid MR/PET systems (1).
The construction of accurate attenuation correction (AC) maps is essential for the clinical application of hybrid PET/MR systems. Constructing PET AC maps for use in these hybrid systems is challenging because no direct relation exists between PET attenuation coefficients (μ) and MR signal intensity (2), contrary to what happens with AC maps and the intensity of CT images (3). Additionally, treating bone as soft tissue in MR-derived AC maps for PET/MR AC leads to a substantial underestimation in the analysis of PET tracer distribution (4). Creating a pseudo-CT volume from MRI data could help to produce an accurate AC map comparable in quality to one acquired from a real CT scan of the patient.
Previous approaches to MRI-based AC have been presented in the literature (5). They differ mainly in the type of semantic representation used to describe the image data, based on mathematic morphology (6), deformable models (7), MRI Dixon (8) or ultrashort-echo-time (TE) sequences (9,10), and multiatlas segmentation using label fusion (11). However, most of these methods showed limited accuracy when used to create AC maps (12). Hofmann et al. combined local pattern recognition with image registration to generate pseudo-CT images (13). Recently, Izquierdo-Garcia et al. proposed an approach to pseudo-CT synthesis based on nonrigid registration to an atlas using the standard SPM8 software with a CT template (14). Burgos et al. described an improved method that uses nonrigid registration to an atlas, followed by label fusion based on patch-similarity measurements (15). Furthermore, clinical scanners currently rely on acquisition of multiple MR sequences, but the results are not fully reliable (16).
Patch-based methods have proven to be a versatile segmentation technique (17). Patch-based segmentation was introduced as an alternative to label propagation that eliminates the requirement for nonrigid registration. The technique is an adaptation of the nonlocal framework developments for nonlocal denoising (18). Several approaches have been introduced depending on the patch fusion methods or rules (19,20). Ye et al. proposed a patch-based method for generating a T2-weighted volume from a T1-weighted volume (21).
In this work, we propose a simple and fast approach to pseudo-CT synthesis from a single patient-specific MR T1-weighted image using a groupwise patch-based approach and a limited MRI and CT atlas dictionary. Our method is purely patch-based, eliminating the need for a registration step and considerably reducing time. Also, because the algorithm becomes parallelizable, a fast implementation using a graphical processing unit (GPU) card is presented.
In the next section we describe the dataset used in this work and the overall process of the pseudo-CT synthesis and AC maps. Then, we present different experiments quantitatively comparing the use of patient-specific CT and our pseudo-CT volumes for AC correction. Finally we discuss the findings from the experimental results and the possible implications for managing PET AC in hybrid PET/MR systems, and we draw some conclusions.
MATERIALS AND METHODS
Patient Population
The institutional review board–approved retrospective study included a dataset containing 19 healthy women (mean age, 34.96 ± 5.23 y; range, 27–46 y). All underwent both MR and CT imaging. For this type of study, the need for written informed consent was waived.
Image Acquisition
MR images of the head were acquired on a Signa HDxt 3.0-T MR scanner (GE Healthcare) using the body coil for excitation and an 8-channel quadrature brain coil for reception. Imaging was performed using an isotropic 3-dimensional (3D) T1-weighted spoiled gradient recalled sequence with a repetition time of 10.024 ms, TE of 4.56 ms, inversion time of 600 ms, 1 excitation, acquisition matrix of 288 × 288, resolution of 1 × 1 × 1 mm, and flip angle of 12°.
Low-dose CT images were acquired on a Somatom Sensation 16 CT scanner (Siemens) with a matrix of 512 × 512, resolution of 0.48 × 0.48 mm, slice thickness of 0.75 mm, pitch of 0.7 mm, acquisition angle of 0°, voltage of 120 kV, and radiation intensity of 200 mA.
Data Preprocessing
Images were preprocessed using 3D Slicer built-in modules (22). This preprocessing included MRI bias correction (N4 bias correction tool in the Insight Toolkit), rigid registration (general registration BRAINS) to align each patient-specific MRI–CT pair, rigid registration to prealign all the images in the same spatial origin—all the images are set in the same orientation—and normalization of the grayscale values (Insight Toolkit–based histogram matching).
Pseudo-CT Synthesis
Weights Estimation
Let I be an input image to be processed, and A an anatomy atlas containing a set of MRI T1-weighted volumes  and their corresponding
  volumes:
  .
.
Let us consider  as a weight reflecting nonlocal similarities between voxels
  in the input image I and voxels
  in the image
  of the atlas A over the image domain Ω, and computed using the following equation:
 Eq. 1
Eq. 1
where  is a 3D patch of the image I centered at voxel a, S is the number of voxels in the 3D patch, β is a smoothing parameter, and
  is the SD of the noise. The original denoising approach assumes that similarities of a patch can be found over the entire image domain Ω. However, in our context of modality propagation, the variations of the anatomic structures in a population are bounded, and we can thus find good matches in a specific neighborhood
  of a certain voxel a. The weights are then estimated in this local area as
  , reflecting the local similarities between I and
  .
.
The size of the patch has been set to 3 × 3 × 3 for all experiments. The size of the considered neighborhood has been set to 11 × 11 × 11, which is directly related to the anatomic variability of the head (21).
Groupwise Label Propagation
Once the weights have been computed using Equation 1, they can be used to estimate the corresponding voxel a of image  as a weighted linear groupwise combination of the patches in
  as follows:
 Eq. 2
Eq. 2
which takes all the images  in the atlas A to produce a groupwise combination of
  , thus obtaining an estimation of
  .
.
Regularization
Contrary to registration-based approaches, if there is no correspondence between the patch of the input image I and the patches of the images  in the atlas A, no value (NaN due to division by 0) is assigned to the voxel a of
  . This situation makes it necessary to include a regularization step that deals with nonlabeled voxels. Because these cases are usually isolated, in this work we have assigned to this voxel the value of the median in its neighborhood. The size of this new neighborhood has been set to 3 in this paper:
  .
. Eq. 3
Eq. 3
GPU Implementation
The patch-based algorithm is highly parallelizable. The calculation of the resulting  for each voxel I in the 3D input volume is completely independent from that for the other voxels. Configuring a 3D grid in a CUDA (Compute Unified Device Architecture) model allows loops to be eliminated in order to iterate over the different voxels in the volume. Our CUDA kernel contains the selection of atlas A and the search in the neighborhood N; in this way, each label calculation is performed in a separate thread.
PET Simulation
We obtained detailed tissue-segmented models from the T1-weighted volumes using the pipeline described by Torrado-Carvajal et al. (23). These models contained cerebellar white and gray matter, brain white and gray matter, cerebrospinal fluid, skull, eyes, muscle, fat, and skin. We assigned a standard 18F-FDG PET activity to each tissue according to relative values (gray matter, 4.0; white matter and rest of soft tissue, 1.0; cerebrospinal fluid and bone, 0.0) (24,25), obtaining the ground-truth PET maps. Then, these ground-truth maps were projected with the 3D ordered-subsets expectation maximization software (26), assuming the geometry, parameters, and sinogram format of the Biograph mMR scanner (27). The system response matrix used in this case assumed a uniform gaussian point-spread function of 4 mm in full width at half maximum in the whole field of view. Like Hofmann et al., we neglected scatter and random coincidences to isolate the effect of the AC maps in the final reconstructed PET images (13). The projection data generated were our attenuation-free reference data.
The 511-keV AC maps derived from the CT (gold standard) and MR (pseudo-CT) images and originated using the conversion described by Nakamoto et al. (28) were forward-projected to generate the attenuation data. The forward projection is based on the same code as that used to project the PET distribution with the 4-mm point-spread function, as the blurring effects involved in the PET emission, such as positron range and noncolinearity, also affect attenuation of the γ-rays. We then used these 2 projection datasets (ProjμMR and ProjμCT) to generate our attenuation-corrected data (PETMR-AC) from the attenuation-free data (PET) by following this equation: Eq. 4
Eq. 4
Image Reconstruction
Both the attenuated projection data and the attenuation-free data were reconstructed with 3D ordered-subsets expectation maximization software (26) adapted to the geometry and sinogram size of the mMR scanner. We used 30 iterations and 3 subsets, and the reconstructed images consisted of 201 × 201 × 129 voxels of 2 × 2 × 2 mm each. As indicated by Burger et al., the difference between these 2 reconstructed images depends on the reconstruction method used, but it is outside the scope of this work to analyze this effect (3).
Experimental Setup
The available data were separated into an atlas A containing 10 MRI–CT pairs,  , and a test set T containing the 9 remaining MRI–CT pairs,
  .
.
RESULTS
Image Quality
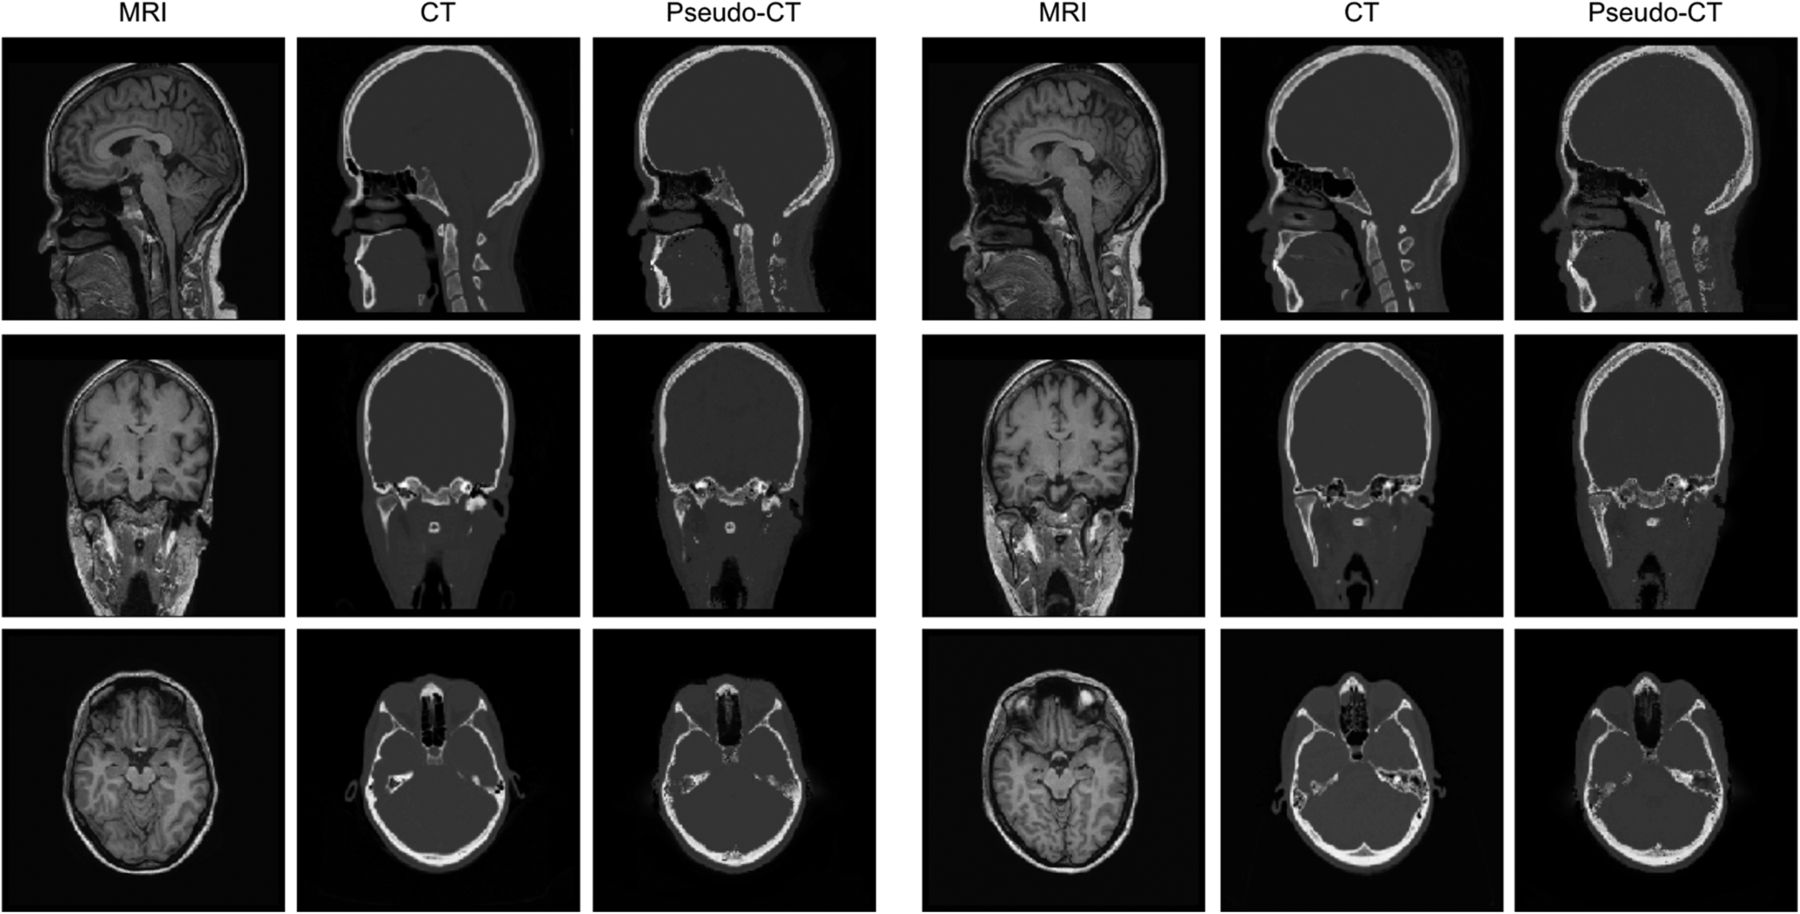
Figure 1 shows a complete head MRI volume, the ground-truth CT volume, and the synthesized pseudo-CT volume for 2 healthy subjects. An expert radiologist visually inspected the images to confirm the accuracy of our method; our pipeline worked equally well in all cases considered.

Sagittal, coronal, and axial slices of patient-specific MR (first column), patient-specific CT (second column), and synthesized pseudo-CT (third column) images of 2 subjects.
With the proposed method, the shape of the skull was estimated generally well despite patient-specific anatomic variations. The comparison between the patient-specific CT and pseudo-CT volumes showed that our method accurately estimates the ground truth, delimiting the skull contours and differentiating air from bone. Visual inspection of the results showed the high quality of the pseudo-CT estimation and the robustness of the method, which is able to capture the details of the bone spikes in nonsmooth areas such as the sinuses and the cervical vertebrae.
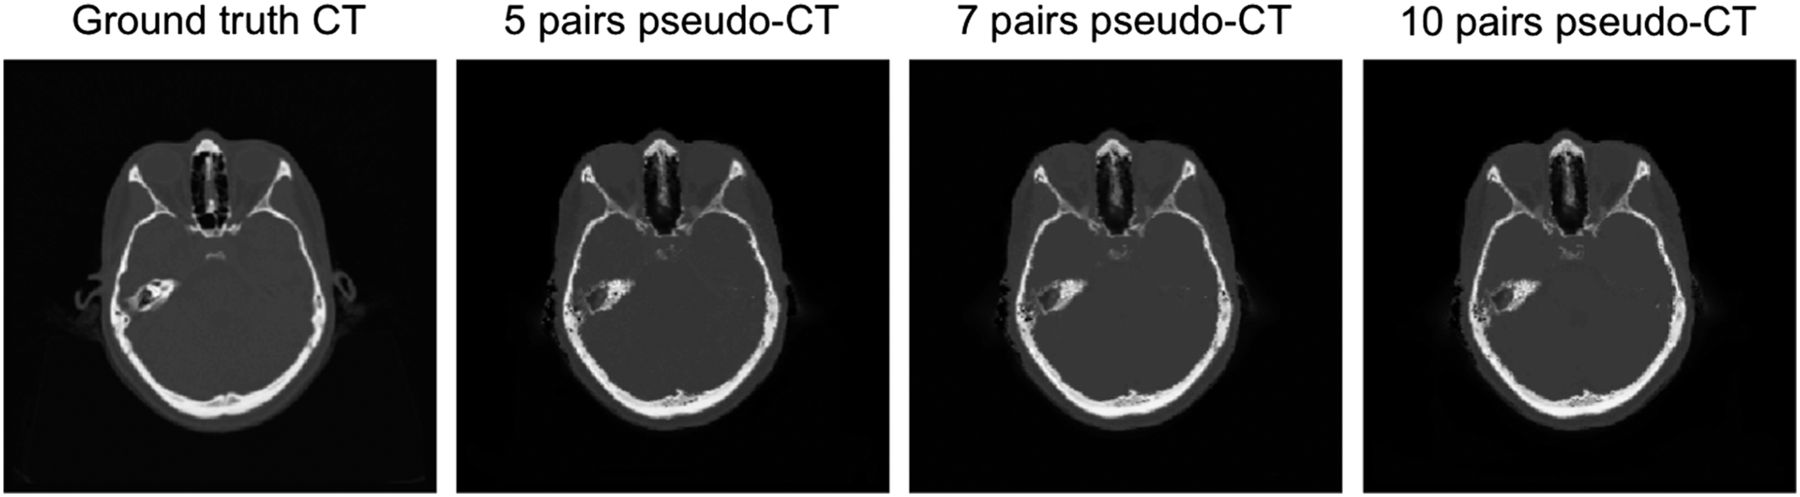
We also tested whether changing the size of the atlas affects the quality of the synthesized images in subjects without skull deformations, using atlases of 5, 7, and 10 datasets (Fig. 2). We used the normalized cross correlation (NCC) to quantitatively measure the quality of the synthesized pseudo-CT volumes (I2) compared with the ground-truth CT volume (I1), following Equation 5. Eq. 5The experimental NCC was 0.9281 ± 0.0066 for the atlas with 5 datasets, 0.9294 ± 0.0051 for the atlas with 7 datasets, and 0.9324 ± 0.0048 for the atlas with 10 datasets.

Axial patient-specific CT and pseudo-CT images synthesized using atlases of different sizes.
Artifacts caused by dental restorations are a common problem in MRI and CT scans of the head and neck. Dental implants impair CT image quality by causing beam-hardening artifacts, MR image quality by causing signal loss, and synthesized pseudo-CT image quality by causing blurring (Fig. 3).
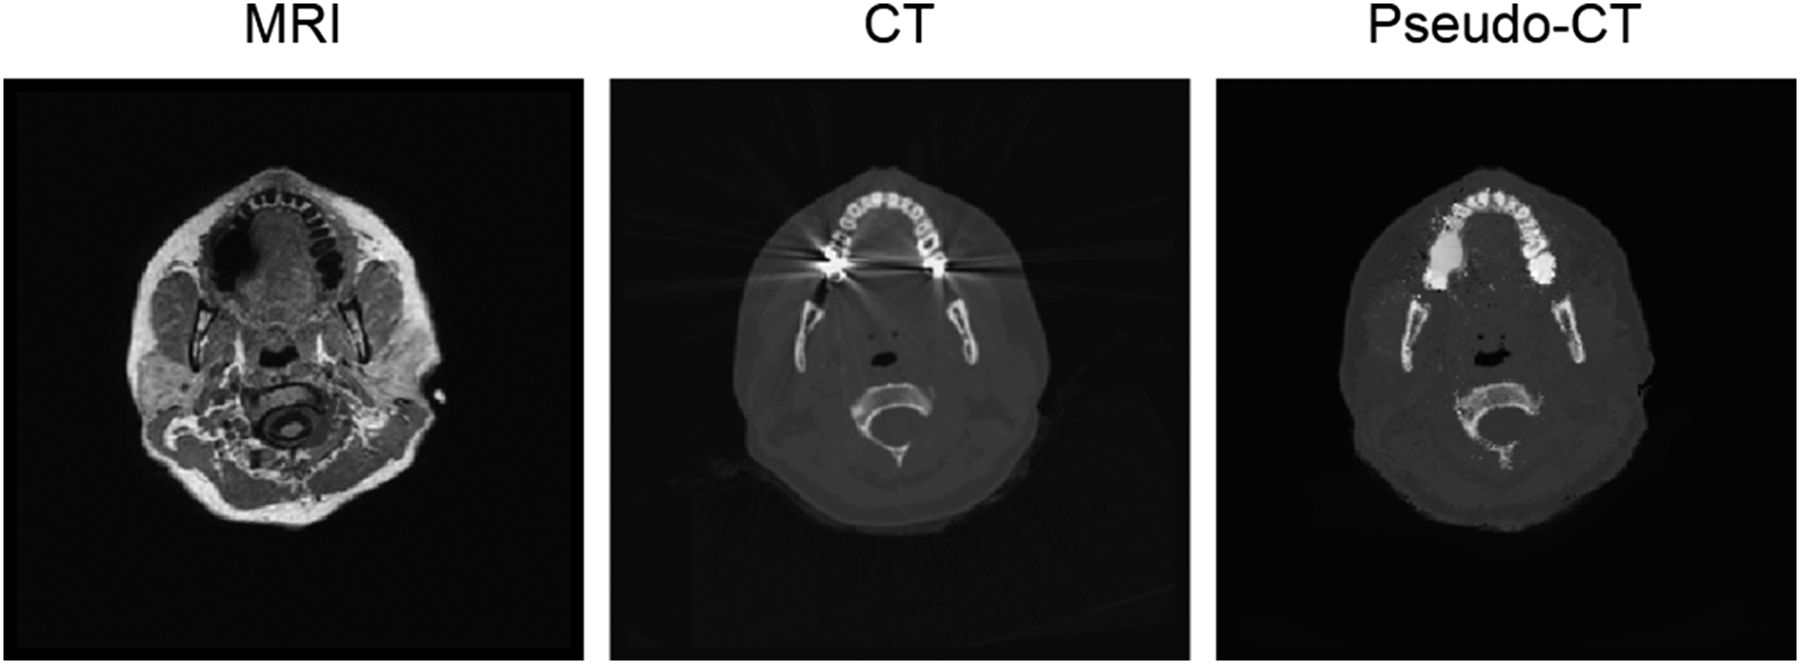
Artifacts caused by dental restorations. MR image (left) is impaired by signal loss; CT image (center) is impaired by beam hardening; pseudo-CT image (right) presents some blurring in those zones.
PET Correction Quality
Voxel-by-Voxel Analysis
Voxel-by-voxel analysis was performed to determine differences in reconstructed SUVs for all test subjects. There was an excellent match between the attenuation-free SUV images (gold standard)—attenuated and corrected with the patient-specific CT volume—and the pseudo-CT–based corrected SUV images—attenuated with the patient-specific CT volume and corrected with the synthesized pseudo-CT volume. Errors were lower than 10% of the SUVs in most voxels. Some deviations could be appreciated in subjects A and B, but the error was lower than 5% on average (Fig. 4).
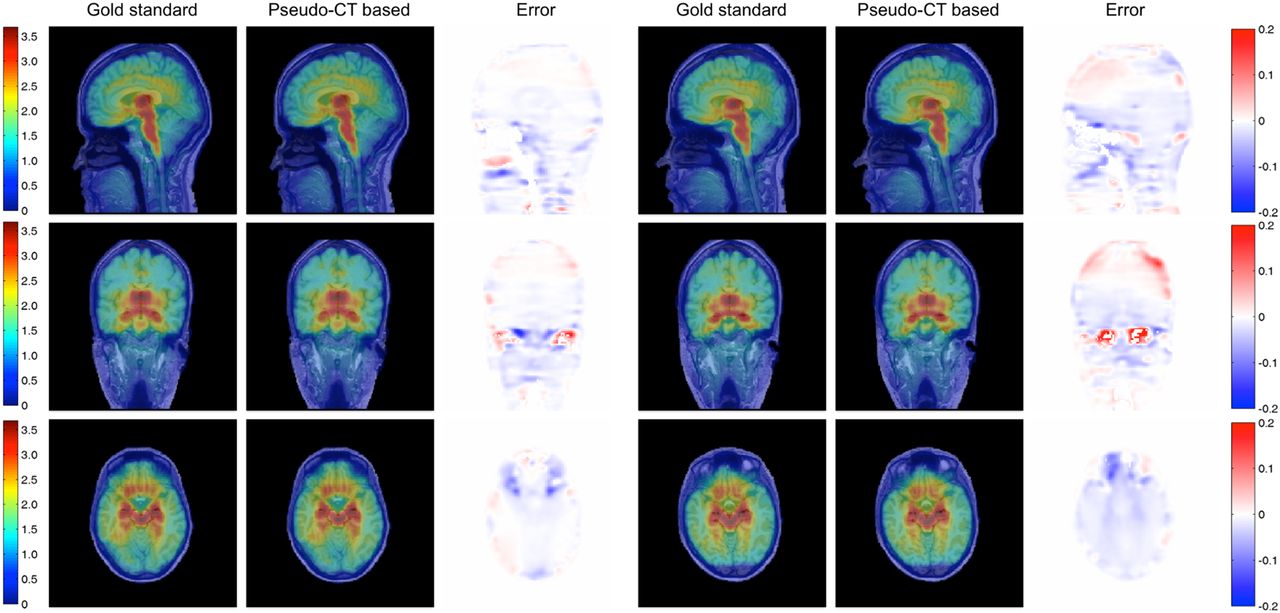
Sagittal, coronal, and axial slices of attenuation-free SUV images (first column), pseudo-CT–based corrected SUV images (second column), and error between both corrections (third column) for 2 subjects. Blue values in error maps denote decreased PET SUVs in pseudo-CT–based correction, whereas red values denote increased PET SUVs.
We also computed the voxel-by-voxel correlation between pseudo-CT–based SUV and CT-based SUV for all 9 test subjects over the whole head, as well as the Bland–Altman plot of SUVs (Fig. 5). Voxels dominated by noise (SUV < 0.01) were not included in the analysis. The correlation plot showed an excellent correlation between SUVs obtained with both methods (R2 = 0.9980, P < 0.0001). The Bland–Altman plot showed that the average of the differences was low (0.0006 ± 0.0594); the difference between methods tended to decrease as the average increased, accumulating the error in voxels with low SUVs.
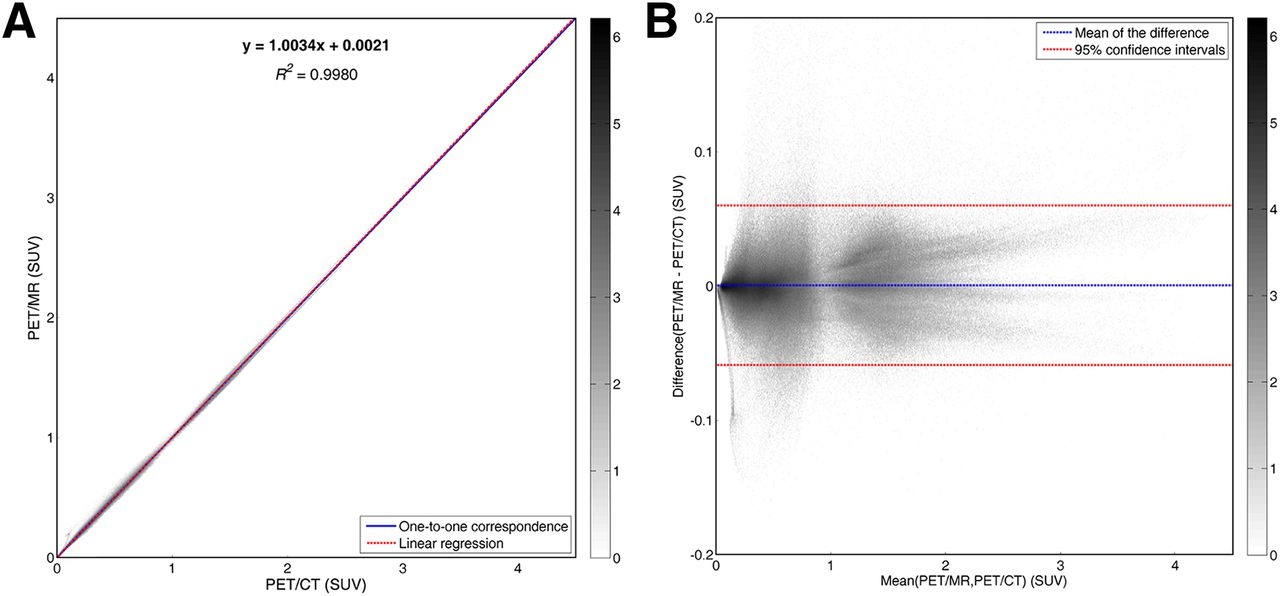
(A) Voxel-by-voxel correlation between pseudo-CT– and CT-based SUV from all subjects. (B) Bland–Altman plot of SUVs. Color bar shows density of voxels on histogram grid.
Region-of-Interest (ROI) Analysis
ROI analysis was performed to determine differences in assigned attenuation coefficients and reconstructed SUVs. ROIs were defined as the original segmented tissues used to assign PET activity in the simulation.
Table 1 summarizes pseudo-CT–based and CT-based attenuation coefficients for each ROI. Paired-sample Wilcoxon signed rank tests were performed to assess whether there were differences in the mean ranks of pseudo-CT–based and CT-based attenuation coefficients. No significant difference was found in the mean CT-based attenuation coefficients, as compared with assigned pseudo-CT–based attenuation coefficients, in any ROI except the skin.
Attenuation Coefficients Based on Pseudo-CT and CT for Each ROI
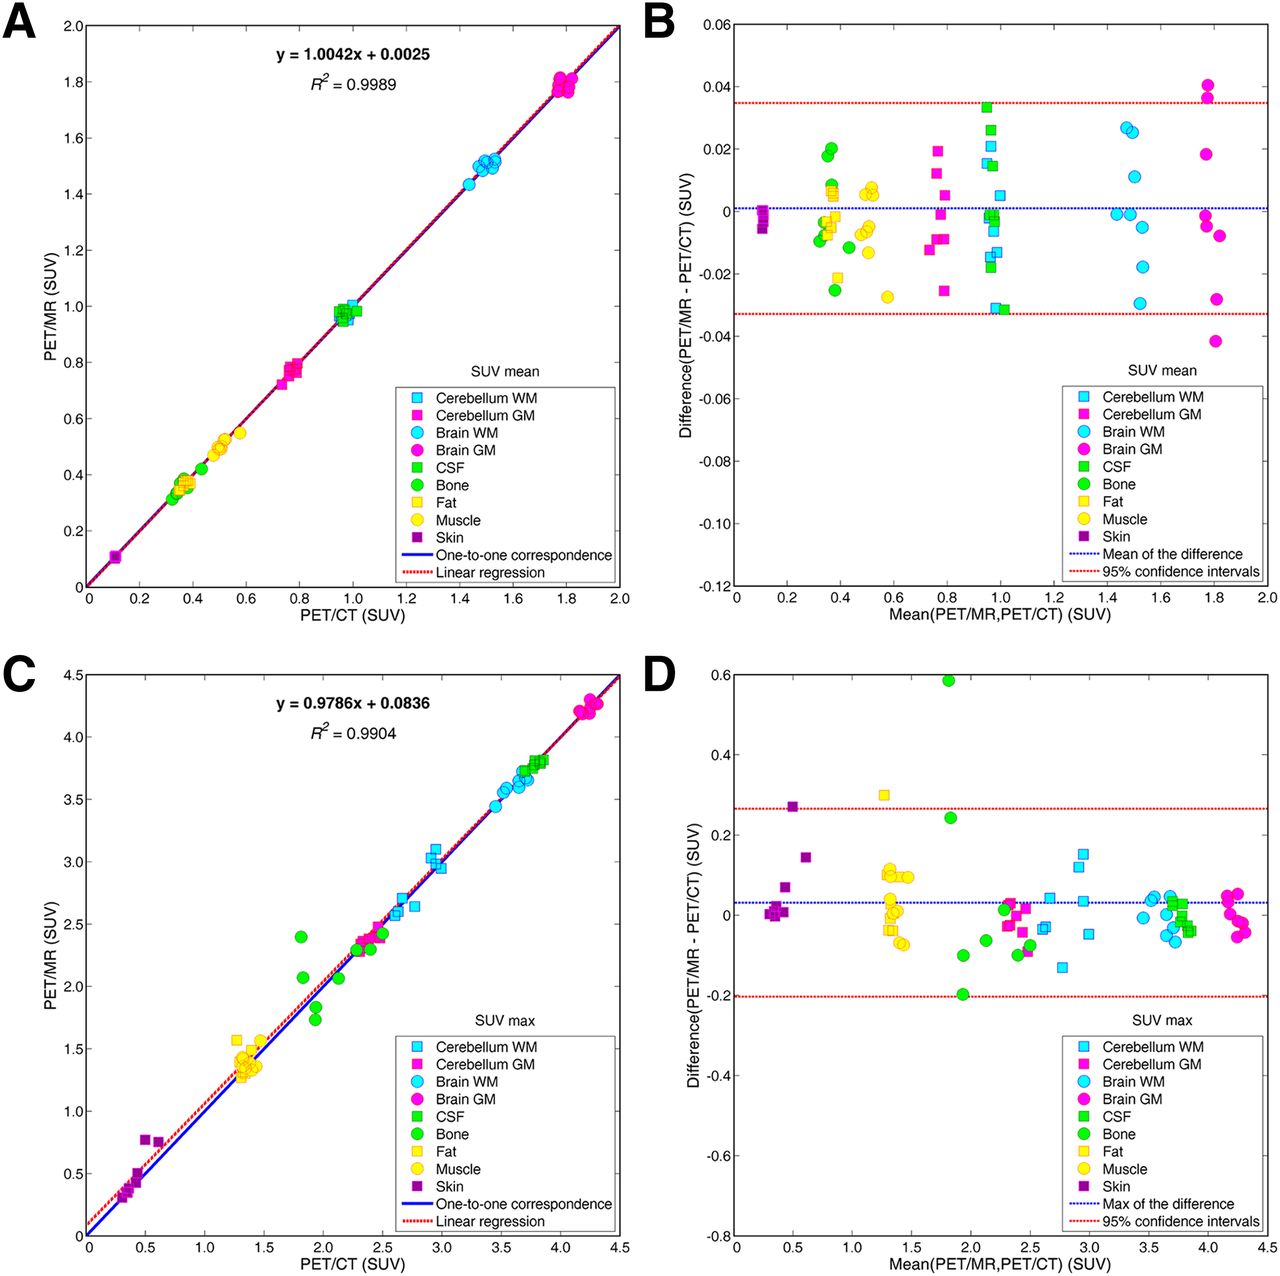
We computed the correlation between pseudo-CT–based SUV and CT-based SUV for each ROI, as well as the Bland–Altman plot of SUVmean and SUVmax (Fig. 6). The correlation plot for SUVmean showed an excellent correlation between SUVmean obtained with both methods (R2 = 0.9989, P < 0.0001). The Bland–Altman plot for SUVmean showed that the average of the differences was low (0.0009 ± 0.0338); the difference between methods did not show an increasing or decreasing trend as the average changed. The correlation plot for SUVmax showed a slight overestimation in the SUVmax obtained with our method (R2 = 0.9904, P < 0.0001). The Bland–Altman plot for SUVmax showed that the average of the differences was low (0.0312 ± 0.2345); the difference between methods confirmed a slight overestimation of our method in regions with low SUVs.

(A and C) ROI correlation between mean pseudo-CT– and CT-based SUVs (A) and between maximum pseudo-CT– and CT-based SUVs (C). (B and D) Bland–Altman plots of SUVmean (B) and SUVmax (D). CSF = cerebrospinal fluid; GM = gray matter; WM = white matter.
Experiments on Clinical Data
To perform a validation on real data, we acquired MR, PET, and CT volumes of a subject. The institutional review board (Fundación HM Hospitales) approved this study, and the subject gave written informed consent.
MR and PET images of the head were acquired on a Biograph mMR scanner (Siemens) using the body coil for excitation and an 8-channel quadrature brain coil for reception. We acquired a 3D T1-weighted magnetization-prepared rapid-acquisition gradient-echo volume with a repetition time of 1,800 ms, TE of 2.65 ms, inversion time of 900 ms, 1 excitation, acquisition matrix of 250 × 250 × 250, resolution of 1 × 1 × 1 mm, and flip angle of 9°. Furthermore, to obtain the AC map, we acquired a double-ultrashort-TE sequence with a repetition time of 11.94 ms, first TE of 0.07 ms, second TE of 2.46 ms, 1 excitation, acquisition matrix of 192 × 192 × 192, resolution of 1.56 × 1.56 × 1.56 mm, and flip angle of 10°, as well as a Dixon sequence with a repetition time of 3.6 ms, first TE of 1.23 ms, second TE of 2.46 ms, acquisition matrix of 192 × 126 × 128, resolution of 2.08 × 2.08 × 2.34 mm, and flip angle of 10°.
Low-dose CT images were acquired on an Aquilion Prime CT scanner (Toshiba) with a matrix of 512 × 512, resolution of 0.43 × 0.43 mm, slice thickness of 1 mm, pitch of 0.62 mm, acquisition angle of 0°, voltage of 120 kV, and radiation intensity of 200 mA.
The subject was administered 129.1 MBq of 18F-FDG. PET data were acquired 20 min after the injection at a single bed position for 15 min. The images without AC were reconstructed using the iterative algorithm provided by the manufacturer (ordinary Poisson ordered-subsets expectation maximization) with 6 iterations and 21 subsets, a reconstruction matrix of 344 × 344 × 127, and a resolution of 2.09 × 2.09 × 2.03 mm. The reconstruction included a point-spread function model.
We synthesized the pseudo-CT volume using the atlas with 10 volume pairs and the same processing pipeline as in previous experiments. The reconstructed image without AC was projected with the same code as that used in the previous section. The resulting sinograms were then corrected for attenuation using the 3 different AC maps (CT-based, ultrashort-TE MRI–based, and pseudo-CT–based). The corrected sinograms were reconstructed with the 3D ordered-subsets expectation maximization algorithm with 30 iterations and 1 subset, a reconstruction matrix of 127 × 127 × 127, and resolution of 2 × 2 × 2 mm.
Figure 7 shows the MR, CT, ultrashort-TE MR, and pseudo-CT images and the result of correcting the PET data with the different volumes. The NCC was 0.5808 between the CT and the ultrashort-TE MR images and 0.8919 between the CT and pseudo-CT images.
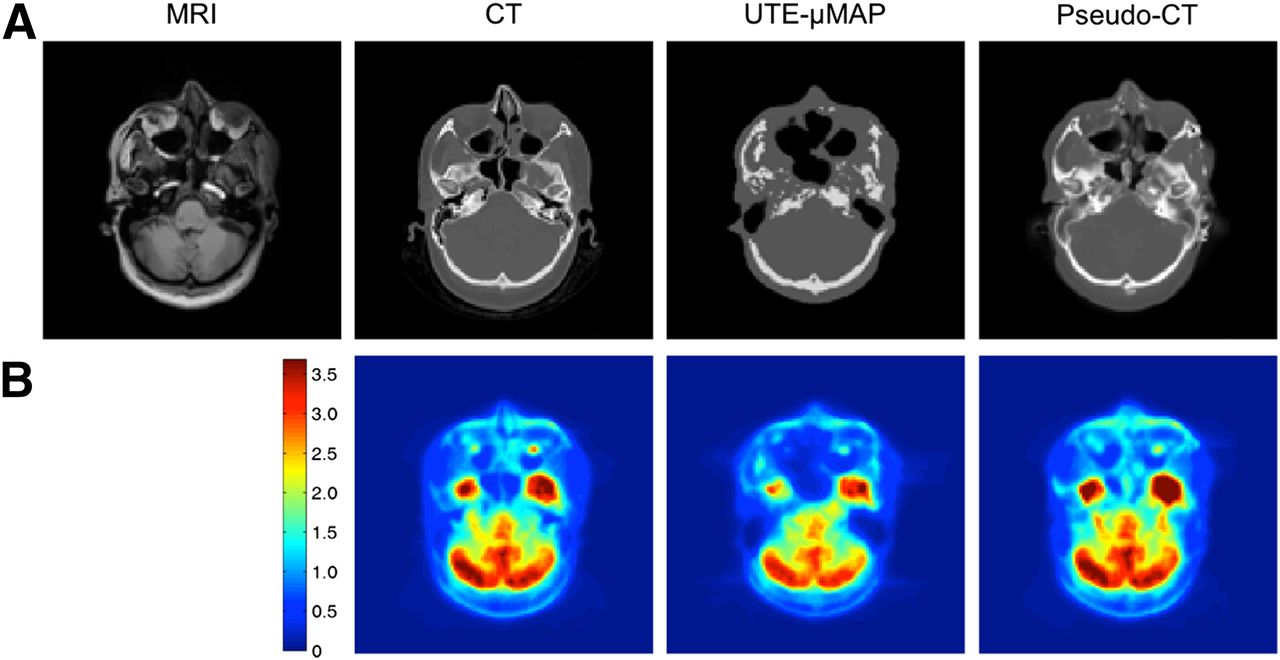
(A) Axial MR, CT, ultrashort-TE MR, and pseudo-CT images from clinical data. (B) Corrected SUV images using different AC maps. UTE-μMAP = ultrashort-TE AC map.
Computational Time
For a 271 × 271 × 221 volume, the complete time to synthesize the pseudo-CT volume for different numbers of images in the multiatlas case is shown in Table 2. In the worst-case scenario (atlas of 10 volumes), computation of the pseudo-CT volume in GPU took less than 9 min, 4,374 times less than with a Matlab (The MathWorks) implementation, 27 times less than with a C implementation, and 11 times less than with an OpenMP multithreaded C version using 32 threads.
Time to Compute Pseudo-CT Volume Using Different Implementations and Atlas Sizes
All experiments were performed on a 3.1-Hz Xeon-E5 2687W (Intel), with 128 GB of random-access memory and Windows (Microsoft) Server 2008 R2 powered with a Tesla K20X GPU (Nvidia Corp.).
DISCUSSION
The generation of accurate AC maps is a basic step for PET/MRI quantification. However, ignoring bone is known to cause a distorted and biased distribution of the reconstructed SUV. Several approaches have been proposed, based mainly on a combination of MR sequences or using image registration to take advantage of a priori acquired CT data. Methods requiring the acquisition of additional MR data show a significant underestimation of activity concentration. Approaches based on nonrigid image registration are computationally intensive and are normally unable to deal with local changes in anatomy due to disease or implants.
We propose the use of a patch-based method for synthesizing a pseudo-CT volume from a single T1-weighted MR volume. Compared with nonrigid registration methods, the patch-based approach uses information from only those volumes in the atlas that actually match the patch, preventing errors due to misregistration and allowing accommodation for local morphologic changes in the images.
Our results are in line with those recently described by Burgos et al. (15). However, our method eliminates the need for image registration, providing results with the same accuracy while allowing use of a much faster algorithm.
We have evaluated our method both qualitatively and quantitatively for PET/MR correction. The visual (Fig. 1) and quantitative (Fig. 4) analyses of image quality showed that CT and pseudo-CT images are very similar. The high NCC values indicate that our method can accurately approximate the patient-specific CT volume. We also showed that in a subject with a dental restoration, results were better than with CT-based AC maps (Fig. 3). No significant differences were found in any ROI except the skin, for which the deviation was −0.006126 ± 0.004088 (P = 0.0039) (Table 1); this result may be due to the fact that the skin is the thinnest ROI and that small errors in estimation of the region can therefore have a large effect on the result. Because the CT scan is not for diagnostic purposes, the level of detail of the pseudo-CT scan does not need to match an actual acquired CT scan.
The attenuation coefficients that we derived in both cases from the Hounsfield values using the transformation proposed by Nakamoto et al. (28) differed slightly from the values assigned to these tissues in other publications. However, our results are independent of the transformation used, as we were comparing the pseudo-CT volume generated by our method to a gold standard CT volume and the same transformation was used in both to obtain the attenuation values.
Analysis of the absolute error maps (error = pseudo-CT–based – CT-based) confirmed that there are small differences between the two approaches, mainly in the air interface zones, where the PET activity is low and usually not relevant for clinical applications (Fig. 4). The ROI analysis showed a strong correlation between attenuation-free SUV images and pseudo-CT–based corrected SUV images (Fig. 6). In evaluating the impact of the method on a normal PET brain scan, we considered only a standard 18F-FDG biodistribution but expect similar small deviations with other radiotracers.
We have also tested our method on real clinical data. Using the real CT volume of the subject as a gold standard, we compared the pseudo-CT image obtained with our method and the ultrashort-TE MR image currently used for AC in the mMR scanner. The ultrashort-TE MR image is not able to differentiate air from bone in certain regions, leading to errors in the final PET image (Fig. 7). The NCC for the clinical data is lower than that for the test data, possibly because of the different scanners and sequences used to acquire the clinical data and the atlas volumes. As future research, we will design similarity measures that are robust to such changes.
Our study neglected the impact of possible deviations in the MR-derived AC map when scatter correction was considered. The distribution of scatter in the sinogram is usually smooth, and the effects of AC map deviations on scatter correction are averaged over many sinogram bins. Therefore, small deviations in the AC map will have a modest impact on scatter correction, especially as the scaling factor used to fit the estimated scatter distribution to the experimental data would remove any overall bias that might be introduced. Our study also neglected the effect of possible errors in modeling the attenuation of the MR coils (12). However, this effect can be controlled in clinical practice with appropriate scanner modeling, calibrations, and acquisition protocols.
The method is highly parallelizable, as each voxel is computed independently. This has allowed implementation of a GPU version that provides a complete pseudo-CT volume during a time similar to that needed to acquire an actual CT scan. Because there is still room for improvement in the GPU implementation, it may be possible to speed up the algorithm further.
We have validated our approach using a set of 10 whole-head volume pairs from healthy subjects, in contrast to the typical brain studies that do not include the neck, which is difficult to synthesize because of its anatomic complexity and variability.
Our technique could, in theory, be applied to other regions of the body. Registration-based approaches are not so straightforward as our approach in other regions, because of stronger intersubject anatomic differences. In a real clinical application, the atlas should be designed to include the necessary anatomic heterogeneity. The design of specific databases that take into account skull lesions will be a future line of research. However, our study suggests that SUVs measured on PET/MR and those measured on PET/CT are close enough; this finding makes our approach feasible for qualitative interpretation of PET scans for diagnostic purposes. The method should be further validated on images with distinct regions, such as tumors.
CONCLUSION
In this work, we showed how the use of patch-based techniques to estimate pseudo-CT images from T1-weighted MR images allows determination of accurate AC maps for use in hybrid PET/MR systems. The proposed method estimates a pseudo-CT volume with similar accuracy to a patient-specific CT volume, without the need for a registration step. Atlas-based approaches avoid the oversimplification of most of the previously proposed segmented MR image–based methods, which assume that all voxels in the same tissue type should have the same attenuation coefficients. The GPU implementation led to a substantial decrease in computational time, making the approach suitable for real applications.
DISCLOSURE
The costs of publication of this article were defrayed in part by the payment of page charges. Therefore, and solely to indicate this fact, this article is hereby marked “advertisement” in accordance with 18 USC section 1734. This project was supported in part by Consejería de Educación, Juventud y Deporte de la Comunidad de Madrid, through the Madrid-MIT M+Visión Consortium and the Seventh Framework Programme of the European Union, and project TEC2012-39095-C03-01 of the Spanish Ministry of Economy and Competitiveness. No other potential conflict of interest relevant to this article was reported.
Acknowledgments
We thank the anonymous reviewers for their valuable comments and suggestions that helped to improve the quality of the study.
Footnotes
Published online Oct. 22, 2015.
- © 2016 by the Society of Nuclear Medicine and Molecular Imaging, Inc.
REFERENCES
- Received for publication February 20, 2015.
- Accepted for publication October 7, 2015.


Jump to section
Related Articles
Cited By...
- A High-Resolution Head and Brain Computer Model for Forward and Inverse EEG Simulation
- Synthesis of Patient-Specific Transmission Data for PET Attenuation Correction for PET/MRI Neuroimaging Using a Convolutional Neural Network
- Dixon-VIBE Deep Learning (DIVIDE) Pseudo-CT Synthesis for Pelvis PET/MR Attenuation Correction
- PET/MRI in the Presence of Metal Implants: Completion of the Attenuation Map from PET Emission Data