


Abstract
AKT (a serine/threonine-specific protein kinase) regulates many cellular processes contributing to cytotoxic drug resistance. This study’s primary objective examined the relationship between GSK2141795, an oral, pan-AKT inhibitor, and 18F-FDG PET markers of glucose metabolism in tumor tissue to determine whether 18F-FDG PET could be used to guide personalized dosing of GSK2141795. Biomarker analysis of biopsies was also undertaken. Methods: Twelve patients were enrolled in 3 cohorts; all underwent dynamic 18F-FDG PET scans and serial pharmacokinetic sampling at baseline, week 2, and week 4 with tumor biopsies before treatment and at week 4. Response was evaluated by RECIST v1.1 and Gynecologic Cancer Intergroup criteria. Biopsy samples were analyzed for mutations and protein expression. Results: GSK2141795 did not significantly influence blood glucose levels. No dose–response relationship was observed between GSK2141795 pharmacokinetics and 18F-FDG PET pharmacodynamic measures; however, an exposure–response relationship was seen between maximum drug concentrations and maximal decrease in 18F-FDG uptake in the best-responding tumor. This relationship also held for pharmacokinetic parameters of exposure and 1,5-anhydroglucitol (a systemic measure of glucose metabolism). Phospho-AKT upregulation at week 4 in biopsies confirmed AKT inhibition by GSK2141795. Single-agent activity was observed with a clinical benefit rate of 27% (3/11) and 30% (3/10) CA125 response in the study’s platinum-resistant ovarian patients. AKT pathway activation by PIK3CA/PIK3R1 mutation did not correlate with clinical activity, whereas RAS/RAF pathway mutations did segregate with resistance to AKT inhibition. Conclusion: GSK2141795 demonstrated an exposure–response relationship with decreased 18F-FDG uptake and is active and tolerable. This study’s design integrating 18F-FDG PET, pharmacokinetics, and biomarker analyses demonstrates the potential for clinical development for personalized treatment.
The serine-threonine kinase AKT plays a central role in multiple cellular processes important to carcinogenesis, making it an attractive anticancer therapeutic target (1,2). The PI3K/AKT pathway also plays an evolutionarily conserved role in glucose metabolism where it acts to transduce intracellular signals downstream of insulin and the insulinlike-growth factor (3). The 3 AKT isoforms (AKT1, 2, and 3) are highly homologous yet differ in quantitative levels of tissue-specific expression, which determines the relative contribution of each isoform to glucose metabolism and insulin signaling (4–6).
GSK2141795 is a potent, oral, adenosine triphosphate–competitive pan-kinase inhibitor. In the first-time-in-human study, the maximum tolerated dose of GSK2141795 was 75 mg daily; however, tumor target engagement level at this dose was not elucidated, leading to this study.
Preclinical data indicate that knockout of AKT2 in mice results in insulin resistance with a diabetes mellitus–like syndrome (7,8). In contrast, AKT1-deficient mice display an opposing phenotype with increased insulin sensitivity (9). AKT also has a direct effect on tumor glucose metabolism by stimulating aerobic glycolysis and survival (10). Tumors with PI3K/AKT pathway activation have robust 18F-FDG uptake by PET scanning suggesting that PI3K/AKT pathway inhibition should inhibit glucose metabolism and decrease 18F-FDG PET avidity (11).
This study’s hypothesis was that inhibition of glucose uptake visualized by 18F-FDG PET imaging could be used as a pharmacodynamic (PD) marker of AKT inhibition at the tumor level and that if a relationship could be established between GSK2141795 exposure and glucose inhibition in tumors, 18F-FDG PET imaging could be used as a surrogate marker of GSK2141795 pharmacokinetics (PK). In this way 18F-FDG PET imaging could enable personalized dosing of GSK2141795.
The primary objective of this study was to explore the relationship between changes in glucose metabolism at the tumor level (18F-FDG PET) and systemically (1,5-anhydroglucitol [1,5-AG]), with PK parameters of GSK2141795 exposure. Secondary objectives included characterization of PK, safety, tolerability, and clinical activity of GSK2141795. Exploratory objectives included evaluation of paired pretreatment and on-treatment tumor biopsies using immunohistochemistry and reversed-phase protein array (RPPA) to correlate imaging findings with changes in the PI3K/AKT pathway and tumor DNA sequencing (e.g., KRAS mutation, PIK3CA mutation) as potential predictive markers of response to GSK2141795.
The preclinical rationale for AKT inhibition in platinum-resistant ovarian cancer was based on in vitro data that small-interfering RNA inhibition of AKT in platinum-resistant ovarian cancer cells could dramatically resensitize these cells to platinum chemotherapy (12) and that in in vitro and preclinical molecular imaging studies with 18F-FDG and 3′-deoxy-3′-18F-fluorothymidine PET this could be recapitulated using a pharmacologic AKT inhibitor (11), raising the hope that a similar strategy could succeed in clinical trials. The wider purpose of this study was therefore to investigate whether molecular imaging could be used to determine optimal dosing of GSK2141795 in individuals, which would be needed to resensitize to platinum chemotherapy in resistant patients.
MATERIALS AND METHODS
This was an open-label, 2-stage, phase I study conducted at Imperial College London. 18F-FDG PET imaging was conducted at the GlaxoSmithKline Clinical Imaging Centre. Detailed entry and exclusion criteria are summarized in the study protocol (supplemental materials, available at http://jnm.snmjournals.org). Eligible patients had a histologically or cytologically confirmed diagnosis of 18F-FDG PET–positive recurrent or persistent ovarian cancer or endometrial cancer; measurable disease 2 cm or greater; Eastern Cooperative Oncology Group performance status of 0, 1, or 2; adequate organ function manifested by certain prospectively defined laboratory parameters; and left-ventricular ejection fraction 50% or greater. The study protocol was approved by the West London Research Ethics Committee, and all subjects signed a written informed consent form. Study was registered as NCT01266954 at ClinicalTrials.gov. Approval was also obtained from the U.K. Administration of Radioactive Substances Advisory Committee.
The study was conducted in 2 stages. Stage 1 evaluated whether continuous dosing of GSK2141795 would confound interpretation of sequential 18F-FDG PET scans and whether 18F-FDG PET could be used as an imaging biomarker for AKT-targeted therapy. Stage 2 assessed dose–response relationships between GSK2141795 and tumor metabolism using sequential PET scans. The study design and decision-making algorithm for progression from stage 1 to stage 2 is included in the supplemental materials.
Twelve patients were enrolled in the study. Four were enrolled in stage 1 and administered 50 mg of oral GSK2141795 daily for 4 wk (cohort 1), followed by dose escalation to 75 mg daily. Four additional patients were enrolled in each of 2 sequential cohorts of 75 mg daily continuously (cohort 2) or 25 mg for 2 wk followed by dose escalation to 75 mg daily (cohort 3). On the day of the week 2 (W2) and week 4 (W4) scans, GSK2141795 was administered 2–3 h before scan start to ensure that the scan was performed at Cmax (maximum plasma concentration). Dose modifications were made for clinically significant adverse events (AEs) as determined by investigators. Specific dose modification guidelines were provided for QTc prolongation, liver chemistry abnormalities, hypoglycemia, and hyperglycemia.
Study assessments included the collection of archival tumor samples, safety evaluations, limited-field-of-view dynamic PET scans, laboratory tests including 1,5-AG, optional biopsies, and disease assessments at time points outlined in the supplemental materials. Arterial blood sampling was performed concurrent with PET scans for patients enrolled in cohort 1. Blood samples for PK analysis were obtained at W2 and W4 predose and at 1, 2, 3, 4, 5, 8, and 24 h postdose.
PK
Plasma samples were analyzed using a validated method based on liquid–liquid extraction, followed by high-pressure liquid chromatography-mass spectrometry/mass spectrometry analysis. The lower and higher limits of quantification for GSK2141795 were 1 and 1,000 ng/mL, respectively, using a 100-μL aliquot of human plasma. GSK2141795 plasma concentrations and actual sample time data were analyzed using noncompartmental methods (Phoenix WinNonlin 6.3; Cetera USA, Inc.).
Quantitative 18F-FDG PET
PET/CT imaging was performed on Siemens HiRez 6 (field of view, 22 cm) or TruePoint PET/CT scanners (field of view, 16 cm). Patients fasted for at least 6 h before each scan. A CT attenuation scan followed by dynamic 90-min PET imaging focused on the tumors was obtained after administration of 300 MBq of 18F-FDG. PET images were reconstructed and corrected for motion during PET acquisition using a rigid-body algorithm. Tumor and normal regions of interest on PET/CT were defined on the summated PET images using Analyze software (Biomedical Imaging Resource) and applied to the dynamic images to obtain radioactivity versus time curves, which were normalized for injected radioactivity and patient’s body weight (Supplemental Table 1 details the anatomic tumor locations). The semiquantitative parameter maximum standardized uptake value between 60 and 90 min (SUVmax(60–90)) was calculated.
The quantitative parameters Ki and the metabolic rate of 18F-FDG (MRfdg) were also calculated (13,14). Ki represents the rate of 18F-FDG trapping in a specific tissue and is a combined measurement of 18F-FDG transport across the cell membrane and the rate of 18F-FDG phosphorylation, whereas MRfdg is a product of Ki and blood glucose.
An image-derived input function (blood radioactivity over time) obtained from aortic activity within the PET camera’s field of view was used to model plasma radioactivity (input) versus tissue radioactivity (output) over time to obtain quantitative parameters for all patients. The use of an image-derived input function for modeling was validated in this study against an arterial input function obtained from radial arterial sampling of blood from patients in cohort 1.
Exploratory Biomarker Studies
Three core biopsies were taken at pretreatment and W4 for each patient; 2 were fixed (1 formalin fixed/paraffin embedded, 1 ethanol [70%] fixed) and 1 was fresh frozen for mutation and proteomic analysis. Fixed samples were assessed for tumor cellularity, heterogeneity, and expression levels of candidate PD biomarkers by immunohistochemistry. Analyses were performed by Mosaic Laboratories and Imperial College London Histopathology Laboratories using standard methods and antibodies as outlined in Supplemental Table 2.
After intra- and interbiopsy heterogeneity assessment of paraffin-embedded biopsies as a reference point, RPPA data derived from the fresh-frozen biopsies (pretreatment and W4) were generated as described previously (15) (MD Anderson Cancer Center) and evaluated for changes in AKT and phospho-AKT.
DNA was isolated from archival formalin-fixed/paraffin-embedded samples (Response Genetics) and analyzed using a custom genotyping assay on the Illumina Golden Gate platform (Illumina, Inc.) covering 78 genes and 480 probes/mutations (Supplemental Table 3). DNA was also isolated from cell pellets produced during protein extraction and from archival formalin-fixed/paraffin-embedded shavings. These samples were subjected to hot spot mutation detection by a mass spectroscopy–based approach evaluating single nucleotide polymorphisms using Sequenom’s MassARRAY platform covering 17 genes and 147 mutations at MD Anderson Cancer Center (Supplemental Table 4).
Tumor Response Evaluation
Tumor response was evaluated according to RECIST 1.1 (16) and the 2005 Gynecologic Cancer Intergroup (GCIG) criteria for CA125 (which was not prospectively defined in the protocol) (17).
Statistics
For 18F-FDG PET analyses using SUVmax(60–90), Ki, and MRfdg, raw and mean values (over tumor locations) for each patient at each time point were descriptively explored. Postbaseline mean and percentage change from baseline of the mean PET parameters (across tumor locations) were considered missing if any baseline tumor location was missing postbaseline. GSK2141795 PK parameters were summarized descriptively. Exploratory analyses including simple linear regression models were performed to assess the potential relationship between GSK2141795 exposure and PD endpoints including changes in 18F-FDG PET parameters and 1,5-AG. Immunohistochemistry and genetic mutation data were each descriptively explored. RPPA data were investigated post hoc; paired t tests comparing pretreatment and W4 AKT and phospho-AKT protein expression levels were evaluated.
RESULTS
Twelve patients (11 ovarian and 1 endometrial) were enrolled between June and November 2010 (median age, 64.5 y; age range, 45–78 y). All ovarian cancer patients were platinum-resistant (18,19) and had received at least 1 line of prior therapy (median, 3.5 lines). Eight of 11 (73%) of the patients with ovarian cancer had serous histology and all had measurable disease.
Safety and Tolerability
Of the 12 patients enrolled, 3 were withdrawn because of an AE, and 9 were withdrawn because of disease progression. Nine patients had GSK2141795 interrupted because of AEs (3 being drug-related), and 2 patients were dose-reduced because of AEs. All patients reported at least 1 AE, with nausea and lethargy being the most commonly reported (Table 1). Seven patients experienced grade 3/4 AEs (4 grade 3 AEs were attributed to the study drug). Three grade 4 events (renal failure, thrombocytopenia, and vomiting) were reported in 2 patients. No fatal events were reported on the study drug.
Summary of All AEs with Relatedness by Maximum Toxicity Grade Occurring in ≥25% of Patients (n = 12)
PK Results
Because most patients had PK sampling only up to 5 h postdose (the optional 8- and 24-h postdose time points were infrequently obtained), the area under the concentration–time curve from time 0 to 5 h postdose (AUC0–5) was used in the analysis. Cmax occurred 1–5.5 h postdose. AUC and Cmax generally increased with increasing dose, although values across dose groups overlapped (Supplemental Fig. 1). Exposures (AUC0–5 and Cmax) were approximately 1.2-fold (range, 0–1.5) higher at W4 than W2 when the same dose was given for 4 wk, suggesting that GSK2141795 was not at steady state in all patients at W2 (Table 2). The apparent half-life is approximately 2–4 d (20).
Summary of Derived GSK2141795 PK Parameters
18F-FDG PET Analysis
All 12 patients administered GSK2141795 underwent dynamic 18F-FDG PET scans. PET scans were not obtained on W4 for 3 patients and on W2 for 1 patient. The strong correlation between the Ki values derived using radial arterial input function and image-derived input function for cohort 1 (Supplemental Fig. 2) validated the use of an image-derived input function to derive quantitative parameters, precluding the need to obtain further radial arterial samples in subsequent cohorts.
Although there was considerable heterogeneity in 18F-FDG uptake (SUVmax(60–90), Ki, and MRfdg) (Fig. 1 and Supplemental Figs. 3 and 4, respectively) among individual tumors in each patient, the mean change from W2 to W4 SUVmax(60–90) in the 3 stage 1 patients who underwent both W2 and W4 scans was less than 15%. This observation suggested that changes in 18F-FDG uptake from W2 to W4 were within physiologic variability and unlikely to be due to the cumulative effect of continuous repeated doses of GSK2141795.
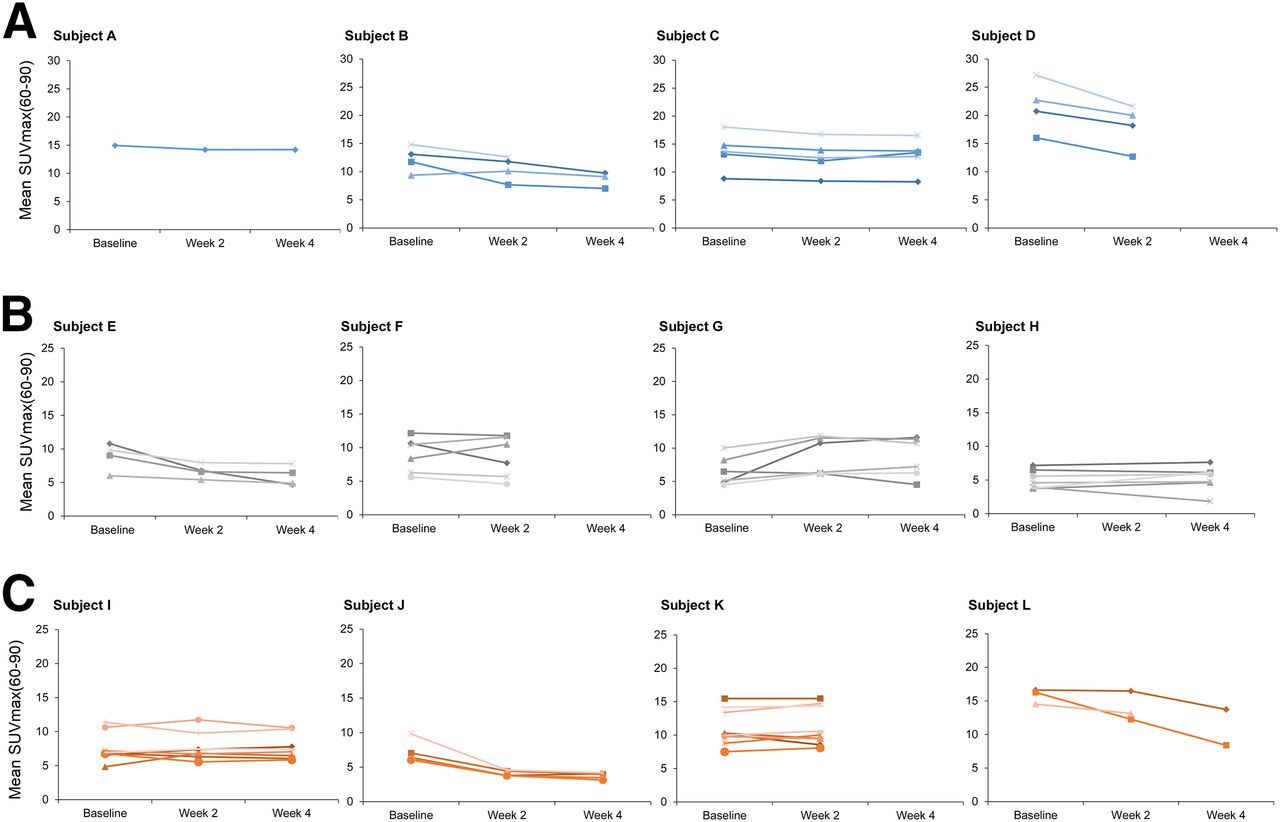
18F-FDG uptake parameter SUVmax(60–90) over time. Each patient is represented in individual panel with individual tumors represented by separate lines. x-axis represents time points (baseline, W2, and W4) at which parameters SUVmax(60–90) (g/mL) were determined. Subjects were treated with 50 mg for 4 wk (A), 75 mg for 4 wk (B), and 25 mg for 2 wk and 75 mg thereafter (C).
Dominant lesion (tumor with the highest 18F-FDG uptake within each patient) at baseline was rarely the best-responding tumor (Fig. 1), and although the decrease in SUVmax of tumors with the highest 18F-FDG uptake of all patients at W2 was significant (P = 0.04), it was not significant at W4 (P = 0.128) compared with baseline (SF-5).
All patients had pre-PET scan fasting blood glucose levels of less than 7.5 mmol/L. Overall, the impact of blood glucose on tumor 18F-FDG measurements was predicted to be minimal, an observation supported by the high degree of correlation between SUVmax(60–90) and the quantitative parameter Ki (r2 = 0.89) (Fig. 2) (21–23).
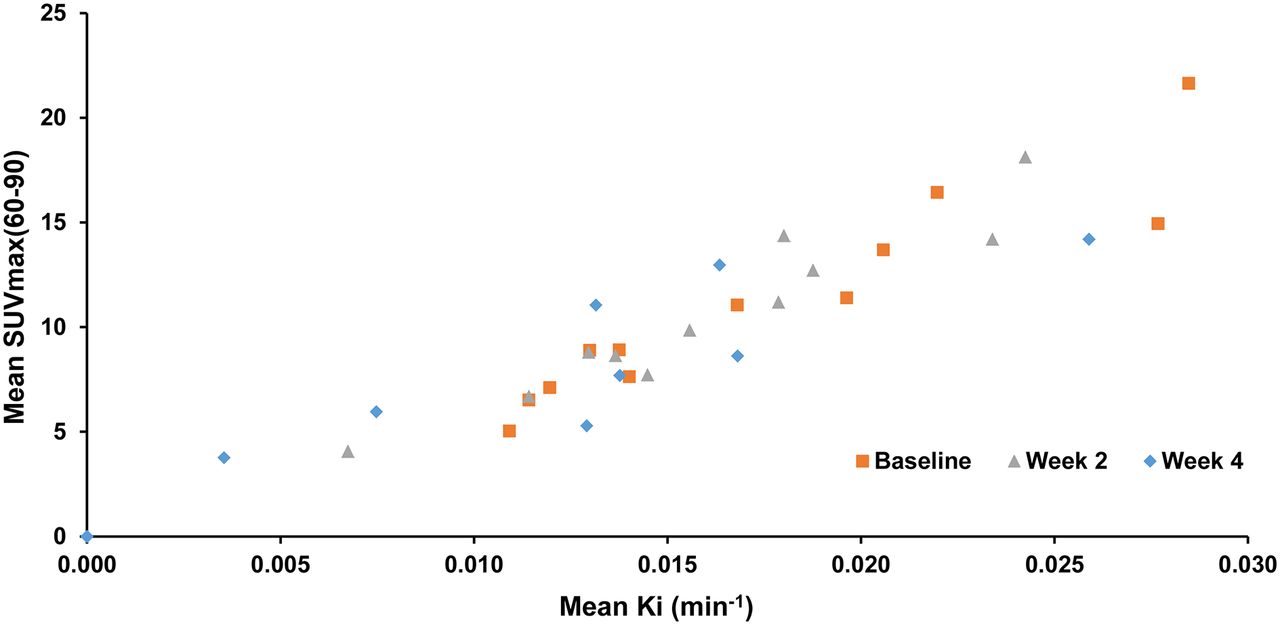
Correlation of SUVmax(60–90) and Ki. Scatterplot of mean SUVmax(60–90) versus mean Ki by time shows good correlation (r2 = 0.89). Baseline, W2, and W4 values are represented in black, red, and green, respectively.
PK/PD Analysis
The potential exposure–response relationships between various PK parameters for GSK2141795 and both tumor and systemic markers of glucose metabolism were explored.
18F-FDG PET
The strongest linear relationships between PK and 18F-FDG PET PD parameters were observed between the best PET–responding tumor in each patient regardless of time point—that is, the individual tumor within each patient demonstrating the greatest percentage change from baseline in Ki, SUVmax(60–90), and MRfdg values with the Cmax value for that same patient at the same wk as the 18F-FDG PET parameter (P = 0.001, r2 = 0.6593 for Ki; P = 0.002, r2 = 0.6186 for SUVmax(60–90); and P = 0.0018, r2 = 0.6395 for MRfdg). The relationship was weaker if the greater mean percentage change from baseline of each 18F-FDG PET parameter averaged across tumors was used (Ki example in Fig. 3; SUVmax(60–90) and MRfdg in Supplemental Figs. 6A and 6B and 6C and 6D) (P = 0.0946, r2 = 0.2542; P = 0.03298, r2 = 0.3793; P = 0.2502, r2 = 0.1297, respectively).

Linear regression analysis of PK/PD relationship (Ki). Greatest percentage change from baseline for Ki averaged over tumors (A) and for an individual's best responding tumor (B) versus Cmax. Each point represents data from 1 patient. Solid line represents linear regression line, with dotted lines representing 90% confidence intervals. Regression estimates, r2, and P values associated with tests assessing significance of regression slope are provided.
1,5-AG
1,5-AG, a metabolically inert, naturally occurring 1-deoxy form of glucose, competes with glucose for reabsorption in the kidney (24), such that increased blood glucose levels result in decreased 1,5-AG blood levels. Eight of 12 patients had a decrease from baseline in 1,5-AG (−5% to −88%). Two patients with the greatest decreases in 1,5-AG (−88% and −87%) also had AEs of hyperglycemia.
The relationships between 1,5-AG percentage change from baseline and PK parameters were evaluated for W2 and W4 separately using all available data. Three patients with missing data on W4 were not included in the W4 analysis. In general, the inverse linear relationships between 1,5-AG and PK variables at W4 had greater r2 values and were statistically significant (P < 0.05) as compared with W2. This observation suggests that either the changes in 1,5-AG did not reach steady state until at least W4 (Fig. 4) or that the increase in dose from 25 to 75 mg (cohort 3) led to greater effects on 1,5-AG. Although the fit for all 3 PK parameters was similar, the best fit was the relationship between 1,5-AG percentage change from baseline versus Ct (predose) (P = 0.0021, r2 = 0.8156) (examples in Fig. 4; AUC0–5 and Cmax data in Supplemental Table 5).

Linear regression analysis of PK/PD relationship (1,5-AG). Percentage change from baseline in 1,5-AG at W2 (A) and W4 (B) versus Ct (predose). Each point represents data from 1 patient. Solid line represents linear regression line, with dotted lines representing 90% confidence intervals. Regression estimates, r2, and P values associated with tests assessing significance of regression slope are provided.
Exploratory Biomarker Studies
Archival samples were collected from all patients enrolled on the trial. Core biopsies were performed as follows: n = 12, pretreatment; n = 10, W4. Of the 58 core biopsies obtained, only 1 complication, a self-limiting intraabdominal hematoma, was encountered (1.7%).
Proteins
AKT protein levels in paired biopsies (pretreatment and W4 on-treatment) were evaluated by RPPA and immunohistochemistry. Decreases in total AKT (P = 0.0259) and increases in the phospho-AKT/total AKT ratio (P = 0.0217) at W4 compared with baseline by RPPA were observed across all patients regardless of response to GSK2141795, an observation consistent with PD target engagement (Fig. 5).
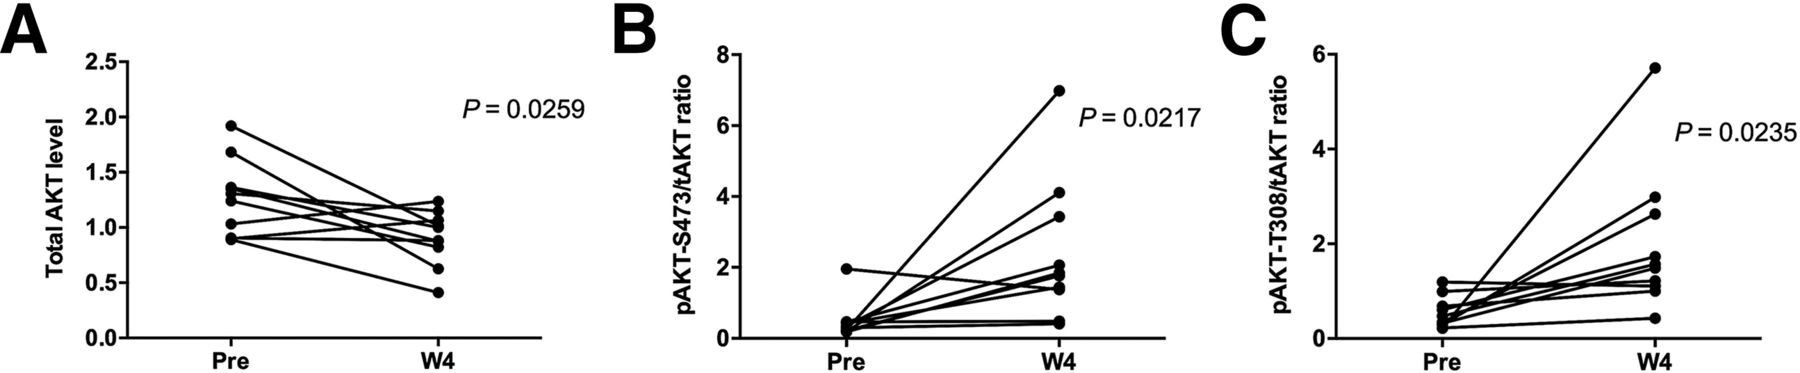
AKT protein expression detected in RPPA from pretreatment and W4 on-treatment biopsies. Across all patients, RPPA showed significant changes in AKT levels at W4 compared with pretreatment consistent with PD target engagement with decrease in mean levels of total AKT (A) and increase in phospho-AKT/total AKT ratio (B and C). Increase in phospho-AKT levels at W4 was independently confirmed and cross-validated by immunohistochemistry (data not shown).
Genetics
PIK3CA (p110alpha) or PIK3R1 (p85 gamma) mutations were seen in 5 of 11 of patients with ovarian cancer (Fig. 6). Cooccurring RAS/RAF mutations (KRAS, HRAS, or BRAF) were observed in 2 of 5 ovarian cancer patients with either a PIK3CA or a PIK3R1 mutation. Of the 6 patients with PIK3CA or PIK3R1 mutations, only 1 (clear cell) had a response to GSK2141795. The other clear cell patient with cooccurring RAS mutations did not respond.
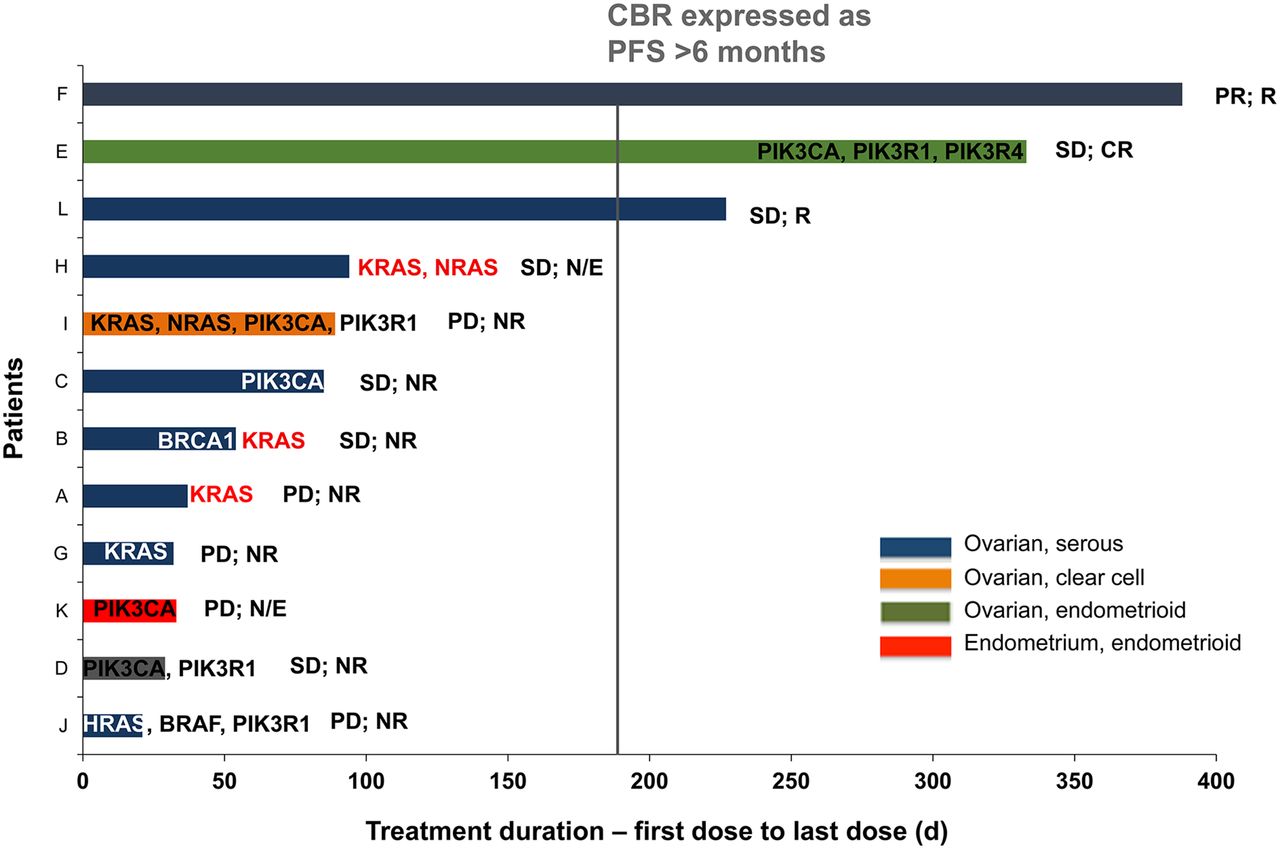
Plot of duration of treatment and responses by tumor type (all treated population). Each patient is represented by a bar. Patients are noted on y-axis, and x-axis denotes time from first dose in days (d). Corresponding RAS/RAF and PI3K pathway mutations detected in Sequenom and Illumina platform from archival (black and white) and pretreatment biopsy samples (red)—that is, gain of mutations—which were not detected in archival samples but detected in prestudy samples are provided. Corresponding response statuses of each patient (RECIST and GCIG) are provided. CBR = clinical benefit rate; CR = complete response; N/E = not evaluable; NR = nonresponse; PD = progressive disease; PFS = progression-free survival; PR = partial response; R = response.
Clinical Response
All 12 patients had measureable disease by RECIST; 1 partial response was reported (overall response rate, 8%) although 2 additional patients continued on trial for more than 6 mo (clinical benefit rate, 27%) (Fig. 6). Ten of 11 patients with ovarian cancer were evaluable based on CA125 GCIG criteria (17); 3 of 10 had a CA125 response.
DISCUSSION
GSK2141795 is an oral nanomolar pan-AKT kinase inhibitor that influences glucose uptake and inhibits cellular proliferation in some cell lines and xenograft models (25). The purpose of this trial was to explore whether GSK2141795 could decrease tumor glucose metabolism and whether a relationship could be established between changes in glucose metabolism in tumors (measured with 18F-FDG PET) and PK parameters. If such a relationship could be established, it would be possible to use 18F-FDG PET to guide personalized dosing of GSK2141795.
We did not observe a dose–response relationship between GSK2141795 and 18F-FDG PET uptake in this study. However, this is not surprising, as an overlap in plasma exposure was observed at the narrow range of doses (25–75 mg) evaluated in this study. Despite the inability to clearly differentiate plasma exposure at the different doses, we have for the first time demonstrated an exposure–response relationship between maximal drug concentrations and 18F-FDG uptake in the best-responding tumor within each patient, irrespective of the dose the subject received, confirming our hypothesis regarding the utility of 18F-FDG PET as a PD marker of AKT inhibition. A similar relationship between various PK parameters of GSK2141795 exposure and 1,5-AG was also demonstrated, thereby providing additional evidence of target modulation. These surrogate measures of target inhibition were confirmed by demonstration (via immunohistochemistry and RPPA) of increased phospho-AKT levels, which presumably result from feedback inhibition after administration of GSK2141795 (26,27).
Unfortunately, the heterogeneity in 18F-FDG uptake between the various tumors both within and between individual patients, as well as the amount of overlap between the PK parameters measured at each dose, negated a more easily generalizable dose–response relationship. It is not surprising that significant variation was seen in 18F-FDG uptake by individual tumors given recent data suggesting significant intratumor spatial and linear heterogeneity (28–30).
Because AKT inhibition by GSK2141795 can cause hyperglycemia (7–10), thereby altering 18F-FDG tissue uptake, we acquired dynamic 18F-FDG PET scans to derive quantitative PET parameters, which can account for the confounding effects of plasma glucose levels and scan timing (14). Although hyperglycemia adverse events and decreased 1,5-AG levels were observed in this study, fasting blood glucose levels measured before scans were within limits unlikely to affect the evaluation of 18F-FDG uptake in tumors using semiquantitative parameters—a conclusion supported by the high degree of correlation between quantitative and semiquantitative PET parameters.
In general, GSK2141795 administered at doses of 75 mg or less daily was tolerable and demonstrated some activity in this difficult-to-treat group of patients; although based on the preclinical rationale, the hypothesis would be that this modest activity would be synergistic in combination with platinum and other cytotoxics (12). On a genetic level, PIK3CA/PIK3R1 mutations did not obviously segregate with response to GSK2141795 as measured by RECIST or GCIG CA125 criteria; however, RAS/RAF pathway mutations did coincide with lack of response to AKT inhibition (26,27).
There are some caveats to this study that could influence interpretation of the results. First, 18F-FDG PET avidity changes seen in tumors at W2 and W4 may not represent GSK2141795-induced glucose metabolism changes but rather a decrease in the number of viable cancer cells present within the tumor. Although this is theoretically possible, it is unlikely because GSK2141795 and other AKT inhibitors are primarily cytostatic in cell culture (12) and only minimal change in the sum of the diameters of the target lesions at W4 (range from −15% to +24%) was observed. Furthermore the PK parameters used in the PK/PD (18F-FDG PET) analysis were calculated on the basis of sampling over a limited time period in the postdose setting. Although this approach underestimates the actual AUC of GSK2141795, data from the first-time-in-human study indicate that AUC0–5 is proportional to AUC0–24 (AUC0–24 is the area under the concentration–time curve from time 0 to 24 h postdose), suggesting that the PK/PD (18F-FDG PET) relationship observed would still be observed if AUC0–24 data had been available.
This study will add depth to our next step, the combination of AKT inhibition with platinum chemotherapy in platinum-resistant patients. It is understandable that such a counterintuitive approach requires the maximum supportive information clinically because there are myriad reasons why such a high-risk strategy might fail. This study therefore opens the way for formal phase IB studies of the combination of AKT pan-kinase inhibitors with other chemotherapeutics, particularly platinum, in platinum-resistant patients. Such a phase Ib/II study is under way, and it is hoped that the findings from this imaging study will contribute to the understanding of the phase Ib/II data.
CONCLUSION
Regardless of the caveats, this highly focused, exploratory, translational medicine study is an attempt to guide personalized dosing of a targeted agent based on changes in glucose uptake visualized by 18F-FDG PET and represents the potential future of precision medicine. Although there was a lack of a dose–response relationship of AKT inhibitor possibly because of overlapping plasma concentrations among doses, these findings have added confidence to the path of development of AKT inhibitors in that they should be more based on PK and biomarker-embedded studies with more limited potential for FDG PET for either pharmacologic or clinical development.
DISCLOSURE
The costs of publication of this article were defrayed in part by the payment of page charges. Therefore, and solely to indicate this fact, this article is hereby marked “advertisement” in accordance with 18 USC section 1734. Research support for this study was provided by GlaxoSithKline (GSK), the Imperial College NIHR Biomedical Research Centre, The Imperial College CRUK/NIHR Experimental Cancer Medicine Centre, and the Imperial College Cancer Research UK Clinical Centre and by the SPORE grant from UT MD Anderson Cancer Center. Azeem Saleem, Sabin Carme, Ademi Santiago-Walker, Deborah Smith, and Shannon Morris are past GSK employees and GSK shareholders. Elizabeth Krachey and Christian Salinas are past GSK employees. Sam Madison is a current GSK employee. No other potential conflict of interest relevant to this article was reported.
Acknowledgments
We thank Roger Gunn for support with imaging analysis; Vin Cunningham for input to study design; Yvonne Lewis, Awet Tewolde, Michelle Cunneen, and James Anscombe for coordination and performance of PET imaging; Professor Adil-Al-Nahhas, who is an ARSAC license holder and reported screening PET scans; Brandon Whitcher and Jennifer Gauvin for statistical advice; and Gordon B. Mills and Katherine Stemke Hale for sequencing analysis.
Footnotes
Published online Oct. 1, 2015.
- © 2015 by the Society of Nuclear Medicine and Molecular Imaging, Inc.
REFERENCES
- Received for publication February 25, 2015.
- Accepted for publication September 21, 2015.


