


Abstract
Imaging endogenous gene expression with sequence-specific antisense radiopharmaceuticals is possible if the antisense agent is enabled to traverse the biologic membrane barriers that separate the blood compartment from messenger RNA (mRNA) molecules in the cytoplasm of the target cell. The present studies were designed to image endogenous gene expression in brain cancer using peptide nucleic acid (PNA) antisense agents that were modified to allow for (a) chelation of the 111In radionuclide and (b) attachment to a brain targeting system, which delivers the PNA across both the blood–brain barrier (BBB) and the tumor cell membrane. Methods: PNAs were designed that were antisense to either the rat glial fibrillary acidic protein (GFAP) mRNA or the rat caveolin-1α (CAV) mRNA. The PNA contained an amino-terminal diethylenetriaminepentaacetic acid moiety to chelate 111In and a carboxyl-terminal ε-biotinyl lysine residue, which enabled attachment to the delivery system. The latter comprised streptavidin (SA) and the murine OX26 monoclonal antibody to the rat transferrin receptor (TfR), which were joined by a thiol-ether linker. Control PNAs were not conjugated to SA-OX26. Brain tumors developed after the intracerebral injection of rat RG2 glial cells in adult Fischer CD344 rats. GFAP and CAV gene expression in the tumor in vivo was monitored by confocal microscopy and Northern blotting with GFAP and CAV complementary DNAs. Results: If the PNA was not targeted to the TfR, then no imaging of any brain structures was possible, owing to the absence of PNA transport across the BBB. Conjugation of the 111In-GFAP-PNA to the SA-OX26 delivery system did not image brain cancer, owing to the downregulation of the GFAP mRNA in brain glial tumors. In contrast, brain cancer was selectively imaged with the 111In-CAV-PNA conjugated to SA-OX26 owing to upregulation of CAV gene expression in brain cancer. Conclusion: Imaging endogenous gene expression in vivo with PNA antisense radiopharmaceuticals is possible if drug-targeting technology is used. Attachment of the PNA antisense agent to the targeting ligand enables the antisense radiopharmaceutical to traverse biologic membrane barriers and access intracellular target mRNA molecules.
The development of new technologies that enable the imaging of endogenous gene expression in vivo can complement genetic screening by detecting when a pathologic gene is expressed in adult life. The ability to image aberrant gene expression on a genome-wide basis in humans is possible only with sequence-specific antisense radiopharmaceuticals. However, antisense radiopharmaceuticals are not well transported across the biologic membrane barriers that separate the blood from the intracellular cytoplasm containing the target messenger RNA (mRNA) molecules (1–3). The principal membrane barriers that must be circumvented are the capillary endothelial barrier and the target cell plasma membrane barrier. Therefore, the successful imaging of endogenous gene expression will require the merger of antisense radiopharmaceutical technology with drug-targeting technology (4), so that the antisense radiopharmaceutical may access the target mRNA after an intravenous administration. In prior work on the imaging of gene expression in brain cancer, an antisense peptide nucleic acid (PNA) radiopharmaceutical was combined with brain drug- targeting technology (5). The PNA was radiolabeled with 125I and conjugated to a peptidomimetic monoclonal antibody (mAb) that targeted the transferrin receptor (TfR). The TfR is highly expressed at both the brain capillary endothelium, which forms the blood–brain barrier (BBB) in vivo, and the tumor cell membrane (TCM). However, in these earlier studies, the target gene was not an endogenous gene but, rather, was the luciferase gene, expressed in stably transfected C6 rat glioma cells (5). Luciferase gene expression in the C6-790 brain tumors was then imaged with an 125I-antiluciferase PNA conjugated to the TfRMAb drug-targeting system.
The purpose of these studies was to image the expression in experimental brain cancer of an endogenous gene. The initial gene target used in these studies was the mRNA encoded by the rat glial fibrillary acidic protein (GFAP) gene, which is selectively expressed in brain glial cells and was the target mRNA in an animal PET study of brain cancer gene expression (6). A second goal of the present studies was to produce a targeted PNA radiopharmaceutical that was radiolabeled with the 111In, not the 125I radionuclide. This is because prior work with peptide radiopharmaceuticals labeled with either 125I or 111In showed that the artifactual brain uptake of radioactivity was increased 10-fold when brain imaging agents were labeled with 125I, as compared with 111In (7). The radiopharmaceutical is degraded in peripheral tissues to produce iodotyrosine, which is then transported into brain at rates comparable to the imaging agent. In contrast, metabolites labeled with 111In are retained in peripheral tissues and do not enter blood in parallel with the imaging agent (7). In the present work, a bifunctional GFAP-PNA was designed that is conjugated both with a diethylenetriaminepentaacetic acid (DTPA) moiety, to enable radiolabeling with 111In, and with biotin, for conjugation to the TfRMAb brain drug-targeting system via the use of a streptavidin (SA)-biotin linker (4). In the course of these studies, it was observed that the target GFAP mRNA is actually underexpressed in rat brain tumors. Therefore, the present studies also describe the production of a bifunctional PNA that is targeted against the rat caveolin-1α (CAV) mRNA, which is overexpressed in rat brain gliomas (8). The present studies show that if the antisense PNA is labeled with an appropriate radionuclide, such as 111In, and is conjugated to a brain drug-targeting system to enable transport across biologic membrane barriers, then it is possible to image endogenous gene expression in brain cancer with PNA antisense radiopharmaceuticals.
MATERIALS AND METHODS
Materials
111In-Cl3 (74–185 MBq [2 mCi]) was purchased from Perkin Elmer Life and Analytic Sciences Inc. Monobiotinylated PNAs were custom synthesized by Applied Biosystems, and the molecular weight of all PNAs was confirmed by mass spectrometry. The PNA antisense to the rat GFAP mRNA contained a DTPA moiety at the amino terminus and an ε-biotinyl lysine residue at the carboxyl terminus; after labeling with 111In, this PNA was designated 111In-GFAP-PNA (Fig. 1A). A PNA antisense to the rat CAV mRNA was prepared with a DTPA moiety at the amino terminus and an ε-biotinyl lysine residue at the carboxyl terminus; after labeling with 111In, this PNA was designated 111In-CAV-PNA (Fig. 1B). A Superose 12 HR 10/30 fast protein liquid chromatography (FPLC) column was obtained from Pharmacia Biotech Inc. Chelex-100 resin was obtained from Bio-Rad Laboratories. The mouse mAb against porcine GFAP and the mouse IgG1 isotype control were purchased from Sigma Chemical Co. Recombinant SA and all other reagents were obtained from Sigma.
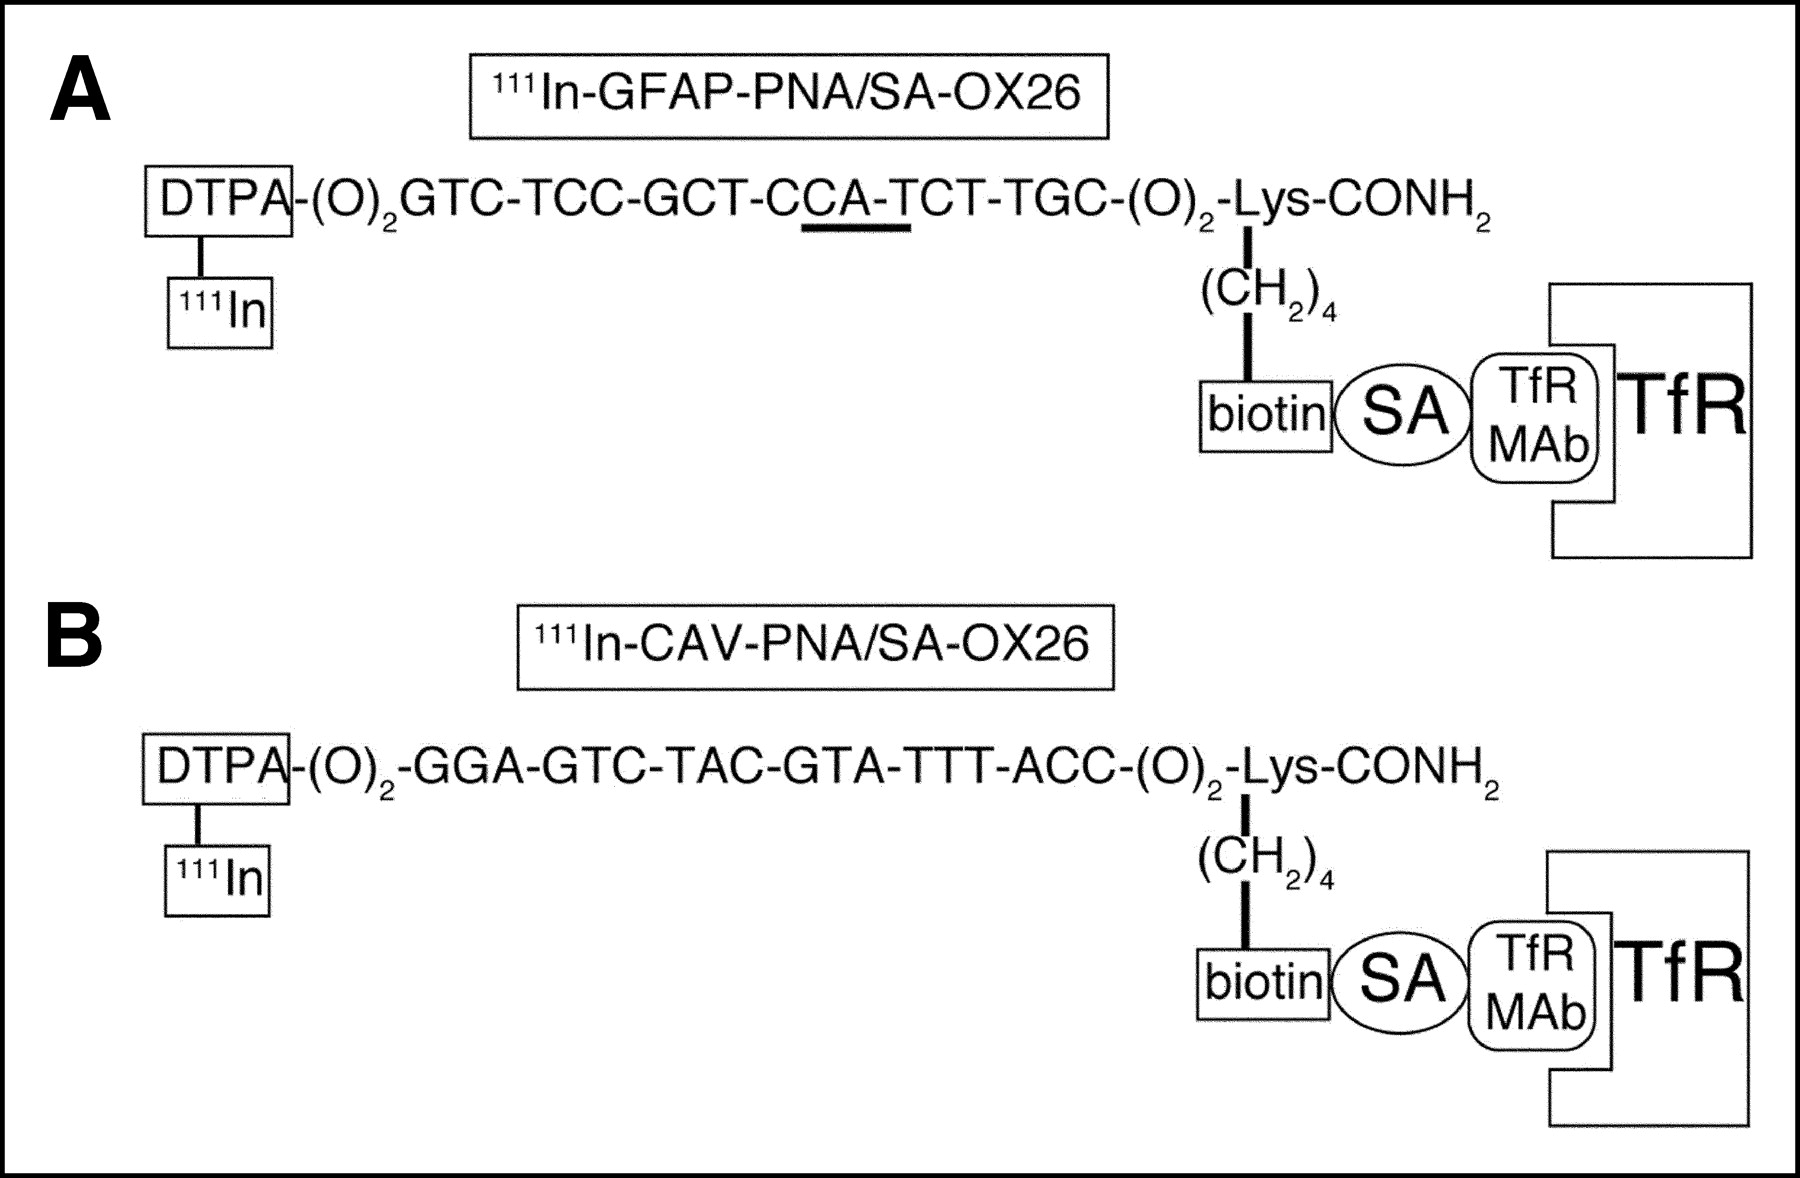
(A) An 18-mer PNA that is antisense to nucleotides 20–37 of rat GFAP mRNA (accession number NM_017009). The triplet that is antisense to GFAP methionine initiation codon (AUG) is underlined. The amino terminus has 2 linkers (O) separating PNA base sequence from amino-terminal DTPA group, where O = (CH2-O-CH2-CH2-O-CH2-CH2-O-CH2). The amino terminus was conjugated with DTPA dianhydride while PNA was still attached to the solid-phase resin during synthesis. At the carboxyl terminus of PNA, which is amidated, there are 2 linkers separating the base sequence from a carboxyl-terminal lysine residue, and the ε-amino group of the lysine residue is conjugated with biotin. Upon mixing, there is immediate attachment of biotinylated PNA to SA conjugated to a mAb to the rat TfR. The TfRMAb and the SA are conjugated with a thiol-ether linkage and this conjugate is designated SA-OX26. (B) An 18-mer PNA that is antisense to nucleotides 10–27 of rat CAV mRNA (accession number AF439778). Apart from the base sequence, CAV-PNA has a structure identical to that of GFAP-PNA shown in A, as both are designed for labeling with 111In.
Conjugation of SA to OX26 mAb
The tetrameric recombinant SA was conjugated to the murine OX26 mAb to the rat TfR with a stable thiol-ether linkage and purified with a Sephacryl S300 gel-filtration column as described (3). This conjugate is designated SA-OX26 and is a 1:1 conjugate of SA and the OX26 mAb. After mixing SA-OX26 with 111In-GFAP-PNA, the final conjugate is designated 111In-GFAP-PNA/SA-OX26 (Fig. 1A). After mixing SA-OX26 with 111In-CAV-PNA, the final conjugate is designated 111In-CAV-PNA/SA-OX26 (Fig. 1B). Alexa Fluor 488- and Alexa Fluor 494-conjugated antibodies were purchased from Molecular Probes.
Radiolabeling of GFAP-PNA or CAV-PNA with 111In
Trace heavy metals were removed from the water used to prepare all buffers by pretreatment with Chelex-100. The 111In (7.4–92 MBq [0.2–2.5 mCi], 4.5–56 pmol) was added to the GFAP-PNA or CAV-PNA (164–328 pmol) in a total volume of 0.2–2.8 mL of Chelex-treated PBST (0.01 mol/L phosphate, 0.15 mol/L NaCl, pH 7.4, 0.05% Tween-20 [ICI Americas, Inc]). After 30 min at room temperature, the 111In-GFAP-PNA or 111In-CAV-PNA was divided into 2 fractions, and SA-OX26 was added to 1 fraction. Radiolabeling of the PNA with 111In was confirmed by Sephadex G-25 size-exclusion chromatography in Chelex-treated PBST.
The conjugate of 111In-PNA and SA-OX26 was prepared by mixing the 111In-PNA (82–164 pmol) with 100 μg of OX26/SA (500 pmol) for 30 min at room temperature. Binding of the 111In-PNA to the SA-OX26 was confirmed by gel-filtration FPLC with a single Superose 12 HR 10/30 column and isocratic elution in PBST at a flow rate of 0.25 mL/min. No free 111In-PNA eluted from the column, indicating that all 111In-PNA is conjugated to OX26/SA.
GFAP Complementary DNA (cDNA) Cloning, In Vitro Transcription, and PNA Northern Blotting
To confirm that the anti-GFAP PNA still hybridizes to the target GFAP mRNA despite conjugation to the SA-OX26 conjugate, it was necessary to produce rat GFAP cloned RNA (cRNA) by in vitro transcription (IVT) of the full-length rat GFAP cDNA. The latter was cloned from a rat brain capillary cDNA library using the LKM65 clone described previously (9). This clone is a partial rat GFAP cDNA that encompasses nucleotides 7904–8145 of the rat GFAP gene (AF028784). The partial GFAP cDNA was isolated previously in a rat BBB genomics study (9), and the rat brain capillary cDNA library in the pSPORT vector was described previously (10). Approximately 3.5 × 10⁵ recombinants of the pSPORT cDNA library were screened with the 32P-clone LKM65 clone with a colony hybridization technique previously described (11). DNA sequencing showed that the GFAP clone was full length. The GFAP cDNA was digested with Not I and Sal I, which released the expected 2.6-kilobase (kb) insert after agarose gel electrophoresis and ethidium bromide staining.
Rat GFAP cRNA was synthesized by IVT with the linearized GFAP-4 cDNA. As a negative control, full-length cRNA was produced by IVT encoding the rat large neutral amino acid transporter type 1 (LAT1); the cloning of rat LAT1 in the pSPORT vector, designated LATNS-6, has been described previously (12). The pSPORT-GFAP-4 or pSPORT-LATNS-6 was linearized with Not I and incubated with T7 polymerase for the production of 5′-capped cRNA using the mMessage mMachine kit (Ambion), as described (10). Capped cRNA was characterized by denaturing gel electrophoresis and ethidium bromide staining. For the Northern analysis, 10, 20, or 50 ng of either rat GFAP or rat LAT1 cRNA was resolved in a 1.5% agarose/2.2 mol/L formaldehyde gel and blotted onto a GeneScreen Plus Membrane (DuPont Life Sciences). Northern blots were probed with 185 kBq (5 μCi) of either unconjugated 111In-GFAP-PNA or 111In-GFAP-PNA/SA-OX26 in hybridization solution (2× Denhardt’s solution, 2× SSPE, 100 μg/mL salmon testes DNA, 100 μg/mL yeast transfer RNA, 50 mg/mL dextran sulfate) at 60°C overnight. Autoradiography was performed with Kodak Biomax MS film with intensifying screens at −20°C overnight. X-ray films were scanned with a Umax PowerLook III scanner and transferred to Adobe Photoshop 5.5 on a G4 Power Macintosh.
In Vivo Pharmacokinetics of 111In-GFAP-PNA and 111In-GFAP-PNA/SA-OX26 in Control Rats
All animal protocols were approved by the UCLA Animal Research Committee. The plasma pharmacokinetics of 111In-GFAP-PNA with or without conjugation to SA-OX26 was determined in adult rats (7). Pharmacokinetic parameters were calculated by fitting the plasma radioactivity data to a biexponential equation with a weighting factor of 1/(A (t))2 using a derivative-free nonlinear regression analysis, as described (7). The AUCss = ([A1/k1] + [A2/k2]), where AUCss is the steady state area under the plasma concentration curve.
Gel-Filtration FPLC
The in vivo metabolic stability in plasma of the 111In-GFAP-PNA/SA-OX26 was examined by elution of serum through a single Superose 12 HR 10/30 column. The blood was removed at 60 min after intravenous injection of 3.7 MBq (100 μCi) 111In-GFAP-PNA/SA-OX26 to RG-2 tumor-bearing rats, and pooled serum was applied to the FPLC column, as described (7).
Rat Brain Tumor Model
Rat C6 or RG-2 glioma cell lines were grown in monolayer culture (37°C, 5% CO2 in air) in minimum essential medium (MEM; Gibco BRL) or F-12 Nutrient Mixture (F-12; Gibco BRL) supplemented with 10% fetal bovine serum (Gibco BRL), 24 mmol/L NaHCO3, 30 mmol/L N-(2-hydroxyethyl)piperazine-N′-(2-ethanesulfonic acid), pH 7.4, 1 mmol/L sodium pyruvate, and penicillin/streptomycin (Gibco BRL). Male CD Fischer 344 rats (Harlan Breeders) weighing 200–325 g were implanted with 350,000 RG-2 cells, as described (7).
In Vivo Brain Autoradiography in Tumor-Bearing Rats
Approximately 14–17 d after implanation of RG-2 rat glioma cells, rats were anesthetized for the injection of brain imaging agents. The RG-2 tumor-bearing rats were injected intravenously with 3.7 MBq (100 μCi) of either 111In-GFAP-PNA or 111In-GFAP-PNA/SA-OX26 via the femoral vein. Subsequently, RG-2 tumor-bearing rats were injected intravenously with 5.5 MBq (150 μCi) of either 111In-CAV-PNA or 111In-CAV-PNA/SA-OX26 via the femoral vein. The animals were decapitated at 1–6 h after injection, and the brain was rapidly removed from the cranium, cut into 3-mm coronal slabs containing the tumor site, frozen in powdered dry ice, and dipped in Tissue-Tek optimal-cutting-temperature (OCT) embedding compound (Sakura Finetek, Inc.); blocks were stored at −70°C. Frozen sections of 20-μm thickness were prepared on a Mikrome HM 505E cryostat (Mikron Instruments, Inc.), mounted on glass slides, and dried at room temperature.
For film autoradiography, the brain sections were exposed with an intensifying screen to Biomax MS film (Kodak) at −70°C for 4–12 d. The films were then developed for 1–2 min using Kodak developer and fixed for 5 min using Kodak fixer. The film was scanned in a 1,200-dpi PowerLookIII scanner (Umax Data Systems) with a transparency adapter and cropped in Photoshop 5.5 (Adobe Systrems, Inc.) on a G4 Power Macintosh (Apple Computer, Inc.). Parallel sections were stained with Vector hematoxylin QS (Vector Laboratories Inc.) to visualize the tumor, and these specimens were subsequently scanned along with the film autoradiograms.
Confocal Microscopy
Frozen brain sections were immunostained with a mouse mAb (5 μg/mL) to GFAP and a rabbit polyclonal antibody (0.5 μg/mL) to CAV, as described (13). Control primary antibodies, mouse IgG1 or rabbit IgG, gave no immune reaction. The secondary antibody (5 μg/mL) was Alexa Fluor 488 goat antimouse IgG (fluorescein channel) for GFAP and Alexa Fluor 594 goat antirabbit IgG (rhodamine channel) for CAV applied in phosphate-buffered saline with 1% goat serum for 60 min in the dark. All confocal microscopy parameters have been described previously (13).
Isolation of Brain Tumor Poly(A)+ RNA and GFAP or CAV Northern Blotting
Poly(A)+ RNA was isolated from rat brain tumors as described (10). Two micrograms of poly(A)+ RNA aliquots were resolved in 1.5% agarose/2.2 mol/L formaldehyde gels and then blotted onto GeneScreen Plus membranes (PerkinElmer Life Science Products) (10). Northern blots were probed with 32P-labeled rat GFAP or rat CAV cDNA as described (10). The rat CAV partial cDNA, designated LKH-20, was obtained in prior gene microarray analyses of brain capillary gene expression (9). Autoradiograms were performed with Biomax MS film (Kodak) at −70°C. X-ray films were scanned with a Umax PowerLook III scanner and transferred to Adobe Photoshop 5.5 on a G4 Power Macintosh.
RESULTS
Design of PNA Sequence Targets
The GFAP-PNA contains an 18-mer purine/pyrimidine base sequence that is antisense to nucleotides 20–37 of the rat GFAP mRNA (accession number NM_017009), and this sequence borders the methionine AUG initiation codon (Fig. 1A). The CAV-PNA (Fig. 1B) contains an 18-mer sequence that is antisense to nucleotides 10–27 of the rat CAV mRNA. The CAV target sequence is 9 nucleotides upstream of the methionine initiation codon, which corresponds to nucleotide 1 of the CAV mRNA (accession number AF439778). The target CAV sequence was selected so as to avoid a poly(G) tract immediately 3′ to the methionine start site of the CAV mRNA.
Northern Blotting of Cloned Rat GFAP mRNA with 111In-GFAP-PNA/SA-OX26
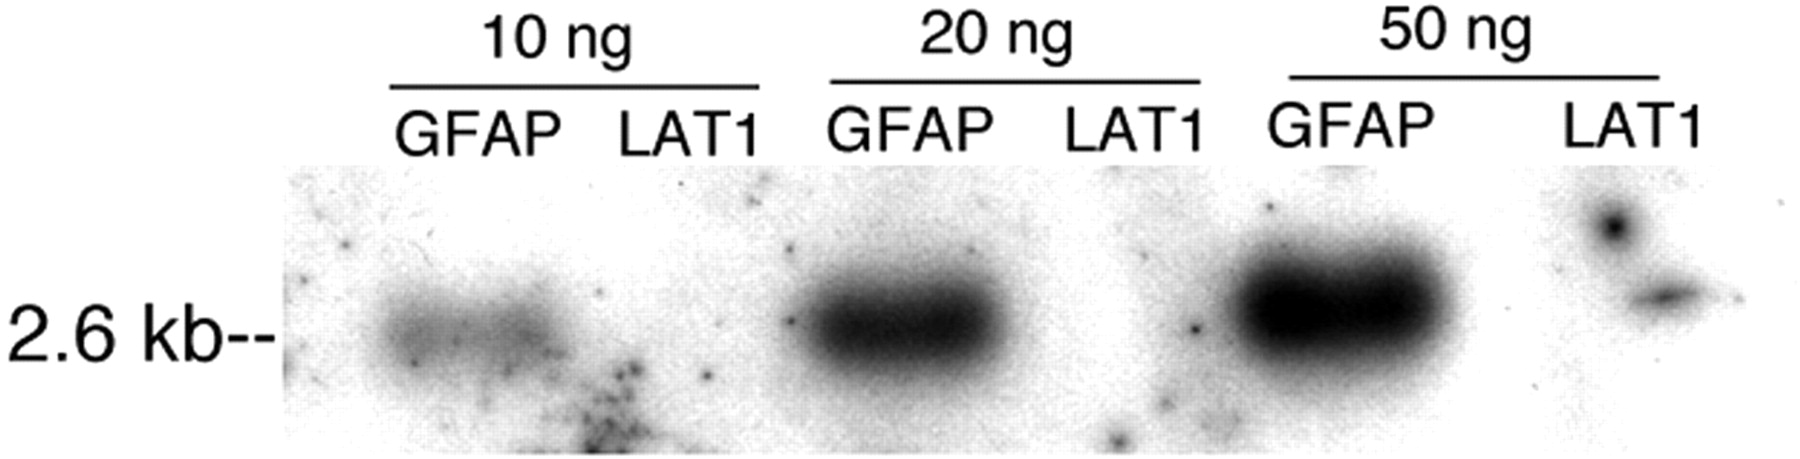
Initially, it was necessary to demonstrate that the 111In-GFAP-PNA still hybridized to the target GFAP mRNA after conjugation of the 111In-GFAP-PNA to SA-OX26. Therefore, after the cloning of a full-length rat GFAP cDNA, and incorporation of this cDNA into a transcription plasmid, full-length GFAP cRNA was obtained by in vitro transcription. In parallel, a nontarget mRNA encoding the rat LAT1 mRNA was transcribed in parallel, and the rat GFAP and the rat LAT1 cRNAs were applied to 1.5% agarose/formaldehyde gels. After blotting, the filters were probed with the 111In-GFAP-PNA/SA-OX26 and the film autoradiogram of this Northern blot is shown in Figure 2. The 111In-GFAP-PNA/SA-OX26 had no measurable hybridization to the LAT1 cRNA but hybridized in a dose-dependent fashion to the target GFAP cRNA (Fig. 2).

Northern blot produced with cRNA derived by IVT of transcription plasmids encoding either rat GFAP cDNA or rat LAT1 cDNA. Each lane was spotted with 10, 20, or 50 ng of GFAP cRNA or LAT1 cRNA. After electrophoresis with parallel RNA molecular size standards, and blotting, the hybridization was performed with 111In-GFAP-PNA/SA-OX26. The film was developed overnight at −20°C. 111In-GFAP-PNA/SA-OX26 selectively hybridized to 2.6-kb GFAP mRNA but did not hybridize to LAT1 mRNA.
Plasma Pharmacokinetics and Organ Uptake of 111In-GFAP-PNA and 111In-GFAP-PNA/SA-OX26
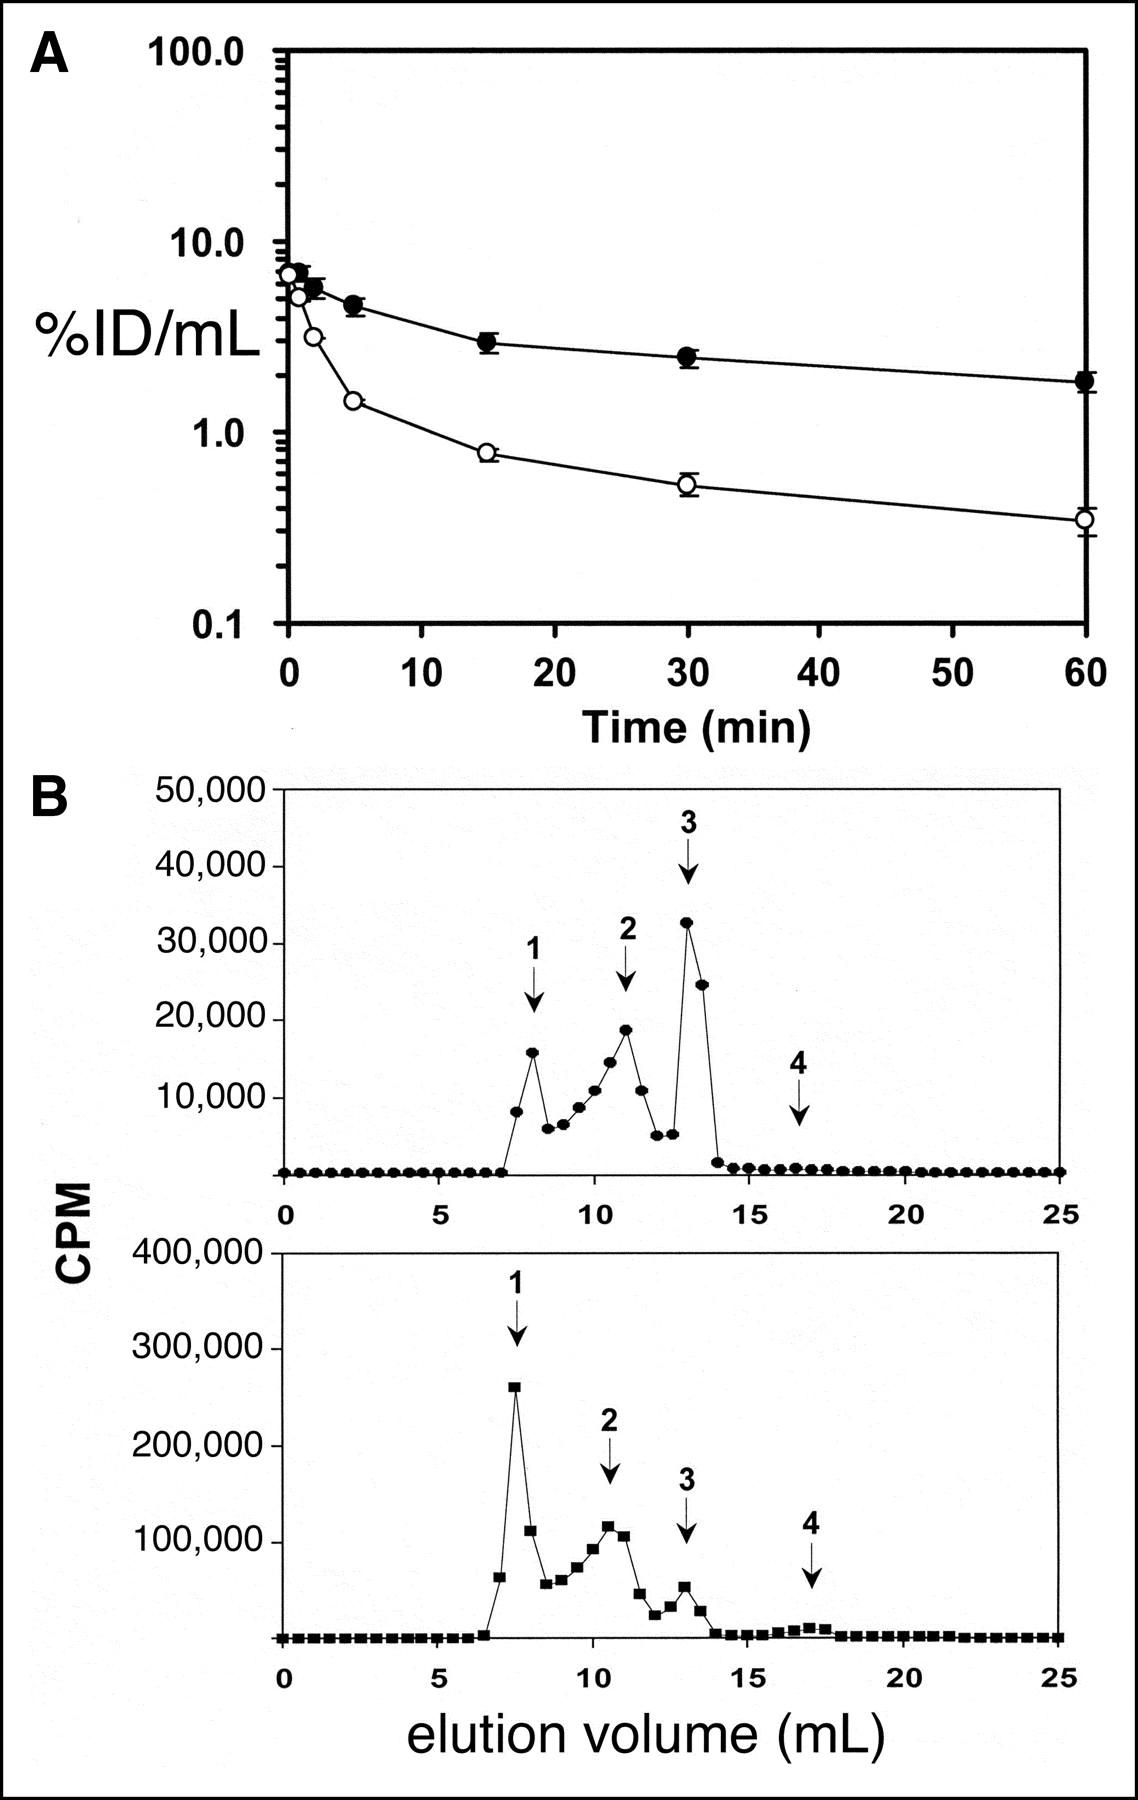
The plasma pharmacokinetics and organ uptake of the 111In-GFAP-PNA, with or without conjugation to SA-OX26, was measured in control Sprague–Dawley adult rats. The plasma profile of radioactivity, expressed as the percentage injected dose per milliliter (%ID/mL), is shown in Figure 3A, and a pharmacokinetic analysis of these blood clearance data yielded the parameters shown in Table 1. The 60-min organ uptake, expressed as %ID/g tissue, was measured for liver, heart, kidney, lung, and brain for the 111In-GFAP-PNA, with or without conjugation to SA-OX26 (Table 2).

(A) Plasma radioactivity, expressed as percentage of injected dose (%ID)/mL plasma at 0.25–60 min after intravenous injection of either unconjugated 111In-GFAP-PNA (○) or 111In-GFAP-PNA/SA-OX26 (•) in adult rats. Data are mean ± SE (n = 3 rats per time point). These data were used to generate the pharmacokinetic parameters shown in Table 1. (B) Gel-filtration FPLC using a Superose 12HR10/30 column with elution in PBST. (Top) Elution of serum removed 60 min after intravenous injection of 111In-GFAP-PNA/SA-OX26. (Bottom) Elution of uninjected 111In-GFAP-PNA/SA-OX26 premixed in control uninjected rat serum. Peak 1, 111In-GFAP-PNA/SA-OX26 bound to lipoprotein fraction of serum; peak 2, 111In-GFAP-PNA/SA-OX26; peak 3, 111In-GFAP-PNA bound to unconjugated SA; peak 4, free 111In-GFAP-PNA.
Pharmacokinetic Parameters
Organ Uptake of 111In-GFAP-PNA and 111In-GFAP-PNA/SA-OX26
Gel-Filtration FPLC of Rat Serum
The 60-min serum radioactivity from a pool of rats administered the 111In-GFAP-PNA/SA-OX26 was applied to a gel-filtration FPLC column, and the elution pattern is shown in Figure 3B (top panel). Peak 1 is the conjugate bound to the lipoprotein fraction in serum; peak 2 is the 111In-GFAP-PNA/SA-OX26; peak 3 is the 111In-GFAP-PNA/SA that was incompletely separated from the SA-OX26 in the conjugate purification; peak 4 corresponds to the elution of low-molecular-weight metabolites of the conjugate, including the 111In-GFAP-PNA separated from the SA or SA-OX26 conjugate. These FPLC data show that there is no formation of low-molecular-weight metabolites in the serum after the injection of the 111In radiopharmaceuticals. The uninjected 111In-GFAP-PNA/SA-OX26 was mixed with pooled uninjected rat serum and injected onto the FPLC column, and this elution profile is shown in Figure 3B (bottom panel). These data show that there is a spontaneous binding of the conjugate to the lipoprotein fraction on mixing with rat serum. When the 111In-GFAP-PNA/SA-OX26 was injected onto the FPLC column without mixing with serum, no radioactivity in peak 1 was observed.
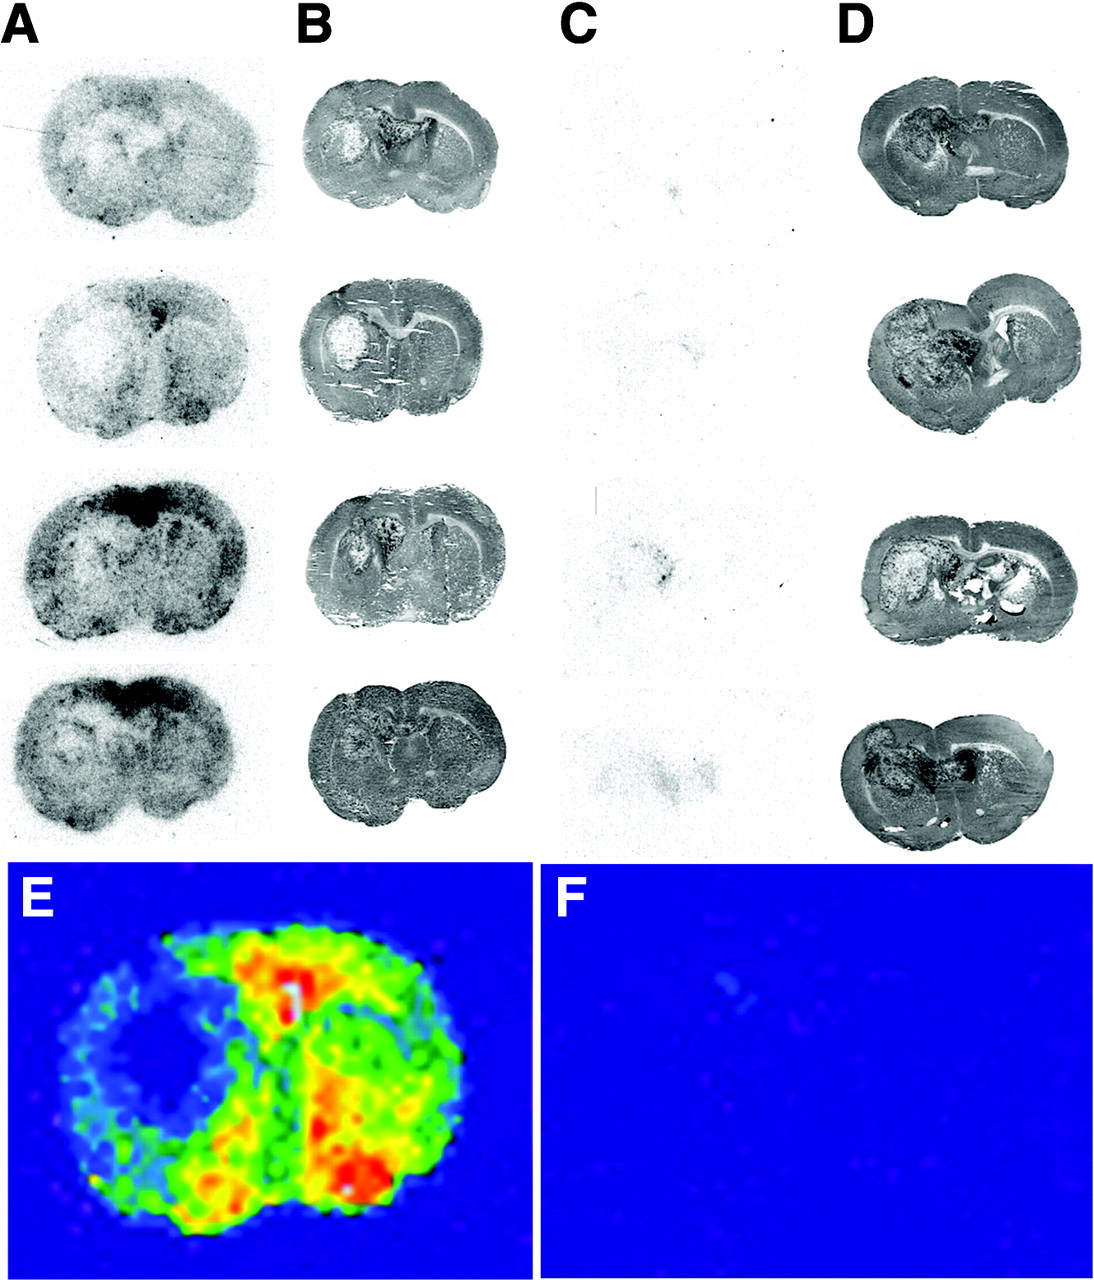
Imaging RG2 Gliomas With 111In-GFAP-PNA With or Without Conjugation to the TfRMAb
RG2 brain tumor-bearing rats were injected intravenously with 111In-GFAP-PNA or 111In-GFAP-PNA/SA-OX26, and brain scans were obtained 1 h later (Fig. 4). There is minimal brain radioactivity detected in the tumor and none in contralateral brain after the intravenous injection of unconjugated 111In-GFAP-PNA (Fig. 4C), owing to lack of transport of the 111In-GFAP-PNA across the BBB. When the 111In-GFAP-PNA is conjugated to SA-OX26 to form 111In-GFAP-PNA/SA-OX26, radioactivity in brain is measurable owing to transport of the PNA radiopharmaceutical across the BBB (Fig. 4A). The scans from the second row in A and C are colorized and are shown in Figures 4E and 4F, respectively. The brain scans obtained with the 111In-GFAP-PNA/SA-OX26 show the tumor is “cold” relative to normal brain, which suggested that the GFAP mRNA was not significantly expressed in the RG2 brain tumor. Therefore, confocal microscopy and Northern blotting studies were performed to assay the expression of the immunoreactive GFAP protein or mRNA in C6 or RG2 tumors.

111In-GFAP-PNA/SA-OX26 conjugate or unconjugated 111In-GFAP-PNA (3.7 MBq [100 μCi] per rat) was injected into RG2 brain tumor–bearing rats at 15 d after implantation of 350,000 RG2 cells per brain, and rats were sacrificed at 60 min. The Biomax film was developed for 12 d at −20°C. The film autoradiograms for 4 rats injected with 111In-GFAP-PNA/SA-OX26 conjugate are shown in A and the corresponding hematoxylin autopsy stains indicating the size of tumor are shown in B. The film autoradiograms for 4 rats injected with unconjugated 111In-GFAP-PNA are shown in C, and the corresponding hematoxylin autopsy stains are shown in D. The gray-scale autoradiograms from the second images in A and C were colorized, as shown in E and F, respectively.
Confocal Microscopy and Northern Blotting of C6 and RG2 Tumors Show Underexpression of GFAP Gene in Brain Tumors
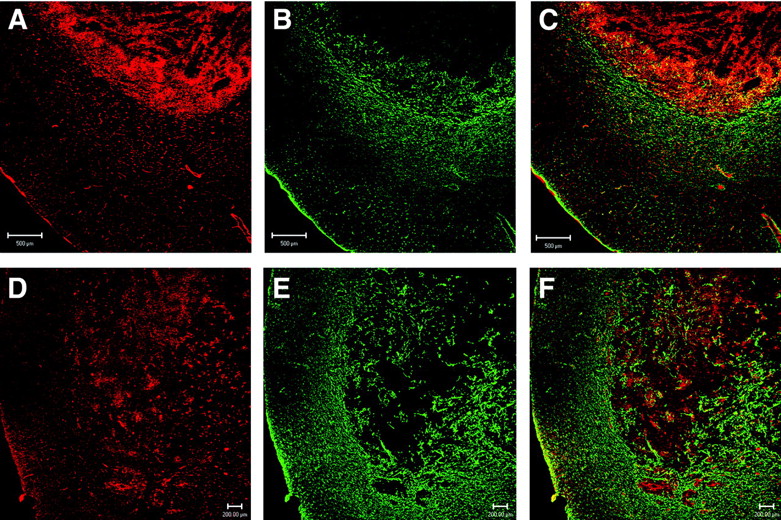
Confocal microscopy with a mAb to GFAP showed that both C6 rat brain tumors (Fig. 5B) and RG2 rat brain tumors (Fig. 5E) expressed very low levels of immunoreactive GFAP. Since it is possible that brain tumors may express the GFAP mRNA but not the immunoreactive protein, a series of Northern blotting studies was also performed (Fig. 6). Northern blotting shows that RG2 cells or C6 cells in tissue culture do not express the GFAP mRNA (Fig. 6B, lanes 1 and 6, respectively, of GFAP panel). The failure to detect significant levels of GFAP mRNA in cultured RG2 or C6 glioma cells was not due to poor quality of the RNA preparation, as the actin Northern blot for these specimens gave strong 2.0-kb signals characteristic of cytoplasmic actin (Fig. 6B, lanes 1 and 6 of actin panel). GFAP mRNA levels were detected in samples isolated from dissected intracerebral RG2 or C6 tumors in vivo (Fig. 6B, lanes 3 and 5, respectively, of GFAP panel), but the GFAP mRNA signal in the tumor was not overexpressed relative to contralateral rat brain (Fig. 6B, lanes 2 and 4 of GFAP panel). The presence of GFAP mRNA in the intracerebral RG2 or C6 tumors in vivo is attributed to the astrogliosis reaction around the tumor, which is demonstrated by the confocal microscopy (Figs. 5B and 5E).

Confocal microscopy of sections of brain taken from rats implanted with either C6 glioma cells (A–C) or RG2 glioma cells (D–F). (A and D) Section immunostained with rabbit polyclonal antiserum to rat CAV. (B and E) Section immunostained with a mAb to GFAP. (C and F) Overlap image with parallel staining of both GFAP (green) and CAV (red). Bar in A–C is 500 μm; bar in D–F is 200 μm.
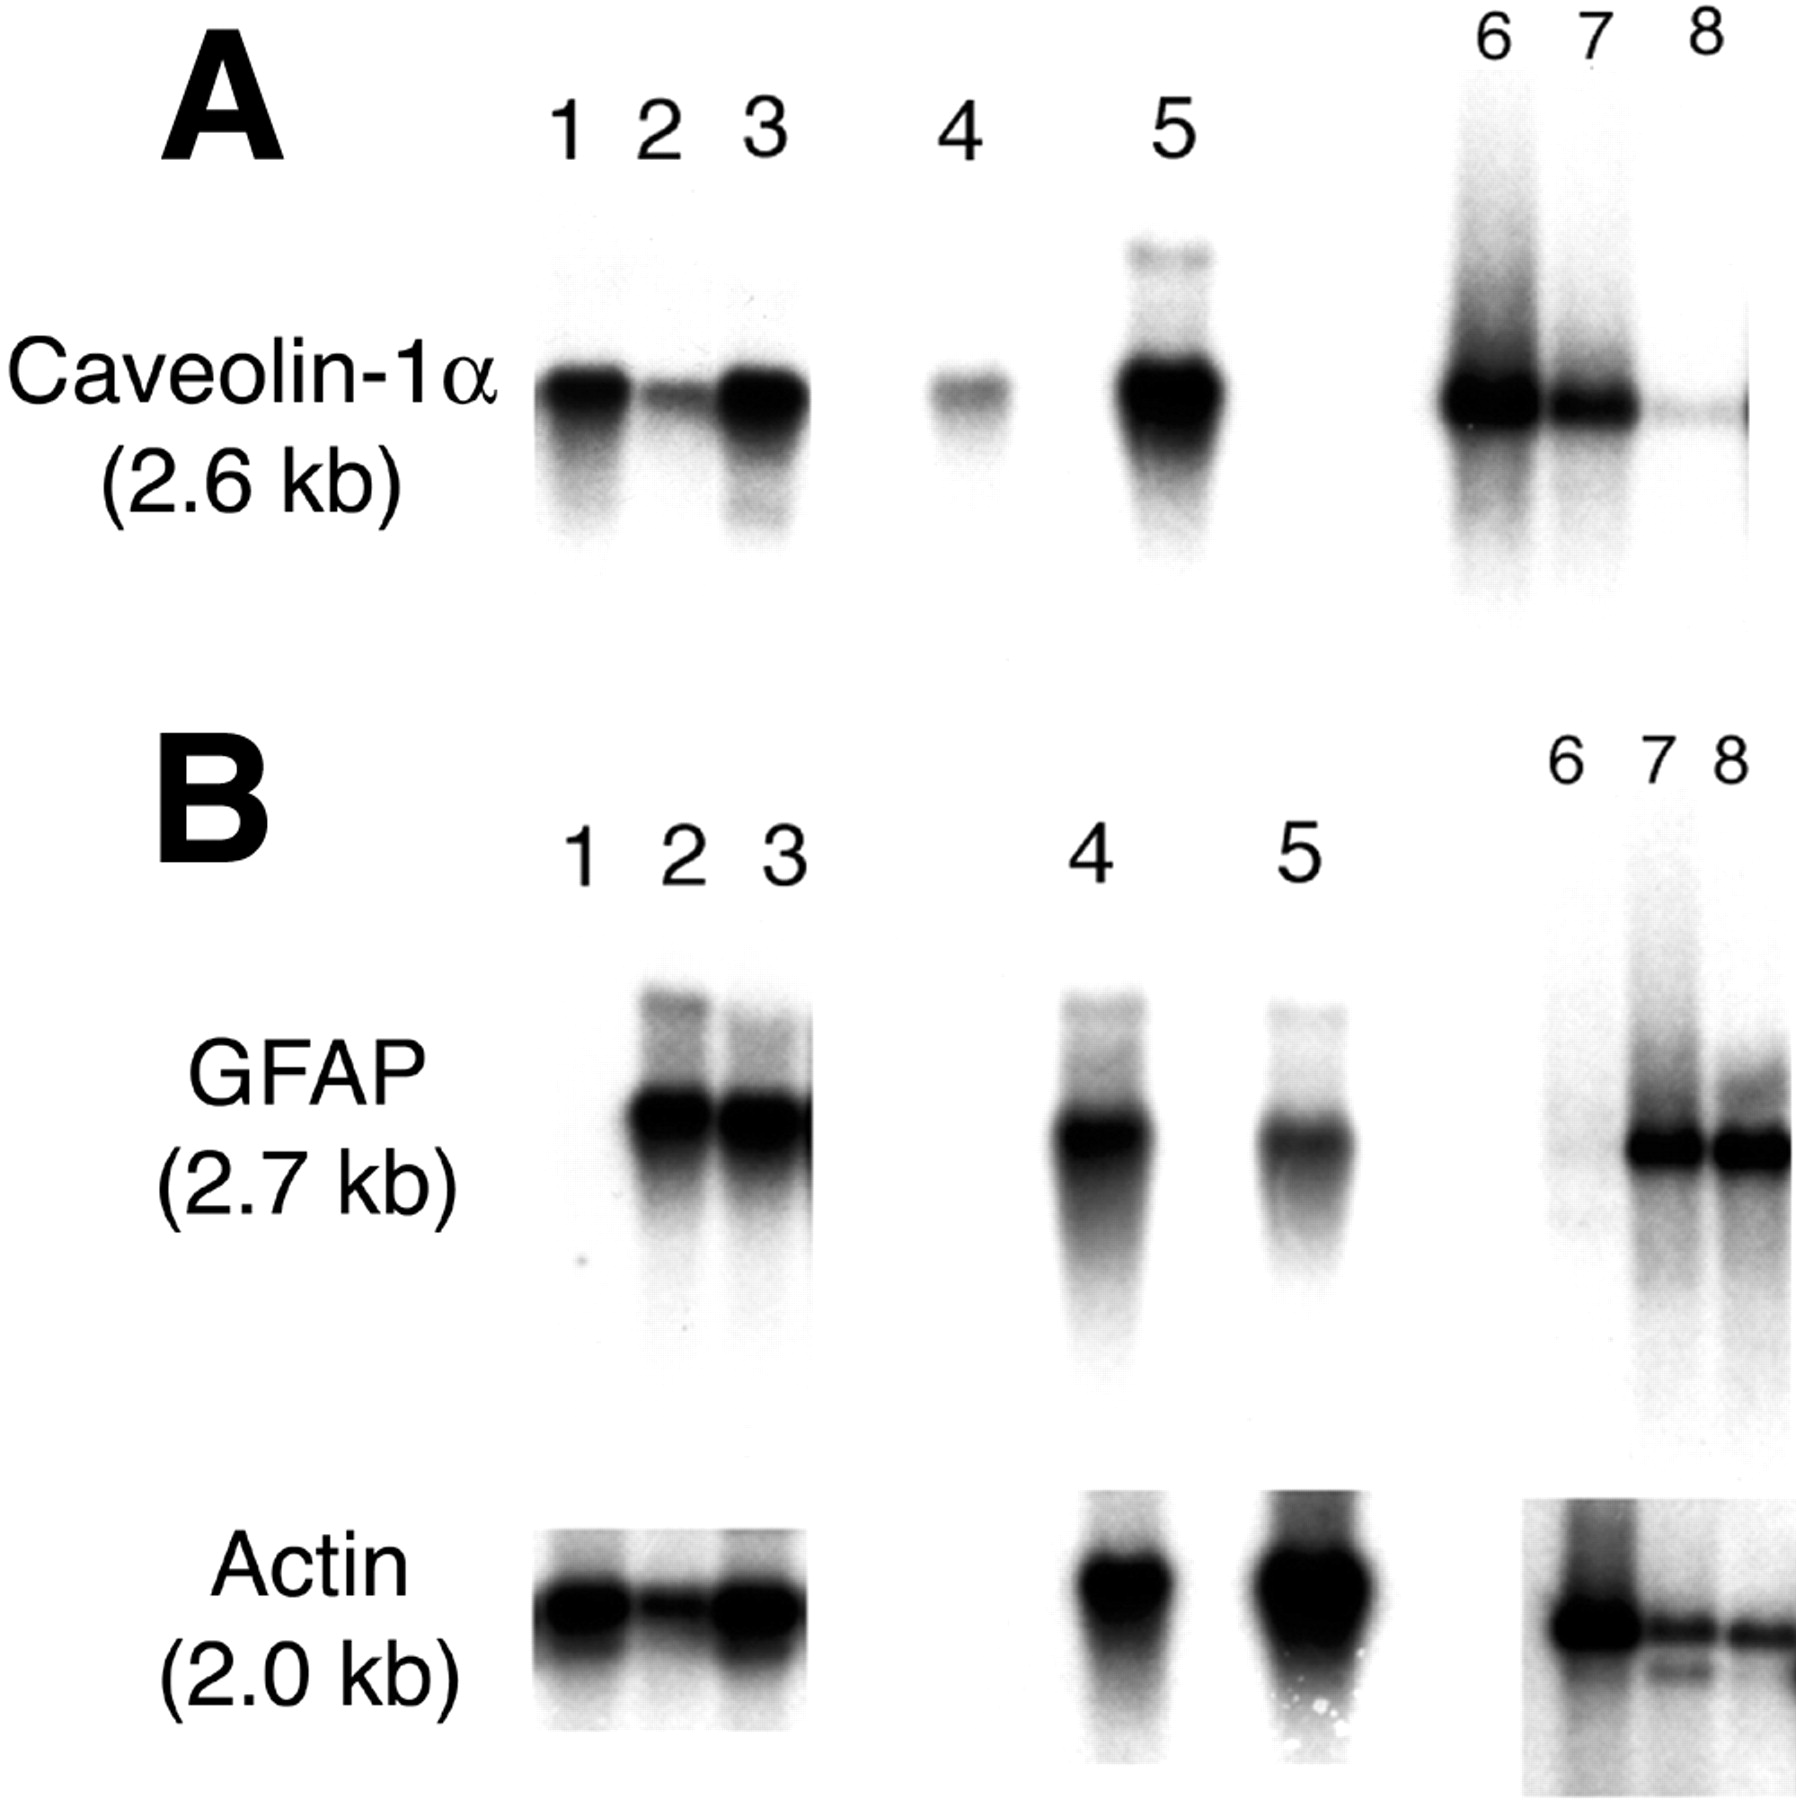
Northern blot of tissue mRNA probed with a cDNA to either rat CAV (A) or rat GFAP or actin (B). Lanes 1–3, 4 and 5, and 6–8 are 3 different blots: lanes 1–3, RG2 tumor cells in tissue culture, contralateral rat brain, and RG2 rat brain tumor in vivo, respectively; lanes 4 and 5, contralateral rat brain and C6 rat brain tumor in vivo, respectively; lanes 6–8, C6 glioma cells in tissue culture, freshly isolated rat brain capillaries, and control rat brain, respectively. Films of actin and CAV Northern blots were developed for 3 d. The GFAP Northern autoradiogram for lanes 1–5 was developed overnight and for lanes 6–8 was developed for 10 d; despite this overexposure of the film, the signal representing the GFAP transcript expressed in C6 glioma cells in tissue culture is not detectable (B, lane 6).
Confocal Microscopy and Northern Blotting of C6 and RG2 Tumors Show Overexpression of CAV Gene in Brain Tumors
In contrast to immunoreactive GFAP, immunoreactive CAV is overexpressed in intracerebral C6 or RG2 rat brain gliomas in vivo (Figs. 5A and 5D, respectively). The colabeling of the tumor section with GFAP (in green) and CAV (in red) is shown in Figures 5C and 5F for C6 and RG2 tumors, respectively. Northern blotting studies showed that, unlike the GFAP mRNA, the CAV mRNA was overexpressed in cultured RG2 cells or C6 cells (Fig. 6A, lanes 1 and 6). The CAV mRNA was overexpressed in RG2 tumors (Fig. 6A, lane 3) relative to contralateral rat brain (Fig. 6A, lane 2) and was overexpressed in intracerebral C6 gliomas (Fig. 6A, lane 5) relative to contralateral rat brain (Fig. 6A, lane 4). These results indicated that, unlike GFAP, CAV was a suitable candidate for imaging overexpression of a target gene in brain cancer.
Imaging RG2 Gliomas With 111In-CAV-PNA With and Without Conjugation to TfRMAb
Intracerebral RG2 tumors were grown in adult male Fisher CD344 rats and intracerebral tumors were developed, as shown by the hemotoxylin autopsy stains (Figs. 7B, 7D, 7F, and 7H). These tumor-bearing rats were injected intravenously with 111In-GFAP-PNA, 111In-GFAP-PNA/SA-OX26, 111In-CAV-PNA, or 111In-CAV-PNA/SA-OX26, and brain scans were obtained 6 h later. There was minimal imaging of the RG2 tumor with either the unconjugated 111In-GFAP-PNA (Fig. 7A) or the unconjugated 111In-CAV-PNA (Fig. 7E). There was no specific sequestration of radioactivity over the RG2 tumor after intravenous administration of the targeted 111In-GFAP-PNA/SA-OX26 (Fig. 7C). However, there was selective sequestration of radioactivity over the brain tumor after the intravenous injection of the targeted 111In-CAV-PNA/SA-OX26, as the tumor region showed higher uptake of the tracer compared with normal brain (Fig. 7G). The quantitative results from all 16 rats in the study are given in Figure 7I. These results show the following: (a) the uptake of the nonconjugated GFAP-PNA or the CAV-PNA by nontumor brain is not measurable; (b) there is modest uptake of the unconjugated GFAP-PNA or the CAV-PNA by brain tumor, owing to partial breakdown of the BBB in the tumor, but there is no difference in signal obtained with either of these unconjugated PNAs; (c) the uptake of the GFAP-PNA conjugate in either tumor or nontumor brain is enhanced relative to the unconjugated GFAP-PNA, but there is no sequestration of the GFAP-PNA by the brain tumor relative to nontumor brain; and (d) the uptake of the conjugated CAV-PNA by the tumor is increased 124% compared with the uptake of the CAV-PNA conjugate by nontumor brain.

(A, C, E, and G) Colorized film autoradiograms of sections removed from Fisher CD344 rat brain implanted with RG2 tumors; rats were sacrificed at 6 h after intravenous injection of 111In unconjugated or conjugated PNA. (A) RG2 tumor-bearing rat injected with unconjugated 111In-GFAP-PNA. (C) RG2 tumor-bearing rat injected with 111In-GFAP-PNA/SA-OX26. (E) RG2 tumor-bearing rat injected with unconjugated 111In-CAV-PNA. (G) RG2 tumor-bearing rat injected with 111In-CAV-PNA/SA-OX26. (B, D, F, and H) Hematoxylin autopsy stains show size of tumor corresponding to A, C, E, and G, respectively. (I) Integrated density of autoradiogram signal over the brain tumor (tumor) or contralateral brain (brain) for each of 4 different antisense radiopharmaceutical formulations: 1 and 2, 111In-CAV-PNA/SA-OX26 conjugate (CAV-PNA CONJ.); 3 and 4, 111In-GFAP-PNA/SA-OX26 conjugate (GFAP-PNA CONJ.); 5 and 6, unconjugated 111In-CAV-PNA (CAV-PNA); 7 and 8, unconjugated 111In-GFAP-PNA (GFAP-PNA). Data are mean ± SE (n = 4 rats in each of 4 groups).
DISCUSSION
The results of these studies are consistent with the following conclusions. First, a trifunctional antisense radiopharmaceutical is designed that (a) hybridizes to a specific target mRNA sequence, (b) has a DTPA residue for labeling with 111In, and (c) has a biotin moiety for conjugation to a drug-targeting system using avidin-biotin technology (Fig. 1). Second, the 111In-PNA still hybridizes to the target mRNA despite conjugation to the SA-OX26 drug-targeting system (Fig. 2). Third, the plasma pharmacokinetics and organ uptake obtained with the 111In-PNA and 111In-PNA/SA-OX26 (Fig. 3A; Table 2) demonstrate that conjugation of the PNA to the TfRMAb redirects clearance of the PNA from the kidney to TfR-rich organs such as liver and brain. Fourth, gel filtration of plasma radioactivity shows there is no formation of low-molecular-weight metabolites in blood after the intravenous injection of targeted PNA antisense radiopharmaceuticals radiolabeled with the 111In radionuclide (Fig. 3B). Fifth, imaging of intracerebral tumors with 111In-anti-GFAP-PNA antisense radiopharmaceuticals, which are targeted with the TfRMAb, results in a “cold” tumor signal (Fig. 4), owing to reduced tumor expression of the GFAP gene as demonstrated by both confocal microscopy (Fig. 5) and Northern blotting (Fig. 6B). Sixth, confocal microscopy and Northern blotting demonstrate that both C6 gliomas and RG2 gliomas overexpress the immunoreactive CAV protein and CAV mRNA (Figs. 5 and 6). Seventh, imaging of intracerebral gliomas with targeted 111In-CAV-PNA/SA-OX26 antisense radiopharmaceuticals results in “hot” tumor scans relative to normal brain (Fig. 7G), whereas there is no specific uptake over the tumor of the targeted 111In-GFAP-PNA/SA-OX26 (Fig. 7C). These results demonstrate that it is possible to image endogenous gene expression in brain cancer with sequence-specific antisense PNA radiopharmaceuticals that are designed both for radiolabeling with the 111In radionuclide and for conjugation to a brain drug-targeting system.
PNAs are suitable antisense agents for imaging gene expression because the hybridization of the PNA to the target mRNA does not activate RNase H (14). In contrast, antisense radiopharmaceuticals comprised of oligodeoxynucleotides trigger degradation of the target mRNA via RNase H, which is not desired in a diagnostic application. PNAs can be synthesized with an amino-terminal DTPA moiety (Fig. 1), which allows for chelation of the 111In radionuclide. In addition, a biotin group can be incorporated at the ε-amino group of a carboxyl-terminal lysine residue of the PNA (Fig. 1). This biotin group allows for the rapid conjugation of the antisense PNA to a membrane-targeting ligand using a biotin-SA linker. In the present studies, the murine OX26 mAb to the rat TfR is used as the targeting ligand, and SA is conjugated to this mAb via a stable thiol-ether linker (Fig. 1). This approach allows for a “2-vial” formulation of targeted antisense radiopharmaceuticals (3). The monobiotinylated 111In-PNA is prepared in 1 vial, and the SA-OX26 conjugate is prepared in a second vial. The 2 vials are mixed just before intravenous injection. Owing to the high affinity of SA binding of biotin (15), there is immediate formation of the PNA-mAb conjugate shown in Figure 1.
To image endogenous gene expression with PNA antisense radiopharmaceuticals, it is necessary to conjugate the PNA to a membrane-targeting ligand, since PNAs do not cross biologic membranes (1–3). In prior studies of cellular uptake of PNAs, it was necessary to physically inject the PNA into a cell (1) or to induce uptake of the PNA into the cell by electroporation (2). Although it is claimed that unconjugated PNAs cross the BBB (16), a quantitative analysis of this study shows that the brain uptake of the PNA is <0.001 %ID/g, which is a background level of brain uptake comparable to the brain uptake of sucrose, an extracellular space marker (17). This negligible uptake of unconjugated PNAs reported in prior work (1–3) is consistent with the results of the present study, which show that it is not possible to image brain structures with unconjugated 111In-PNA antisense radiopharmaceuticals. Although PNAs have been fused to cell membrane–permeating or “import” peptides for tissue culture applications (18–20), it is possible that such PNA-import peptide hybrids will not be very effective for in vivo imaging owing to rapid removal of the PNA from the bloodstream caused by rapid cellular uptake of the membrane-permeant import peptide. The adverse plasma pharmacokinetics introduced by the use of membrane-permeant peptides such as the TAT analog has been previously demonstrated, where the plasma clearance of SA was increased nearly 25-fold after conjugation to the cationic TAT peptide (21).
Conjugation of the PNA antisense imaging agent to the TfRMAb-targeting ligand results in a redirection of the organ clearance of the PNA from kidney to organs that are enriched in TfR, such as liver and brain (Table 2). The renal clearance data for the unconjugated PNA represents an underestimate since the urine compartment was not included in the measurement of the total clearance by the kidney. The brain uptake of the unconjugated 111In-GFAP-PNA is <0.001 %ID/g (Table 2), whereas the brain uptake of the 111In-GFAP-PNA/SA-OX26 is nearly 0.1 %ID/g (Table 2). This brain uptake of the PNA-mAb conjugate is comparable to the brain uptake of morphine, a neuroactive small molecule (22). The terminal serum, taken at 60 min after intravenous injection of the PNA-mAb conjugate, was pooled and applied to a gel-filtration FPLC column and the elution profile is shown in Figure 3B. These results show that there is no formation of low-molecular-weight radiolabeled metabolites after the injection of the PNA-mAb conjugate labeled with 111In. The conjugate is partially bound to the high-molecular-weight lipoprotein fraction (Fig. 3B, peak 1), and this may be related to the indium radionuclide. Prior work with an epidermal growth factor peptide radiopharmaceutical that was labeled with 111In demonstrated a similar partial distribution into the lipoprotein fraction of blood (7). Peak 3 of the FPLC elution profile comigrates with 111In-GFAP-PNA bound to SA without attachment to the targeting mAb, and this peak is increased at 60 min after injection (Fig. 3B). The formation of the PNA attached to SA may represent degradation of the thiol-ether bond connecting the SA with the TfRMAb. Since SA is not transported across the BBB in vivo (21), this pool of plasma PNA is not available for transport into brain. Alternatively, the relative enrichment of peak 3 at 60 min of circulation (Fig. 3B, top panel), compared with the uninjected conjugate (Fig. 3B, bottom panel), may represent the more rapid removal of the 111In-GFAP-PNA bound to the OX26/SA conjugate compared with the removal of the 111In-GFAP-PNA bound to the unconjugated SA, already present in the formulation. Prior work has shown that unconjgated SA is slowly removed from the blood compartment (21).
The unconjugated 111In-GFAP-PNA or the 111In-GFAP-PNA/SA-OX26 conjugate was injected into adult rats with intracerebral RG2 brain tumors, and brain was imaged at 60 min after intravenous injection of the imaging agent (Fig. 4). There is no brain uptake of the 111In-GFAP-PNA, owing to lack of transport across the BBB (Fig. 4F). After injection of the 111In-GFAP-PNA/SA-OX26 in the RG2 tumor-bearing rats, an unexpected finding was that the scan over the brain tumor was “cold” relative to normal brain (Fig. 4E). The cold tumor signal could be consistent with decreased uptake of the PNA-mAb conjugate—for example, owing to decreased TfR on either the BBB of the tumor or the TCM. However, this explanation is unlikely because RG2 cells express the TfR (23), and the blood vessels perfusing intracerebral brain gliomas also express the TfR (24). An alternate explanation for the cold tumor signal with the 111In-GFAP-PNA/SA-OX26 conjugate is the underexpression of the GFAP mRNA in the RG2 brain tumor, as this would lead to a rapid efflux of the imaging agent from the tumor. The TfRMAb conjugates are rapidly effluxed across the BBB in the brain-to-blood direction owing to reverse transcytosis of the mAb, which is mediated by both the BBB TfR (25) and the BBB Fc receptor (26). The hypothesis that intracerebral brain gliomas actually underexpress the GFAP mRNA was examined with both confocal microscopy of the immunoreactive GFAP (Fig. 5) and Northern blotting of the GFAP mRNA in both cultured C6 and RG2 glioma cells or intracerebral C6 or RG2 gliomas in vivo (Fig. 6). The confocal microscopy shows minimal immunoreactive GFAP within either a C6 brain tumor (Fig. 5B) or an RG2 brain tumor (Fig. 5E), although immunoreactive GFAP is found in the astrogliotic reaction surrounding and penetrating the tumor. GFAP mRNA is not detectable in either RG2 cells (Fig. 6B, lane 1) or C6 cells (Fig. 6B, lane 6) in tissue culture. The Northern blot of the GFAP mRNA signal in cultured C6 cells was developed for 10 d to give an overexposure of the film, but still no detectable GFAP transcript was found in cultured C6 cells (Fig. 6B, lane 6). The finding of minimal GFAP gene expression in brain gliomas is consistent with other studies showing that subcutaneous C6 glial tumors do not express GFAP (27).
Given the downregulation of GFAP gene expression in brain glial tumors, it was necessary to find an alternative gene for brain cancer imaging, and a targeted PNA directed against the CAV mRNA was then designed (Fig. 1B). The CAV mRNA is upregulated in brain glial tumors (8). The CAV mRNA was originally detected only in endothelial cells in brain (28). However, recent work has shown that the CAV gene is also expressed in brain astrocytes (13). The CAV gene may be a tumor repressor gene (29) and is generally downregulated in solid cancer (8). Nevertheless, in brain glial tumors, where GFAP gene expression is suppressed, CAV gene expression is increased. This is demonstrated by the confocal microscopy study showing increased immunoreactive CAV in either C6 or RG2 intracerebral gliomas (Figs. 5A and 5D, respectively). The relative expression of GFAP and CAV in C6 or RG2 brain tumors is shown in the overlap images of Figures 5C and 5F, respectively. In parallel with increased glial tumor CAV protein expression, the CAV mRNA is also increased (Fig. 6A). The CAV mRNA is overexpressed in cultured RG2 or C6 glial cells (Fig. 6A, lanes 1 and 5) and is overexpressed relative to contralateral brain in either intracerebral RG2 tumors (Fig. 6A, lane 3) or intracerebral C6 gliomas (lane 5, Fig. 6A). There are 2 caveolin-1 isoforms, designated caveolin-1α (CAV) and caveolin-1β. The partial cDNA to the rat caveolin-1 gene used for the Northern studies in Figure 6 was isolated previously (9) and encompasses a sequence that would be expected to hybridize to both the CAV and the caveolin-1β mRNAs. However, the nucleobase sequence comprising the CAV-PNA designed for these studies (Fig. 1B) is expected to hybridize only to the CAV mRNA. The caveolin-1 gene has 2 alternative transcription start sites for production of the CAV mRNAs or caveolin-1β mRNAs (30), and the target sequence shown in Figure 1A for CAV is absent in the caveolin-1β mRNA.
The sequence-specific imaging of endogenous gene expression is demonstrated in Figure 7, which shows overexpression of the CAV mRNA in intracerebral RG2 tumors providing the 111In-CAV-PNA is conjugated to the TfRMAb (Fig. 7G). There is no specific imaging of CAV mRNA in the brain cancer when the unconjugated 111In-CAV-PNA is injected (Fig. 7E). The failure to obtain any brain image with the unconjugated 111In-CAV-PNA (Fig. 7A) is expected given the lack of transport of unconjugated PNAs across the BBB. However, the 111In-GFAP-PNA/SA-OX26 is able to cross the BBB and access the intracellular spaces of RG2 tumor cells in vivo, but, nevertheless, there is no positive tumor image with this PNA (Fig. 7C). The absence of any tumor signal with the 111In-GFAP-PNA/SA-OX26 is secondary to the lack of selective sequestration of the GFAP PNA by the tumor cell owing to underexpression of the GFAP gene in brain glial tumors in vivo. Unlike the scans shown in Figure 4, which were performed at 1 h after intravenous administration of the GFAP-PNA-TfRMAb conjugate, the scans shown in Figure 7 were obtained at 6 h after intravenous injection of the imaging agents. Therefore, after initial uptake of the PNA-mAb conjugate, there is rapid efflux from brain during this time period in the absence of any specific sequestration of the imaging agent by brain tumor mRNAs. This efflux of an antibody-based radiopharmaceutical from brain back to blood is mediated by either the BBB TfR (25) or the BBB Fc receptor (26).
CONCLUSION
The present studies show that it is possible to image endogenous gene expression in brain cancer with sequence-specific PNA antisense radiopharmaceuticals that are conjugated with the 111In radionuclide providing that the PNA antisense radiopharmaceutical is conjugated to a drug-targeting system. Clinical applications of this targeted antisense imaging technology are possible with mAb-avidin fusion proteins, which are produced from genetically engineered fusion genes. The genetic engineering, pharmacokinetics, and in vivo brain delivery of mAb-avidin fusion proteins have been demonstrated previously (31). The antisense imaging of gene expression in vivo in patients with brain cancer, or other brain disorders, could aid in both the diagnosis and the treatment of brain disorders.
Acknowledgments
This work was supported by grant ER-62655 from the U.S. Department of Energy, by National Institutes of Health grant R21-CA-91098, and by a grant of the Ernst Schering Research Foundation.
Footnotes
Received Dec. 30, 2003; revision accepted May 20, 2004.
For correspondence or reprints contact: William M. Pardridge, MD, UCLA, Warren Hall 13-164, 900 Veteran Ave., Los Angeles, CA 90024.
E-mail: wpardridge{at}mednet.ucla.edu
REFERENCES
In this issue


Jump to section
Related Articles
Cited By...
- Selective targeting of oncogenic KRAS G12D using peptide nucleic acid oligomers attached to cell-penetrating peptides
- Systemic antibody-oligonucleotide delivery to the central nervous system ameliorates mouse models of spinal muscular atrophy
- Preparation and Evaluation of 99mTc-Epidermal Growth Factor Receptor (EGFR)-Peptide Nucleic Acid for Visualization of EGFR Messenger RNA Expression in Malignant Tumors