


Visual Abstract

Abstract
Significant improvements in treatments for children with cancer have resulted in a growing population of childhood cancer survivors who may face long-term adverse outcomes. Here, we aimed to diagnose high-dose methotrexate–induced brain injury on [18F]FDG PET/MRI and correlate the results with cognitive impairment identified by neurocognitive testing in pediatric cancer survivors. Methods: In this prospective, single-center pilot study, 10 children and young adults with sarcoma (n = 5), lymphoma (n = 4), or leukemia (n = 1) underwent dedicated brain [18F]FDG PET/MRI and a 2-h expert neuropsychologic evaluation on the same day, including the Wechsler Abbreviated Scale of Intelligence, second edition, for intellectual functioning; Delis–Kaplan Executive Function System (DKEFS) for executive functioning; and Wide Range Assessment of Memory and Learning, second edition (WRAML), for verbal and visual memory. Using PMOD software, we measured the SUVmean, cortical thickness, mean cerebral blood flow (CBFmean), and mean apparent diffusion coefficient of 3 different cortical regions (prefrontal cortex, cingulate gyrus, and hippocampus) that are routinely involved during the above-specified neurocognitive testing. Standardized scores of different measures were converted to z scores. Pairs of multivariable regression models (one for z scores < 0 and one for z scores > 0) were fitted for each brain region, imaging measure, and test score. Heteroscedasticity regression models were used to account for heterogeneity in variances between brain regions and to adjust for clustering within patients. Results: The regression analysis showed a significant correlation between the SUVmean of the prefrontal cortex and cingulum and DKEFS–sequential tracking (DKEFS-TM4) z scores (P = 0.003 and P = 0.012, respectively). The SUVmean of the hippocampus did not correlate with DKEFS-TM4 z scores (P = 0.111). The SUVmean for any evaluated brain regions did not correlate significantly with WRAML–visual memory (WRAML-VIS) z scores. CBFmean showed a positive correlation with SUVmean (r = 0.56, P = 0.01). The CBFmean of the cingulum, hippocampus, and prefrontal cortex correlated significantly with DKEFS-TM4 (all P < 0.001). In addition, the hippocampal CBFmean correlated significantly with negative WRAML-VIS z scores (P = 0.003). Conclusion: High-dose methotrexate–induced brain injury can manifest as a reduction in glucose metabolism and blood flow in specific brain areas, which can be detected with [18F]FDG PET/MRI. The SUVmean and CBFmean of the prefrontal cortex and cingulum can serve as quantitative measures for detecting executive functioning problems. Hippocampal CBFmean could also be useful for monitoring memory problems.
The 5-y overall survival rate of children with cancer has increased in recent decades, and it is currently over 80% for all cancers, with variations depending on the type of cancer. Children with osteosarcoma, non-Hodgkin lymphoma, and acute lymphoblastic leukemia have an overall survival rate of 75%, 80%, and 90%, respectively (1–3). These substantial improvements in survival have led to a growing population of pediatric cancer survivors who are at risk for health problems that appear to increase with age. The Childhood Cancer Survivor Study, which included more than 14,000 childhood cancer survivors, reported a cumulative incidence of 53.6% for disabling, life-threatening, or fatal health conditions in survivors, compared with 19.8% in a sibling control group (4). Among others, long-term neurocognitive problems have been described in adult survivors of childhood cancer (5–9). Survivors who received antimetabolite chemotherapy, cranial irradiation, or neurosurgery for their tumors are at higher risk of developing neurocognitive late effects (5,10–12), which may significantly impair intelligence, learning, attention, memory, and executive function and have long-term effects on educational and vocational attainment (13,14).
Methotrexate is an antimetabolite agent used routinely to treat various childhood cancers, including acute lymphoblastic leukemia, non-Hodgkin lymphoma, and osteosarcoma (15–17). Recent studies have shown that methotrexate treatment leads to inflammation of the brain by activation of microglia, which in turn impairs the differentiation of oligodendrocyte precursor cells and the myelination of neurons (18,19). In mouse models of methotrexate-induced brain injury, microglial depletion with colony-stimulating factor 1 receptor inhibitors rescued neurocognitive deficits (19). Executive dysfunction has been described in long-term survivors treated with high-dose methotrexate (HDMTX) (20,21). Longitudinal neuropsychologic assessments of 187 adult survivors of childhood-diagnosed non-Hodgkin lymphoma and treated with HDMTX showed worse memory, executive function, processing speed, and academic performance than did either the normal population or community controls (22). The impact of methotrexate therapy on the brain is influenced by several factors, including dose and method of administration, concurrent treatments, and the patient’s age, sex, and coexisting medical conditions (23). Currently, there is no objective imaging biomarker for methotrexate-induced brain injury. A noninvasive imaging test that could visualize and quantify methotrexate-induced neurotoxicity could be used to identify childhood cancer survivors at risk for long-term neurocognitive problems. Early intervention, such as pharmacologic treatment (with antiinflammatory medications (19), deescalation of methotrexate dose, changes in chemotherapeutic regimen, and cognitive rehabilitation), could be offered along with monitoring of treatment efficacy (24).
Both [18F]FDG PET and MRI have been demonstrated to be useful imaging tools for the detection of cognitive impairment and white matter injury in pediatric patients treated with methotrexate (21,23,25,26). However, to our knowledge, none of these previous studies correlated [18F]FDG PET/MRI findings with neurocognitive tests, the current clinical reference standard. To close this gap, the purpose of our study was to identify imaging changes of HDMTX-induced neurotoxicity on [18F]FDG PET/MRI and correlate results with neurocognitive testing. We hypothesized that imaging metrics of brain morphology and physiology on integrated [18F]FDG PET/MRI scans would correlate well with neurocognitive assessments as our reference standard.
MATERIALS AND METHODS
Study Population
The Institutional Review Board approved this study, and all subjects gave written informed consent. We prospectively enrolled pediatric cancer survivors who were diagnosed with lymphoma, leukemia, or sarcoma and were treated with HDMTX. The inclusion criteria were as follows: cancer patient undergoing HDMTX therapy (≥1,000 mg/m2), age between 6 and 30 y, and written informed consent. The exclusion criteria included contraindications to MRI, active disease at the time of the study, inability to complete the study examinations, and pregnancy. All patients were evaluated by a child psychologist using a brief neurocognitive battery on the same day as the [18F]FDG PET/MRI brain scan. The child psychologist did not know the results of the imaging tests, and the imaging team did not know the results of the neurocognitive assessment. Between January 2021 and August 2022, 22 eligible patients were referred as candidates for study participation by collaborating oncologists. Among the 22 eligible patients, 12 were screened out. Six of these patients did not respond to our study invitation (n = 3) or declined to participate (n = 3), and the other six were excluded because they had progressive disease at the time of the study (n = 4), could not undergo their research scan because of technical issues with the PET/MRI scanner on the day of the study (n = 1), or did not complete neurocognitive testing (n = 1). Our final study population consisted of 10 children and young adults with sarcoma (n = 5), lymphoma (n = 4), or leukemia (n = 1). There were 7 male and 3 female patients with an age range of 9–23 y (mean ± SD, 17.4 ± 4.7 y). Ten subjects received intravenous methotrexate (86,455.80 ± 103,596.04 mg); 5 subjects also received intrathecal methotrexate (98.70 ± 120.15 mg). All participants had completed HDMTX therapy at the time of the brain [18F]FDG PET/MRI. The time between the start of HDMTX therapy and the brain [18F]FDG PET/MRI was 3.92 ± 1.61 y, with a range of 1–6 y. The time between the end of therapy and PET was 3.5 ± 1.5 mo. The participant flowchart is shown in Figure 1.

Flowchart showing selection of study participants.
Brain [18F]FDG PET/MRI Protocol
Subjects were scanned using a 3-T PET/MRI scanner (Signa; GE Healthcare), allowing for simultaneous acquisition of PET and MR images. The subjects fasted for at least 4 h before the [18F]FDG PET study. Serum glucose levels were measured at the time of [18F]FDG injection, and all subjects demonstrated a glucose level below 120 mg/dL. [18F]FDG PET/MRI was performed 30–45 min after intravenous administration of a 3.7 MBq/kg dose of [18F]FDG as recommended by the guidelines of the Society of Nuclear Medicine and Molecular Imaging and the European Association of Nuclear Medicine (27). [18F]FDG was injected in a dedicated room for each subject with the light turned off, and all subjects were required to remain resting with their eyes closed before the PET/MRI scan. No sedation was administered. All subjects underwent MRI of the brain with an 8-channel brain coil. No contrast agent was injected. Axial 3-dimensional (3D) T1 spoiled gradient-recalled images (SPGR) were acquired for PET attenuation correction, with the generation of in-phase, out-of-phase, fat, and water images using the Dixon method. Our MRI protocol included 3D T1 inversion recovery fast SPGR, whole-brain echo-planar diffusion-weighted imaging with 2 diffusion weightings (b = 0 and 1,000 s/mm2), and an arterial spin labeling perfusion sequence. 3D T2 fluid-attenuated inversion recovery and 3D multiple-echo gradient echo images were also acquired. The apparent diffusion coefficient map was automatically generated from diffusion-weighted imaging by the scanner. Arterial spin labeling imaging was performed with a 3D background-suppressed fast spin-echo technique without vascular suppression using a pseudocontinuous labeling time of 1.5 s, followed by a 2-s postlabeling delay. Postprocessed arterial spin labeling imaging was performed by an automated reconstruction script that sent cerebral blood flow (CBF) images to a PACS. Details of the brain [18F]FDG PET/MRI parameters are shown in Table 1.
Brain [18F]FDG PET/MRI Parameters
Neurocognitive Battery
Each subject completed a brief neuropsychologic evaluation with a child psychologist. All measures used had sound psychometric properties and were established and well normed. The battery included the Wechsler Abbreviated Scale of Intelligence, second edition (WASI) (Pearson Assessments), a measure of overall intellectual functioning; screening memory subtests of the Wide Range Assessment of Memory and Learning, second edition (WRAML) (28), a measure of verbal and visual memory functioning; and subtests of the Delis–Kaplan Executive Function System (DKEFS) (29), a measure of executive functioning. The measures were administered in the same order and according to standardized instructions. The tests were selected for their ability to provide information on subjects’ overall intellectual functioning, executive functioning (e.g., working memory, inhibition, set shifting, interference control, and planning), and immediate verbal and visual memory skills. Details are shown in Table 2.
Neurocognitive Tests
Image Analysis
Both PET and MR images were analyzed using PMOD software (version 4.2; PMOD Technologies LLC). One nuclear medicine physician with 7 y of experience performed all the PET analyses. For the PET analysis, each image was normalized to the template space and analyzed with a set of atlas regions. After spatial normalization, all images were visually inspected to ensure accurate registration. We used an automated tool (PNEURO) to segment and generate 3D volumes of interest and measure SUVs. SUVmean was calculated according to body weight. The cortical and gray matter regions analyzed were the prefrontal cortex, cingulate gyrus, and hippocampus. These 3 brain regions were chosen because they are activated or involved during the battery of neurocognitive tests administered in this study, as described in Table 2. The DKEFS test evaluates executive function; the anatomic regions responsible for this function are the prefrontal cortex and the cingulum. The WASI test evaluates the intellectual quotient; the anatomic region responsible for this function is mainly the prefrontal cortex. Similarly, the WRAML test evaluates verbal and nonverbal memory; the anatomic region responsible for this function is mainly the hippocampus. A board-certified neuroradiologist with more than 10 y of image analysis experience and a nuclear medicine physician performed the quantitative MRI data analyses. The same set of atlas regions was used on T1 3D SPGR MR images to calculate the cortical volume of the gray matter in the prefrontal cortex, cingulum, and hippocampus. We used the automatic tool FUSION from PMOD software (PMOD Technologies LLC, version 4.2) to spatially match apparent diffusion coefficient and CBF images to T1 3D SPGR images. We then applied the same set of atlas regions to apparent diffusion coefficient and CBF images and measured the mean apparent diffusion coefficient and mean CBF (CBFmean) for each region. 3D axial susceptibility-weighted angiography MRI sequences were also analyzed to check for any microhemorrhage in the brain parenchyma.
Statistical Analysis
Stanford scores for neurocognitive data were used for analysis (28–30). The mean and SD of Stanford scores ( = 100, SD = 10) were converted to z scores to determine deviation from the mean, with positive z scores representing above-average or higher functioning and negative z scores representing below-average or lower functioning. The relationship between the z scores and other measures is unlikely to be simply linear since we would expect correlations only in cases with a deficit. To simplify the analyses, we assumed that only z scores less than zero represented possible deficits and, thus, potential correlations, whereas z scores greater than zero represented typical nondeficit variation, which would not be correlated. Thus, pairs of multivariable regression models (one for z scores < 0 and one for z scores > 0) were fitted for each region for each imaging measure and test score (the single case with a z score of zero was included in both models rather than being excluded). Heteroscedastic regression models were used to account for heterogeneity in variances among brain regions. As each region had measurements made on both the left and the right sides (the values were similar), adjustment was made for clustering within the patient. As this was an exploratory study with a small sample, no adjustment was made for multiple comparisons. The results of WASI–verbal comprehension index, WRAML–visual memory (WRAML-VIS), WRAML–sentence memory, and DKEFS–sequential tracking (DKEFS-TM4) Stanford score conversions to z scores yielded z scores of ±1 or greater and were used for subsequent correlation analysis with SUVmean and CBFmean; therefore, only these tests were considered for the correlation analysis. Because WRAML-VIS and WRAML–sentence memory were highly correlated (0.88) and thus redundant, we used only WRMAL-VIS for the statistical analysis.
RESULTS
Neurocognitive Tests
We used the z score to detect evidence of deficits in neurocognitive functions in our patients. Nine of 10 patients showed a negative z score for at least 1 test (mean, 3; range, 1–7). Only 1 patient showed a positive z score for all neurocognitive tests.
WASI–verbal comprehension index, WRAML-VIS, and DKEFS-TM4 showed 3 or more negative z scores among the patients. Eight subjects for WRAML-VIS, 6 for WASI–verbal comprehension index, and 4 for DKEFS-TM4 demonstrated z scores of −1 or lower (Supplemental Table 1; supplemental materials are available at http://jnm.snmjournals.org).
WRAML-VIS correlated significantly with CBFmean. DKEFS-TM4 correlated significantly with both SUVmean and CBFmean. WASI–verbal comprehension index did not correlate with any of the PET/MRI measures (Table 3).
Model Estimates of Marginal Effects of Negative z Score on Imaging Measures
Brain [18F]FDG PET
Significant differences in average SUVmean among all 3 brain regions were detected (P < 0.001). SUVmean measurements of the hippocampus (4.46 ± 0.94) were significantly lower than measurements of the cingulum (8.58 ± 1.67, P < 0.001) and the prefrontal cortex (8.94 ± 1.90; P < 0.001), but the latter 2 were not significantly different from each other (P = 0.35). Mean SUVmean data between the left and right sides of each region were not significantly different (Supplemental Table 2).
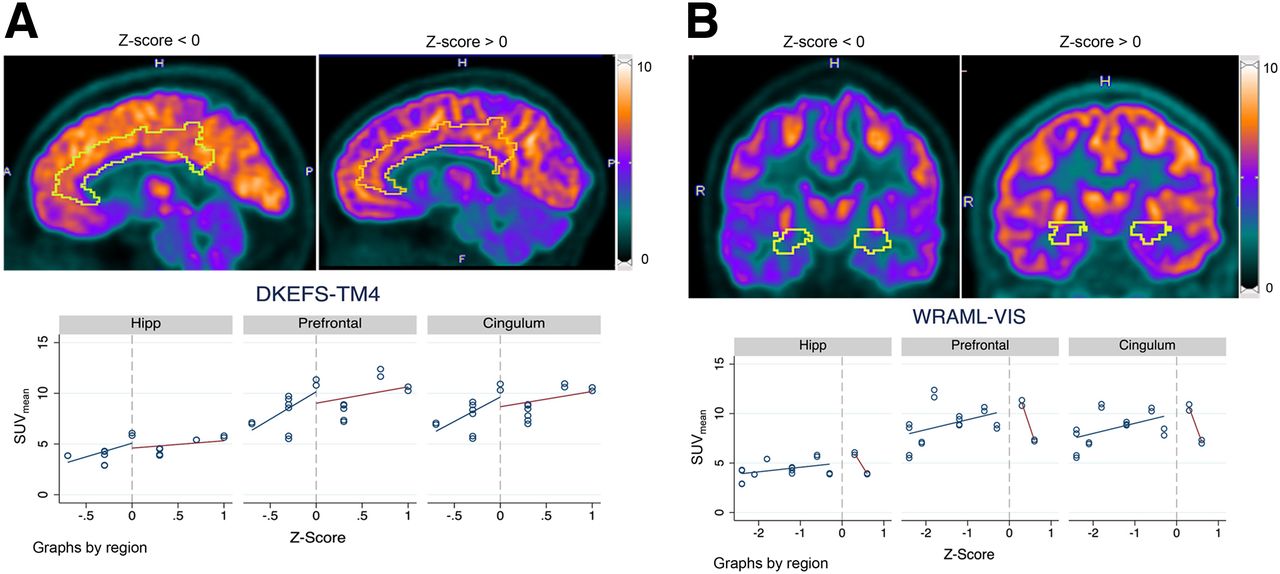
Figure 2 compares [18F]FDG uptake in the cingulum and the hippocampus for patients with low (z score < 0) versus high (z score > 0) performance on DKEFS-TM4 (Fig. 2A) and WRAML-VIS (Fig. 2B), respectively. The regression analysis showed a significant correlation between SUVmean and DKEFS-TM4 z score for the prefrontal cortex and cingulum (P = 0.003 and P = 0.012, respectively) but not for the hippocampus (P = 0.111). We did not find a significant correlation between SUVmean and WRAML-VIS for any evaluated brain regions. Marginal estimates from the model are shown in Table 3. SUVmean did not correlate with the cumulative dose of methotrexate (P = 0.537).

Comparison of [18F]FDG uptake in cingulum and hippocampus (Hipp) for patients with low (z score < 0) vs. high (z score > 0) performance on DKEFS-TM4 (A) and WRAML-VIS (B), respectively. (A) Regression analysis showed significant correlation between SUVmean and DKEFS-TM4 for prefrontal cortex and cingulum (P = 0.003 and P = 0.012, respectively) but not for hippocampus (P = 0.111). (B) There was no significant correlation between SUVmean and WRAML-VIS for prefrontal cortex, cingulum, or hippocampus.
Brain MRI
No anatomic or structural abnormalities were found in the affected brain areas on 3D T1 SPGR or 3D T2 fluid-attenuated inversion recovery imaging. One of 10 patients demonstrated microhemorrhages in the left frontal opercular cortex.
We found significant differences in the average CBFmean among all 3 brain regions, that is, prefrontal cortex, cingulum, and hippocampus (P < 0.001). CBFmean for the hippocampus (48.54 ± 5.99) was significantly lower than for the cingulum (64.54 ± 9.04, P < 0.001) and prefrontal cortex (63.77 ± 8.60, P < 0.001), but the latter 2 were not significantly different from each other (P = 0.34). CBFmean did not significantly differ between the left and right sides of each region (Supplemental Table 2).
Figure 3 compares CBFmean in the cingulum and the hippocampus for patients with low (z score < 0) versus high (z score > 0) performance on DKEFS-TM4 (Fig. 3A) and WRAML-VIS (Fig. 3B), respectively. The regression analysis showed a significant correlation between CBFmean and DKEFS-TM4 for the cingulum, hippocampus, and prefrontal cortex (all P < 0.001). In addition, CBFmean for the hippocampus and WRAML-VIS were inversely correlated (P = 0.003). No correlation was found between CBFmean and WRAML-VIS for the cingulum (P = 0.071) or prefrontal cortex (P = 0.052). Marginal estimates from the model are shown in Table 3. Overall, CBFmean showed a positive correlation with SUVmean (r = 0.56, P = 0.01). CBFmean was negatively correlated with the cumulative dose of methotrexate (r = −0.30, P = 0.002). No significant correlations were found between apparent diffusion coefficient or cortical volume and any of the metrics we analyzed.

Comparison of CBFmean in cingulum and hippocampus (Hipp) for patients with low (z score < 0) vs. high (z score > 0) performance on DKEFS-TM4 (Fig. 3A) and WRAML-VIS (Fig. 3B), respectively. (A) Regression analysis showed significant correlation between CBFmean and DKEFS-TM4 for cingulum, hippocampus, and prefrontal cortex (all P < 0.001). (B) CBFmean for hippocampus and WRAML-VIS was inversely correlated (P = 0.003). However, there was no correlation between CBFmean and WRAML-VIS for cingulum (P = 0.071) and prefrontal cortex (P = 0.052).
DISCUSSION
Our data suggest that [18F]FDG PET/MRI can potentially detect imaging changes indicating HDMTX-induced neurotoxicity. Our observations suggest that the SUVmean and CBFmean of the prefrontal cortex and cingulum may serve as quantitative measures for detecting executive functioning issues. The CBFmean of the hippocampus could also be useful for monitoring memory issues. To our knowledge, this is the first prospective correlation of [18F]FDG PET findings with a matched set of neurocognitive tests in pediatric cancer survivors.
Krull et al. reported a significant association between increased brain functional MRI activity in the frontal and anterior cingulate cortices and poorer executive function scores in a cohort of 218 long-term childhood cancer survivors after therapy with methotrexate (21). These findings align with ours. In fact, we also found a significant correlation between the CBFmean of the cingulum and prefrontal cortex and lower scores on the executive functioning test. Overall, these data suggest that MRI can detect long-term HDMTX-induced neurotoxicity and help identify a subgroup of subjects who are more susceptible to future cognitive deficits.
In our pilot study, 8 of 10 subjects had a memory test with a z score of less than 0. The hippocampus is the brain region related to memory functions. Both SUVmean and CBFmean were significantly lower in the hippocampus than in the cingulum or prefrontal cortex. Although the relationship between the SUVmean of the hippocampus and WRAML-VIS was positive, it did not reach significance, potentially because of the small sample size. Tauty et al. retrospectively evaluated [18F]FDG PET/CT images of 20 children with Hodgkin lymphoma at baseline and 2 mo after starting methotrexate chemotherapy (26). The authors noted hypometabolic areas in the insular cortex, lateral frontal lobe, and posterior cingulate cortex. Decreased [18F]FDG uptake after chemotherapy has been shown by several studies, with the limbic regions, prefrontal cortex, and cingulum being the most affected ones (31,32). It is important to note that these impairments in the acute phase after chemotherapy may be reversible. Findings on posttreatment scans, such as in our study, are more likely to be chronic and may be more useful for detecting clinically significant toxicity, although additional investigation is needed. The findings of both acute and chronic abnormalities could support the use of imaging biomarkers to predict who is at risk for developing long-term neurocognitive problems; such patients could receive antiinflammatory preventive therapies and closer monitoring for earlier implementation of rehabilitative services.
Given the recent discovery that the brain toxicity induced by methotrexate can be reversed by administering antiinflammatory drugs (19), our study holds significant importance. During the past decade, several registries of pediatric cancer survivors have been established both in the United States and in Europe with the purpose of recognizing and treating long-term disabilities after chemotherapy (7,33–35). Most of these longitudinal studies used siblings as controls and measured neurocognitive impairments with self-assessed questionnaires. A cohort study including 840 survivors and 247 siblings showed that survivors encountered significantly more impairment in concentration (12% vs. 6%), working speed (20% vs. 8%), and memory (33% vs. 15%) than controls. Patients who had received cranial irradiation were most severely affected (7). Although there is a large amount of survey-based data, there is a lack of data on imaging findings, which are arguably more objective. Pediatric cancer survivors are more likely to complete a survey than undergo brain imaging during their follow-up visits. However, our preliminary data suggest that dedicated brain [18F]FDG PET/MRI performed after HDMTX therapy could help select a subgroup of patients who have developed HDMTX-induced neurotoxicity. With timely and appropriate interventions (e.g., antiinflammatory medication (19) or neurocognitive rehabilitation (24)), there is a possibility to prevent long-term neurocognitive complications. As research uncovers the mechanisms of neurotoxicity for other chemotherapy drugs, imaging may become increasingly important to screen for effects that may be reversible with treatment or remediable with other interventions.
In our pilot study, we found an association between higher CBFmean values and lower scores on WRAML-VIS. Studies on mouse models show that methotrexate first leads to microglia activation, which may transiently increase CBF, followed by neuronal myelination impairment, which would be expected to cause decreased CBF values (19). Thus, in patients, we would expect initially increased CBF values, followed by a CBF decline. Further evaluations are needed to better evaluate the time course of changes in CBF values and their correlation with measures of visual memory.
The cumulative dose of methotrexate inversely correlated with CBFmean but not with SUVmean. This can be explained by the many factors that affect the drug’s neurotoxic effects, including the inherent vulnerabilities and the presence of preexisting neurologic conditions, among others (23). It is well known that methotrexate-induced brain toxicity has a multifactorial etiology; some pediatric patients may experience no or minor neurologic issues, whereas others may experience severe and long-term neurocognitive deficits (36). A noninvasive imaging test that could visualize and quantify HDMTX-induced neurotoxicity could be used to identify childhood cancer survivors at high risk for long-term neurocognitive problems who may benefit from targeted interventions. It would be interesting to examine the usefulness of other PET radiotracers, such as [11C]PK11195, in this context. [11C]PK11195 is expressed by reactive glial cells and macrophages and has been used as a PET tracer to visualize brain inflammation in vivo (37).
Our study had several limitations. First, this was a pilot study with small patient numbers and heterogeneity in disease conditions (osteosarcoma, lymphoma, and leukemia), clinical features, and methotrexate exposures (systemic and intrathecal). Larger cohorts of patients treated with and without HDMTX may be helpful in clarifying the effects of this drug. Nevertheless, to our knowledge, this was the first prospective clinical trial that has correlated [18F]FDG PET/MRI metrics with neurocognitive tests in a cohort of pediatric cancer survivors. We encountered difficulties in the recruitment process. The main one was that this study was funded in 2021, immediately after the coronavirus disease 2019 pandemic. Several subjects were not comfortable coming to the hospital strictly for research purposes. We believe that performing brain imaging during regularly scheduled clinical follow-up visits would address this obstacle in future studies. Five of our patients received intrathecal methotrexate, which can be a confounding factor for correlations of intravenous methotrexate doses with neurocognitive injuries. Although it is well known that patients who were treated with HDMTX developed neurocognitive problems (20–22), it has been also described that the administered methotrexate dose did not correlate with the degree or location of specific brain injuries (21). Our data close this gap, demonstrating that the degree and location of specific brain injuries on [18F]FDG PET/MRI correlated with neurocognitive impairments. Our [18F]FDG PET/MR assessment can be applied to patients who received intravenous methotrexate, intrathecal methotrexate, or both. Another limitation of the study is related to the radiation exposure from the radiotracer and the potential need for sedation in younger children. However, these exposures may be worthwhile if they identify remediable abnormalities or suggest interventions that could prevent long-term complications. Moreover, our study lacked a control group. This is a well-known limitation of imaging studies in pediatric patients. Many authors, including our group, have used baseline imaging as personal subject-based controls, but this is not always useful in pediatric patients because their brain develops with increasing age. Furthermore, some patients who underwent HDMTX treatment, such as leukemia patients, did not undergo routine PET scans before starting chemotherapy. Besides, we could not rule out whether some of the findings in this study were due to neuroplasticity in the young-aged participants. Although [18F]FDG PET/MR images can provide valuable insights into changes in brain structure and function indicative of neuroplasticity, interpreting these changes accurately often requires a multidisciplinary approach.
CONCLUSION
Our study suggests that [18F]FDG PET/MRI may be useful for diagnosing the imaging effects of HDMTX therapy on the brains of pediatric cancer survivors. This could facilitate earlier interventions using antiinflammatory treatments. Furthermore, it may enable more effective monitoring of treatment outcomes, particularly for a subset of patients more prone to developing HDMTX-associated neurocognitive impairment. However, further assessments in larger, more homogeneous cohorts are needed.
DISCLOSURE
This research was funded by an NIH grant from the National Cancer Institute (R21 HD101129). No other potential conflict of interest relevant to this article was reported.
KEY POINTS
QUESTION: Can [18F]FDG PET/MRI detect brain injury after HDMTX therapy in pediatric cancer survivors?
PERTINENT FINDINGS: A significant correlation was found between the z score for the DKEFS test and SUVmean and CBFmean values in the cingulum and prefrontal cortex.
IMPLICATIONS FOR PATIENT CARE: Using [18F]FDG PET/MRI for assessing the cerebral impact of methotrexate therapy in pediatric cancer survivors holds the potential to expedite interventions with antiinflammatory remedies and enable effective monitoring of treatment outcomes. This is particularly crucial for patients with a heightened vulnerability to HDMTX-associated neurocognitive impairment.
Footnotes
Published online Apr. 4, 2024.
- © 2024 by the Society of Nuclear Medicine and Molecular Imaging.
REFERENCES
- Received for publication October 2, 2023.
- Revision received February 26, 2024.
In this issue


Jump to section
Related Articles
Cited By...
- No citing articles found.