


Abstract
Diseases of the central nervous system are common and often chronic conditions associated with significant morbidity. In particular, neurodegenerative disorders including Alzheimer and Parkinson disease constitute a major health and socioeconomic challenge, with an increasing incidence in many industrialized countries with aging populations. Recent work has established the primary role of abnormal protein accumulation and the spread of disease-specific deposits in brain as a factor in neurotoxicity and disruption of functional networks. A range of therapeutics from small molecules to antibodies targeting these proteinopathies are now in phase 2 and phase 3 clinical trials. These studies are methodologically challenging because of difficulty in accurately diagnosing early disease, the slow and variable rates of progression between individuals, and efficacy measures that may be cofounded by symptomatic improvements due to treatment but not reflecting disease course modification. Further, the ideal candidates for these treatments would be at-risk, or premanifest, persons in whom the pathologic process of the neurodegenerative disorder has begun but who are clinically normal and extremely difficult to identify. Scintigraphic imaging with PET and SPECT in trials offers the opportunity to interrogate pathophysiologic processes such as protein deposition with high specificity. This review summarizes the current implementation of these imaging biomarkers and the implications for future management of neurodegenerative disorders and central nervous system drug development in general.
Drug development for diseases of the central nervous system has readily embraced the use of biomarkers as important tools for clinical therapeutic trials. The prime examples reflecting the most advanced use of biomarkers in central nervous system drug development, and of imaging biomarkers in particular, are in neurodegenerative disease. These represent a wide constellation of clinical syndromes reflecting for each disorder a characteristic pathophysiology and evolving pattern of changes in the brain. As a group, these disorders are common and generally encountered in older individuals in countries with aging populations. In Alzheimer disease (AD), the most common of the neurodegenerative disorders, prevalence increases incrementally with advancing age. Data suggest that individuals demonstrating cognitive impairment consistent with an AD-type dementia range from 5.3% of those aged 60–74 y to 34.6% of those aged 85 y or older (1). Aging is the greatest risk factor for developing AD, higher than high-risk genotypes such as apolipoprotein-E4 (2,3).
With these increasing numbers comes greater demand for residential care and nursing services and concern about the capacity of health-care systems to scale up. Costs associated with AD include nursing home care, physician visits, hospitalizations, and treatment, as well as costs that are more difficult to account for, such as loss of productivity and uncompensated hours of care provided by family members (4). Recent health economics studies have focused on the high economic and social burdens on families caring for their afflicted member (5). Over the next 30 y, the worldwide costs of caring for individuals with AD are estimated to increase by a factor of 10 (6). These observations are no less true for Parkinson disease (PD), the second most common neurodegenerative disorder. Approximately 1,000,000 people in the United States carry this diagnosis, representing a prevalence of about 0.3%. Again, the disease is more common in the elderly, with rising incidence rates in increasingly older cohorts (7). The estimated total economic costs posed by PD is expected to increase 52% to $79 billion by 2037 (8).
These increasing social and economic burdens underscore the urgency to develop interventions that reduce morbidity, delay disease progression, and maintain viable function and quality of life for as long as possible. The purpose of this review is to systematically explore how nuclear imaging supports development of these interventions, highlighting how the use of imaging has evolved as a crucial part of this endeavor and informs future clinical nuclear medicine practice.
THE CHALLENGE OF DEVELOPING DRUGS FOR NEURODEGENERATIVE DISORDERS
These looming problems notwithstanding, the last 20 y have demonstrated significant progress in understanding the primary changes in the brain associated with neurodegenerative diseases (9,10), focusing on therapies that may slow, stop, or even reverse the disease course. Neurodegenerative diseases are primary disorders of protein deposition and distribution throughout the brain (Table 1). Common features of proteinopathies include the inexorable spread of aberrant protein species in intracellular and extracellular deposits, leading to neuronal or glial cell death, the disabling of functional networks, and the emergence of clinical signs and symptoms reflecting this pathology (11,12).
Key Clinical Features and Primary Pathology in Neurodegenerative Disorders
NOTEWORTHY
Improved understanding of the basic pathophysiology of neurodegenerative disorders as brain proteinopathies provides new targets for treatment and biomarkers supportive of both clinical trials and clinical treatment.
The roles of biomarkers are varied, depending on the needs of the clinical trial, including demonstration of target engagement, dosing determinations, cohort enrichment, diagnostic confirmation, disease monitoring, and clinical efficacy assessments.
As imaging biomarkers become routine in clinical research use, they are defining their role in the clinic for routine management for those at risk for or manifesting neurodegenerative disease.
Imaging biomarkers are a pathway to precision medicine supporting appropriate treatment across the spectrum of central nervous system disease.
The etiology of these disorders is largely unknown; however, significant strides have been made toward characterizing the primary proteinopathy and course from the initiation of the disease process, through a clinically silent phase that is years in duration, to the first symptoms, and finally to full disease manifestation (Fig. 1). This knowledge informs therapeutic strategy, including taking advantage of the long, protracted period before the appearance of overt symptoms as an opportunity to salvage significant function and potentially delay the onset of symptoms.
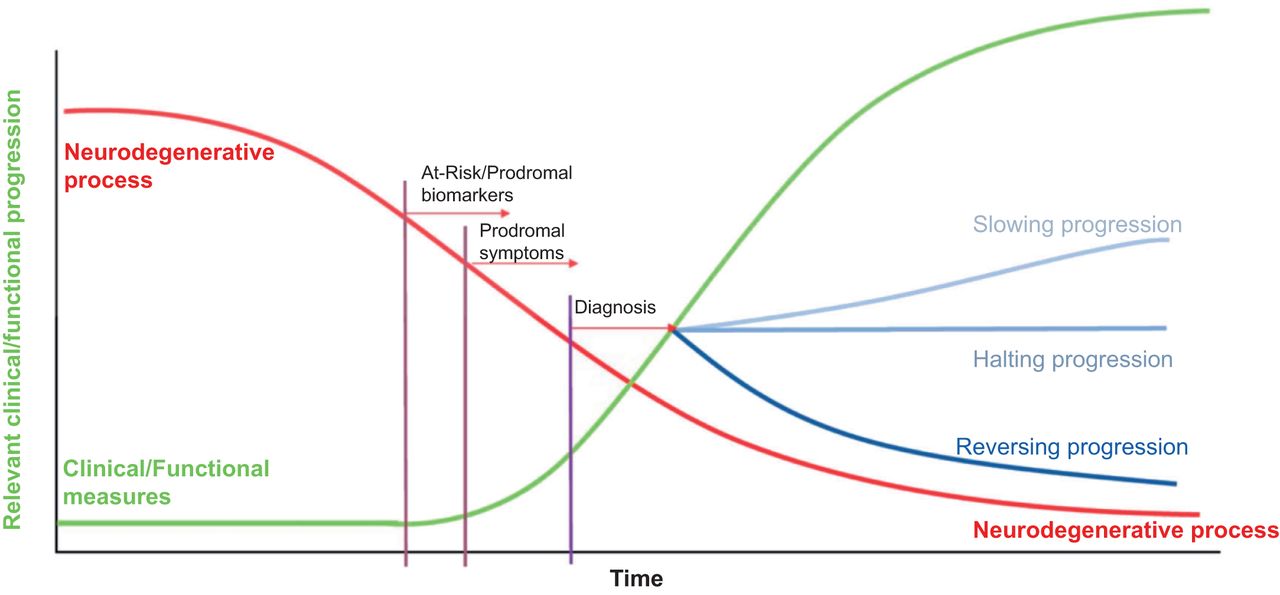
Model neurodegenerative disease time course. Neurodegenerative process is indicated in red as starting insidiously and remaining silent for years before clinical symptoms manifest (green line). Effects of interventions on green curve are indicated by blue curves on right, whereas diagnosis, prodromal symptoms, and at-risk assessment period tied to pathophysiology suggest that imaging biomarkers may be changing years before clinical symptoms. (Adapted with permission of (47).)
There are significant obstacles to translating knowledge of disease mechanism into effective treatments. Some of the problems result from the heterogeneity in clinical phenomenology, with variability in symptom expression and progression rates. PD progression is slow and quite variable between patients. With such a slow rate of change in motor and nonmotor symptoms, tracking even a 50% slowing of this change rate on a clinical assessment scale or motor score after a disease-modifying intervention is quite difficult. This is especially problematic when clinical assessments are confounded by the salutary effect of symptomatic medications, making it difficult to assess the baseline disease because of an inability to completely wash out medications such as l-dopa, even after a 2-wk withdrawal (13). The presymptomatic phase offers a potential opportunity to intervene to delay or prevent manifest symptoms, but the problem is in identifying these presymptomatic or at-risk individuals.
DEVELOPING IMAGING BIOMARKERS
Both imaging and nonimaging biomarkers may be of some utility in the clinical trial. Scintigraphic biomarkers using PET and SPECT have played different roles in multicenter clinical treatment trials in AD, PD, and other disorders. These roles include demonstrating target engagement, aiding dosing determinations (14), enriching at-risk cohorts (15,16), describing the pathologic phenotype, serving as a gatekeeper for trial eligibility, assessing the natural progression of disease (17,18), and evaluating the efficacy of a therapeutic intervention (Table 2) (19).
Roles of Imaging Biomarkers in Drug Development
Review of peer-reviewed articles on AD studies using amyloid or tau PET shows strong growth in the numbers of papers published annually from 2010 through 2021 (Figs. 2A and 2B). These data demonstrate the rapid development and implementation of PET β-amyloid (Aβ) reflected in the increased number of papers published early and augmented several years later with the introduction of tau PET. This rise in publications is consistent with clinical trial data for AD studies performed over roughly the past 7 y, compiled in clinical trials.gov (Figs. 2C and 2D). These data show the relative proportion of PET targets in AD studies divided into “completed trials” or “recruiting trials.” For studies with the status of closed or completed, the primary target was amyloid, whereas tau and other targets represent a larger component of recruiting projects. This finding suggests that an evolving and expanding spectrum of imaging targets is being used in clinical trials.
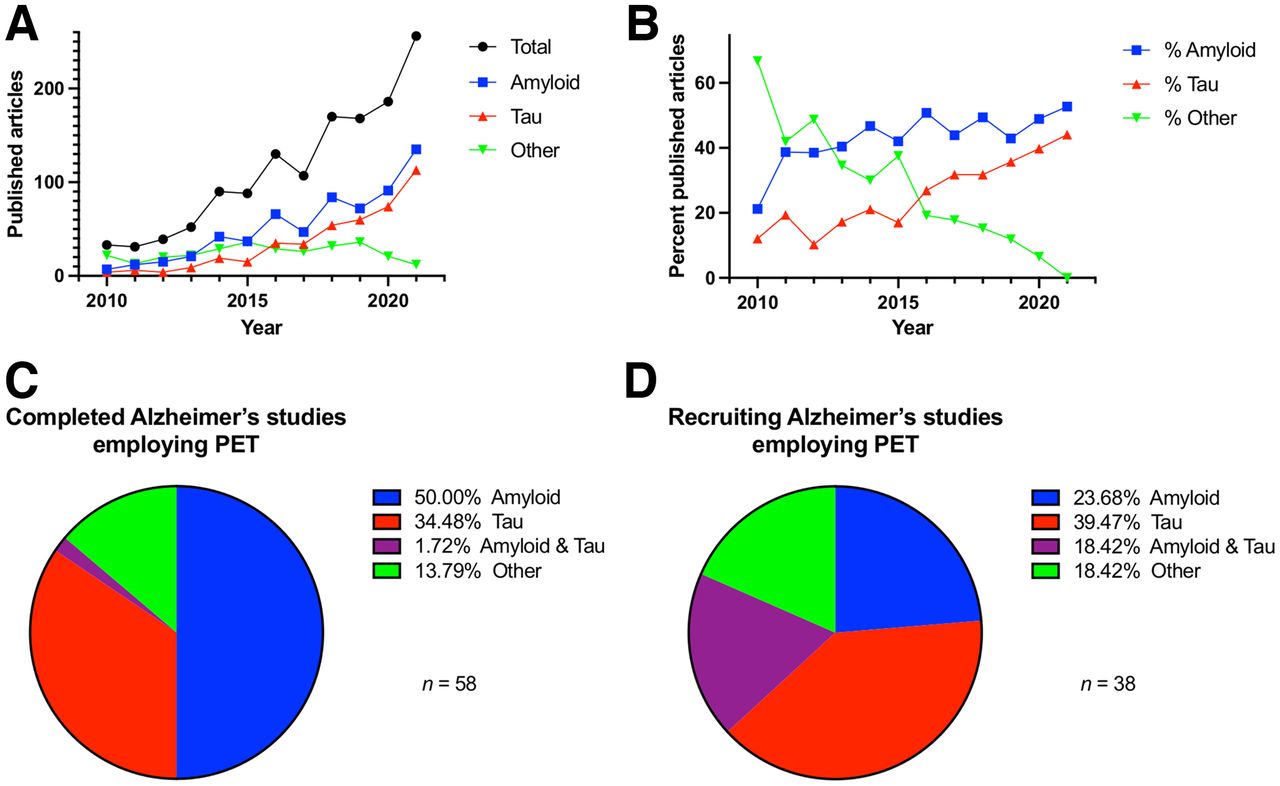
(A) Number of papers in neurodegenerative disease published between 2010 and 2021 for which PET imaging was performed. These were largely amyloid and, later, tau studies. (B) Data showing high percentage of amyloid PET studies with tau PET coming in last 5 y. Source: PubMed. (C and D) Percentage breakdown of PET radiopharmaceuticals for amyloid and tau in AD for studies with status “completed” (C) or “recruiting” (D), demonstrating more recent focus on tau in research activity. Source: clinicaltrials.gov.
Preliminary to its use in clinical trials, a biomarker itself needs to be validated, including understanding the relationship between the biomarker and the pathology it purports to measure (Table 3). For imaging biomarkers involving radiopharmaceuticals, this process is comparable to standard drug development requirements for demonstrating safety and efficacy. Indeed, the amyloid and tau tracers served as biomarkers in multicenter AD trials with investigational therapeutics while concomitantly being developed for clinical use. The result was the unusual circumstance of use of 2 investigational drugs in the same trial, even as both were in early- to mid-development phases (20). Although issues arose concerning how to assign adverse events to the appropriate drug, both development programs benefited. The safety database of the investigational imaging agent greatly expanded, as did experience with real-world use of the radiotracer, informing the best protocols for acquisition and processing and algorithms for visual reads. For the treating drug, imaging enhanced the accuracy of the diagnostic cohort by setting eligibility requirements to a pathophysiology standard.
Expected Imaging Findings in Neurodegenerative Disorders
Radiopharmaceutical development is similar to pharmaceutical development and subject to the same the pitfalls, scientific challenges, and regulatory requirements. However, unique to radiopharmaceutical development is the low mass dose of injected compound and hence the relative paucity of adverse events. The process of radiotracer development may be described as occurring in 4 stages: discovery, assessment, validation, and application (Table 4).
Development of Imaging Biomarkers for Clinical Trials
Discovery is the process of investigating promising chemical structures that have a chance for high affinity and selectivity for the target. The discovery process also exploits modifications to create a series of compounds with different pharmacokinetics and pharmacodynamics. The original 11C-labeled amyloid compound Pittsburgh compound B was based on thioflavin-T and modified for in vivo use as a radiotracer (21). Certain target criteria regarding affinity, selectivity, and P-glycoprotein substrate status are initial goals for successful in vivo use. The introduction of highly efficient screening processes have greatly streamlined this aspect of development (22).
The assessment phase for radiopharmaceuticals requires that the labeled compounds be produced with good yields and high specific activity; have appropriate lipophilicity for brain penetration without decreasing signal-to-noise ratio; have radiochemical stability; and, on injection, show high target uptake, fast washout of background activity, low off-target binding, and no confounding metabolites, as well as not being a substrate for P-glycoprotein.
Validation is characterization of in vivo pharmacokinetic properties evaluated in nonhuman primates or human phase 1 trials (23). This stage checks the robustness and reproducibility of the outcome measure and entails kinetic modeling of radiotracer distribution, development of quantitative measures (e.g., distribution volumes or nondisplaceable binding potentials), and comparison with simple tissue ratio methods such as SUV ratios (SUVr) to understand any bias associated with these ratio methods (24). Validation permits optimizing the acquisition protocol to minimize patient time in the camera (25). Radiopharmaceuticals must have a good safety profile, with chemical toxicity studies, radiation dosimetry studies, and human studies evaluating adverse responses—all this in the service of providing an imaging outcome measure that is quantifiable and reproducible, reflects the pathology, and allows multiple scans over the course of a clinical trial.
Application refers to the use of the biomarker in clinical research trials. Specifically, logistic issues arise in getting a high-specific-activity, good-manufacturing-practice–produced radiotracer to the imaging site at an adequate injected dose in a timely and consistent fashion. Distribution networks need to be established that allow the greatest number of imaging centers to be supplied by the fewest production centers and that allow these facilities to scale up to meet needs when additional imaging centers are being onboarded. From the standpoint of the imaging, fewer imaging sites are better because PET technical standardization is easier for creating a highly reliable pooled dataset across different studies sites. The need for fewer imaging sites may conflict with the recruitment needs of the trial, which pushes for more clinical sites. One solution is to create a spoke-and-hub model in which multiple clinical sites feed patients into a single imaging center.
Further, the service life of the PET camera must be considered, given the long duration of these trials. The ideal is to image an individual on a single camera at baseline and at follow-up and to acquire and process those scans in the same fashion and similarly to other scans in the study. Because of the different technical characteristics associated with cameras (e.g., reconstructed resolution, attenuation correction, and sensitivity) there will be differences. Fortunately, the main outcome measure in most clinical trials is a ratio of target uptake to background (SUVr) and is forgiving of issues such as sensitivity drift (26). The protocol for standardization of PET and MRI biomarkers in the Alzheimer Disease Neuroimaging Initiative was an early accomplishment of the study (27). Image quality assurance is managed by a rigorous site setup process in which phantom studies and proscriptive protocols for image acquisition and processing help standardize data.
ISSUES AND CONTROVERSIES
Imaging biomarkers in clinical therapeutic trials of neurogenerative disease have dynamically changed over the last decade with the introduction of new radiopharmaceuticals, technical advances in instrumentation, more sophisticated image-processing algorithms and outcome measures, and the thoughtful integration of different biomarkers into the clinical trial to achieve multiple ends (e.g., eligibility and treatment efficacy). Some issues that highlight this development are the identification and optimization of radiotracers for protein deposition targets; quantitative and semiquantitative outcome measures; eligibility issues; and correlation, concordance and discordance of imaging with other biomarker and clinical assessments.
Target identification of protein deposition for tau is complicated by different tau isomers, which create different structural brain deposits and for which tau radiotracers have different affinities (Table 5). This issue is an opportunity insofar as some radiotracers have higher affinity for the 4R isoform (28) and may be useful for eligibility assessment of progressive supranuclear palsy in clinical trials (29).
Some Tauopathies and Their Brain Targets
QUANTITATIVE PET OUTCOME MEASURES
For quantitative assessment of PET or SPECT, multicenter trials have relied on simple target-to-background brain tissue ratios such as the SUVr or the specific binding ratio. These have the advantage of being tolerant of camera sensitivity drifts, being relatively easy to obtain, not requiring blood sampling or arterial lines, and generally having robust test–retest reproducibility. However, the SUVr is a semiquantitative measure that is affected by factors beyond the target site binding that its purpose is to measure. These factors include the hydration state of the patient, differences in metabolism, and parent compound binding to intravascular plasma proteins—essentially anything that alters blood flow, delivery of the radiopharmaceutical to the brain, and washout of the radiopharmaceutical from the brain. Some have strongly argued that brain tissue ratios are misleading and should not be used for quantitation, whereas others advocate a compromise solution in which at least some dynamic data with metabolite-corrected input function are acquired to assess the level and direction of bias posed by the SUVr (30). These studies should be both in the targeted population and in controls to confirm the extent of under- or overestimation of the ratio. From a practical perspective, many imaging centers cannot acquire dynamic scan data or sample and analyze arterial blood to generate an input function for kinetic modeling. Finally, the direct impact of the treatment on the chosen imaging outcome measure should be known. Does treatment affect the distribution or binding of the radiopharmaceutical to the target by means outside its purported mechanism of action for slowing disease progression? This question is often addressed by a small study on patients and controls before initiation of the large multicenter trial, sometimes in the context of a test–retest reproducibility study, to gauge the robustness of the chosen outcome measure.
On the basis of regional availability, some large AD clinical trials have used different radiotracers for amyloid and needed a means to compare SUVr between the different tracers. This comparison is accomplished with the centiloid conversion, in which an SUVr is converted to common centiloid units, which rescale the original SUVr from 0 to 100 based on the SUVr range from healthy volunteers to AD participants referenced against the Pittsburgh compound B standard (31).
PET VISUAL READS
For each radiopharmaceutical, there is a unique pattern of uptake and brain distribution that can be understood and applied to an algorithm for visual interpretation of scans as either positive or negative or, with even more granularity, by assessing the extent and brain distribution of radioactivity consistent with an ongoing neurodegenerative process. This is best exemplified by the differences between the visual read methods for the tau PET radiotracers flortaucipir and MK-6240, with the former having a highly proscriptive algorithm for assessing temporal lobe positivity because the adjacent off-target uptake obscures mesial temporal structures.
As with other biomarker measures, a visual read needs to be validated for accuracy against some gold standard. This was a clinical diagnosis either by the site or by central expert panel agreement; because of the logistic difficulty in performing postmortem studies, rarely was pathology used for validating the imaging. This validation method changed with the commercial clinical development of PET amyloid tracers, initially florbetapir and then florbetaben and flutemetamol, all of which provided confirmatory postmortem evidence of the veracity of the amyloid PET scan in end-of-life participants compared with their own histopathology. This higher truth standard obviates some of the issues with clinical standards, including the fact that in age-matched healthy volunteer groups scans may be abnormal in 20%–30% of those aged 65 y or older. This population is the focus of a large multicenter clinical trial, the Anti-Amyloid Treatment in Asymptomatic Alzheimer Disease Study, which suggests that those abnormal scans represent early AD and reflect the time lag between the onset of brain pathology and subsequent manifestation of symptoms (32).
Visual reads served as the major assessment for amyloid PET in a series of AD clinical trials and have been important in identifying potential research participants who do not have amyloid and are thus unlikely to have the disease targeted by the treatment. The rate of negative scans for participants sent for evaluation of brain amyloid burden runs from 10% to 20%, depending on the recruitment cohort, with higher rates of negative scans in participants earlier in their disease course. This finding means that potential participants by all other measures are appropriate for enrollment but that the amyloid PET suggests otherwise.
Ethical issues of appropriate disclosure to the potential research participant arise in instances of discordance between amyloid PET and the clinical team’s diagnostic impression. The discordance falls both ways: clinical impression positive for AD and amyloid PET–negative, or clinical impression negative for AD and amyloid PET–positive. The latter raises the delicate question of a potential AD diagnosis and is addressed in clinical trials with educational materials, a detailed informed consent, and discussion with the clinical team during the consent process (33).
Discordant interpretations of scans may also occur between the central core lab and the nuclear medicine site. Realistically, discordance is low, at approximately 3%–4% of cases reviewed by a local reader and the core lab readers. All readers are applying the radiotracer-specific read algorithm to their interpretations, but for those difficult-to-interpret scans there may be more of a tendency for biasing of the core lab toward negativity. Sites are under pressure to recruit and may be biased toward positivity and inclusion.
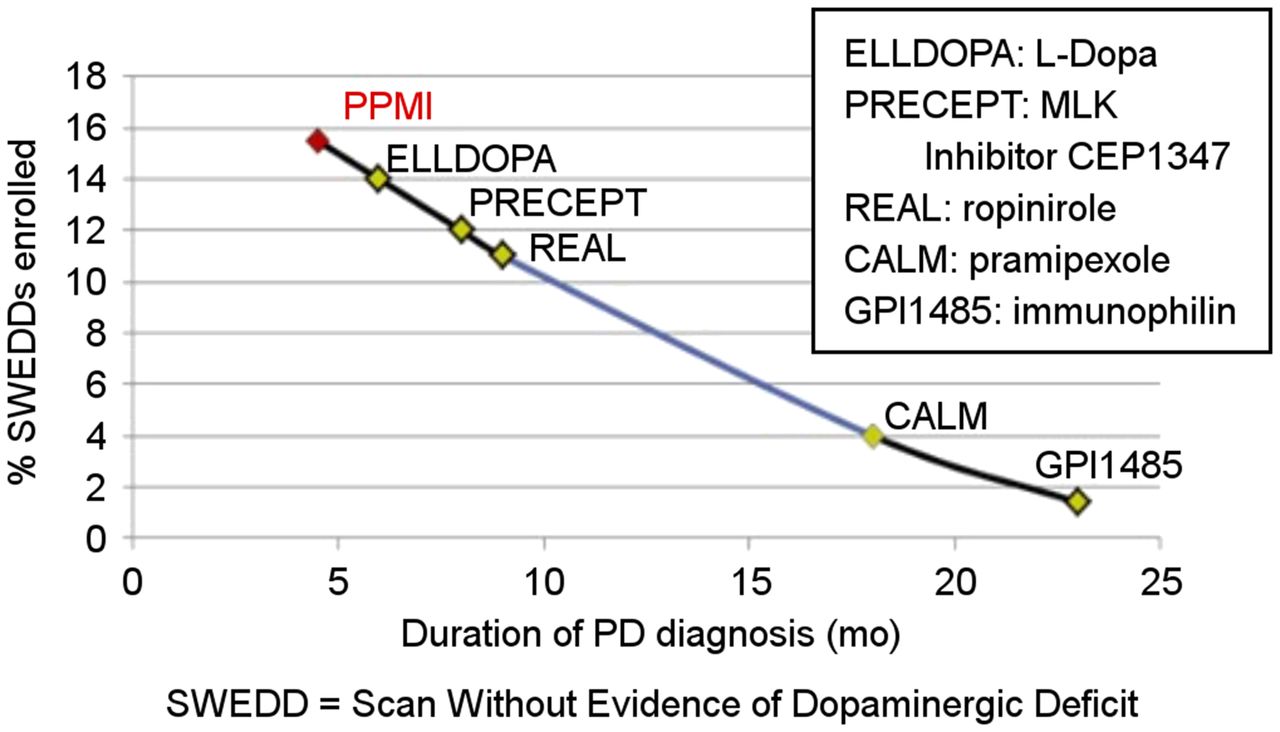
The central core lab and clinical site may run into discordance around diagnosis and eligibility for enrollment in the trials. Specifically, the imaging will sometimes show negative studies in a participant thought by the clinical team to have AD or PD. In PD, the phenomenon of normal scans in potential participants for a PD trial was given the name “scans without evidence of dopaminergic deficit,” designating the participants meeting clinical criteria for PD but having no reductions of striatal DAT binding on scans without scintigraphic evidence of PD. When followed up longitudinally, these patients’ scans do not change, medication doses do not increase, and little clinical change occurs (34). The proportion of scans without evidence of dopaminergic deficit in a trial is related to the duration of symptoms, with longer durations associated with fewer normal scans in putative PD subjects (Fig. 3). This finding suggests that the accuracy of the initial clinical assessment may have been affected more in those with a shorter disease duration, consistent with other studies of diagnostic accuracy in clinically uncertain suspected-parkinsonism patients (35). These trials indicate that clinical diagnosis at enrollment overcalls PD relative to a 1-y follow-up gold standard, whereas imaging is more accurate at the baseline assessment (36).

Percentage of normal scan results in early PD trials for patients with clinical diagnosis of PD demonstrate that at earlier time points after symptom presentation, percentage of dopamine transporter SPECT scans known as SWEDD increases. Diagnostic certainty improves with longer duration of illness. (Adapted with permission of (48).)
CORRELATION WITH CLINICAL MEASURES
Imaging biomarkers are secondary outcome measures to the primary clinical measure in therapeutic trials. Complementary information from biomarkers may not align with primary clinical assessments, and correlations between imaging biomarker quantitative outcomes and clinical measures can be modest to poor. For example, in PD the correlation between specific binding ratios and clinical measures such as the Movement Disorder Society Unified Parkinson Disease Rating Scale are poor at the onset of disease and, with progression, show moderate correlations (r = 0.30–0.40) (37). This is because imaging biomarkers interrogate aspects of the central nervous system different from those interrogated by a clinical measure. The former provides a high-specificity demonstration of a particular target, such as amyloid, dopamine transporters, or another physiologic entity. Clinical outcomes are more downstream and represent the synthesis of the disease-affected output and compensatory networks. In a very dynamic system of a neurodegenerating brain, correlation with clinical outcomes is different depending on when one measures the biomarker. This is not a weakness but, rather, the purpose of using complementary outcome measures, which can take advantage of these differences, such as in using imaging to identify at-risk individuals before the manifestation of classic symptoms of the disease.
COMPLEMENTARITY AND INTEGRATION OF BIOMARKERS IN CLINICAL TRIALS
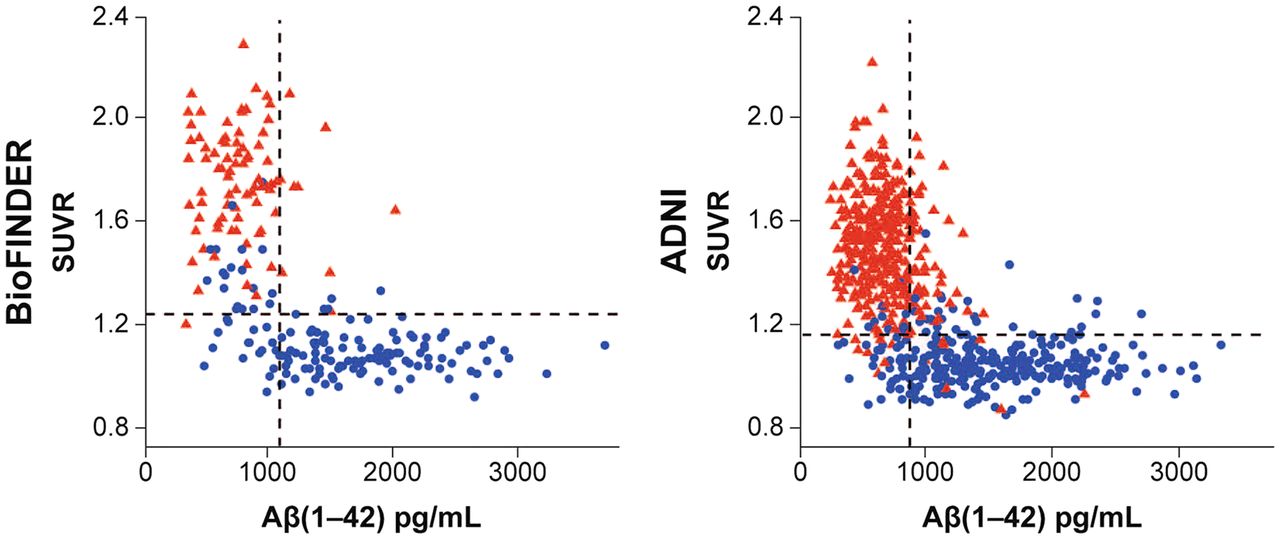
It is not unusual for there to be several biomarkers, both imaging and nonimaging, that interrogate a single target. For example, one can determine amyloid positivity with amyloid PET, assays of cerebral spinal fluid or blood, or retinal examination. For trial eligibility, some studies now use hybrid approaches depending on the availability of amyloid radiopharmaceuticals or cerebrospinal fluid measures (Aβ(1–42)) based on the high concordance rate between the measures (Fig. 4) (38). Sometimes the biomarker best suited to the requirements of the study must be identified. These may be biomarkers within or between modalities. Examples are selection of an optimal tau PET agent for combined eligibility and disease monitoring or identification of the most sensitive way of detecting AD progression among PET and MRI measures such as cortical thickness (39,40).

Correlation between PET amyloid SUVr and cerebrospinal fluid measures of Aβ(1–42) in BioFINDER study and Alzheimer Disease Neuroimaging Initiative (ADNI). Triangles indicate positive scans on visual read, whereas circles are negative on visual read. There is inverse correlation between PET SUVr and cerebrospinal fluid Aβ in both studies. (Reprinted with permission of (38).)
To address the need for validated imaging biomarkers for clinical trials, several large multicenter trials were developed to study the natural progression of disease in both AD and PD. The Alzheimer Disease Neuroimaging Initiative and the Parkinson Disease Progression Marker Initiative are examples of such consortia. Both studies in their respective areas focus on the logistics of conducting standardized international multicenter multi-imaging modality studies in ways that provide for the highest standards of technical sophistication and standardization across not only biomarkers but also other clinical measures. The success of these trials is measured by the influence on clinical trial design and the number of studies that have been developed using these data. Data are open-access so that the academic and pharmaceutical communities can test hypotheses with data that they would otherwise have had to acquire themselves, with less efficiency, a longer time to get results, and greater expense. From a regulatory perspective, greater standardization of methods and analyses across different studies, different pharmaceutical companies, and different treatments allows for regulatory efficiency in proving the safety and efficacy of the therapeutic.
FUTURE OUTLOOK AND RELEVANCE TO CLINICAL PRACTICE
The past 5 years have witnessed the evolution of an infrastructure and network of sophisticated clinical and imaging sites working in concert with radiopharmaceutical providers for conducting trials on imaging biomarkers. Looking forward, one anticipates the further development of additional tracers with specificity for targets of interest, extension of many of these techniques to other central nervous system abnormalities, and, finally, a more intelligent and efficient use of imaging biomarkers in both future research and future clinical care. There is a pressing need for biomarkers to interrogate α-synuclein, the primary proteinopathy in PD (41). Recent advances include the α-synuclein seed amplification strategies for detection of the protein in cerebrospinal fluid, saliva, and skin (42) and the preliminary human data in multiple-system-atrophy patients with the putative a-syn PET tracer ACI-12589. The role of other physiologic processes, such as inflammation, mitochondrial function, or the density of synaptic receptors, is also of interest and is undergoing validation as PET radiotracers (43).
Imaging biomarkers have proven useful in clinical research, and the algorithms and methods developed in these trials have potentially significant translatability to the practice of clinical care and nuclear medicine. Determining eligibility and appropriateness for a disease-modifying therapy in clinical trials would be not too different in the clinical world at large. Specifically, the costs of many of these treatments may be high enough, and performing an imaging biomarker study before treatment with the agent will ensure that the scan is positive for the disease that the biomarker describes. In addition, it remains to be demonstrated whether imaging can be used on an individual basis to assess the efficacy of treatment or imaging biomarkers alone or in combination with other assessments that can predict the rate of progression.
Even as we look forward to the answers to these questions, the field has not yet taken advantage of the synergistic use of biomarkers already in existence. The clever combination of fluid, genomic, clinical, and imaging and nonimaging biomarkers can more accurately characterize phenotype, identify at-risk individuals, and better follow and evaluate the effects of putative neuroprotective and neurorestorative agents. Of particular promise are efforts at accurate, early determination of a pathophysiologic process such as amyloid deposition, which, if proving amenable to a disease-modifying treatment, would make phrases such as “Alzheimer disease prevention” a reality and no longer an oxymoron.
DISCLOSURE
Dr. Seibyl acknowledges the support of the Michael J. Fox Foundation for PD research and is a consultant to Invicro, Biogen, AbbVie, GE Healthcare, Life Molecular Imaging, Xingimaging, and Likeminds. He has equity in Invicro. No other potential conflict of interest relevant to this article was reported.
ACKNOWLEDGMENT
The author acknowledges useful discussions with Dr. Ken Marek and the leadership team of the Parkinson’s Progression Markers Initiative and with Dr. Roger Gunn and the Invicro Clinical Imaging Core Lab.
Footnotes
Published online Oct. 27, 2022.
- © 2023 by the Society of Nuclear Medicine and Molecular Imaging.
REFERENCES
- Received for publication August 7, 2022.
- Revision received September 28, 2022.
In this issue


Jump to section
- Article
- Abstract
- THE CHALLENGE OF DEVELOPING DRUGS FOR NEURODEGENERATIVE DISORDERS
- DEVELOPING IMAGING BIOMARKERS
- ISSUES AND CONTROVERSIES
- QUANTITATIVE PET OUTCOME MEASURES
- PET VISUAL READS
- CORRELATION WITH CLINICAL MEASURES
- COMPLEMENTARITY AND INTEGRATION OF BIOMARKERS IN CLINICAL TRIALS
- FUTURE OUTLOOK AND RELEVANCE TO CLINICAL PRACTICE
- DISCLOSURE
- ACKNOWLEDGMENT
- Footnotes
- REFERENCES
- Figures & Data
- Info & Metrics