


Abstract
The ability to noninvasively measure endogenous pancreatic β-cell mass (BCM) would accelerate research on the pathophysiology of diabetes and revolutionize the preclinical development of new treatments, the clinical assessment of therapeutic efficacy, and the early diagnosis and subsequent monitoring of disease progression. The vesicular monoamine transporter type 2 (VMAT2) is coexpressed with insulin in β-cells and represents a promising target for BCM imaging. Methods: We evaluated the VMAT2 radiotracer 18F-fluoropropyl-dihydrotetrabenazine (18F-FP-(+)-DTBZ, also known as 18F-AV-133) for quantitative PET of BCM in healthy control subjects and patients with type 1 diabetes mellitus. Standardized uptake value was calculated as the net tracer uptake in the pancreas normalized by injected dose and body weight. Total volume of distribution, the equilibrium ratio of tracer concentration in tissue relative to plasma, was estimated by kinetic modeling with arterial input functions. Binding potential, the steady-state ratio of specific binding to nondisplaceable uptake, was calculated using the renal cortex as a reference tissue devoid of specific VMAT2 binding. Results: Mean pancreatic standardized uptake value, total volume of distribution, and binding potential were reduced by 38%, 20%, and 40%, respectively, in type 1 diabetes mellitus. The radiotracer binding parameters correlated with insulin secretion capacity as determined by arginine-stimulus tests. Group differences and correlations with β-cell function were enhanced for total pancreas binding parameters that accounted for tracer binding density and organ volume. Conclusion: These findings demonstrate that quantitative evaluation of islet β-cell density and aggregate BCM can be performed clinically with 18F-FP-(+)-DTBZ PET.
The lack of robust methods for noninvasive imaging of endogenous pancreatic islet β-cell mass (BCM) hampers the development of treatments to prevent or reverse the loss of BCM in type 1 diabetes mellitus (T1DM). Strategies for imaging BCM by PET and SPECT using radiotracers targeted to β-cell–specific binding sites have been explored (1–9). Of the radioligands identified to date, only those targeting vesicular monoamine transporter type 2 (VMAT2) have warranted phase 1 clinical evaluation for quantitative imaging of BCM in humans (5–9).
VMAT2 is responsible for the storage and release of monoamines such as dopamine, norepinephrine, and serotonin in the transport vesicles of synaptic terminals of monoaminergic neurons (10,11). VMAT2 alterations in the brain associated with Parkinson disease have been successfully studied using PET of 11C-dihydrotetrabenazine (11C-DTBZ) binding to VMAT2 (12,13). VMAT2 has also been found to be coexpressed with insulin in pancreatic β-cells (14–16). Preclinical PET studies in rodents demonstrated diminished pancreatic binding of 11C-DTBZ and its 18F-labeled fluoropropyl derivative, 18F-FP-(+)-DTBZ (Avid Radiopharmaceuticals) (also known as 18F-AV-133), in concert with depletion of BCM (7,8,17). A recent PET study in humans showed a correlative reduction in 11C-DTBZ binding in the pancreas in type 1 diabetic (T1DM) patients as compared with healthy controls (9). The modest reduction in pancreatic binding potential in the C peptide–negative T1DM subjects and significant background binding of 11C-DTBZ compromised its efficacy as a diagnostic tool to evaluate the effectiveness of therapies designed to slow or reverse loss of BCM.
The enhanced binding affinity of 18F-FP-(+)-DTBZ at VMAT2 (∼8-fold lower inhibition constant than for 11C-DTBZ) led us to hypothesize that 18F-FP-(+)-DTBZ would exhibit a substantial improvement in its dynamic range for quantitative PET of BCM. Here, we combined measurements from 18F-FP-(+)-DTBZ PET and arginine stimulus tests to assess pancreatic BCM in vivo and determine its relationship to insulin secretion capacity. Arterial blood data collected during PET were analyzed to determine the time course of the radioligand concentration in plasma for tracer kinetic modeling of regional time–activity curves. Analysis with a compartmental model yielded the volume of distribution (VT), a quantity that reflects the equilibrium concentration of the tracer in tissue relative to the amount available in the plasma. Using VT in the kidney as a measure of nonspecific uptake, we calculated binding potential (BPND), an index of specific binding (18), in total pancreas and the head, body, and tail subregions of the organ. The tracer binding parameters VT and BPND were found to correlate with insulin secretion capacity as determined from arginine stimulus tests, demonstrating the relationship between 18F-FP-(+)-DTBZ binding in the pancreas and β-cell function. Correcting binding parameters by pancreas volume determined by MRI yielded a measure of total BCM, which exhibited even greater group differences in tracer binding and more pronounced correlation with insulin secretion capacity. Our results indicate that 18F-FP-(+)-DTBZ can clearly discern the loss of BCM in T1DM subjects and is likely to be highly useful for longitudinal studies to evaluate preservation of BCM in diabetic subjects after treatment.
MATERIALS AND METHODS
Subjects
The protocol was approved by the Yale University Human Investigation Committee. Each subject provided written informed consent after the purpose, nature, and potential complications of the studies were explained and before their participation in the experiments. The studies were conducted according to the principles expressed in the Declaration of Helsinki.
Men and women between the ages of 18 and 55 y were recruited from the New Haven community by local advertisement. From this recruitment, we sequentially studied 16 subjects. Patients with T1DM as defined by criteria of the American Diabetes Association were screened. Enrolled participants had a duration of diabetes of more than 9 y, had a fasting C peptide level of 0.1 ng⋅mL−1 or less, and a body mass index (BMI) between 21 and 29 kg⋅m−2. Healthy volunteers matched for age and BMI with no history of type 1 diabetes, with a fasting blood glucose level of 100 mg⋅dL−1 or less, and who tested negatively for islet autoantibodies were enrolled. Relevant demographics and laboratory results are highlighted in Table 1.
Demographic and Laboratory Data
β-Cell Function: Arginine and Glucose-Glucagon Stimulus Tests
β-cell function was determined by measuring the serum C peptide response after a bolus injection of arginine. All subjects were studied as outpatients after an overnight fast. T1DM subjects were instructed to not take their usual morning insulin dose. Two antecubital venous catheters were inserted, one for arginine injection and the other for collection of fasting blood samples to determine the levels of glucose, C peptide, and other hormones. A bolus injection of 5 g of 10% arginine–hydrochloride in phosphate-buffered saline was infused over 1 min. Blood samples were collected at 0, 3, 4, 5, and 6 min.
In a select group of subjects (n = 4 for controls and n = 3 for T1DM patients), functional β-cell responses were evaluated using a 2-phase glucose clamp, followed by a glucagon stimulation test, modified from the methods of Keymeulen et al. (19). This methodology was chosen to give maximal β-cell stimulation to detect any residual β-cell function in the T1DM subjects that was not identifiable in the acute arginine stimulus test. Glucose levels were maintained between 90 and 100 mg⋅dL−1 for the first phase of the clamp (0–90 min). During the second phase (90–210 min), glucose levels were increased to 300 mg⋅dL−1 as described by DeFronzo et al. (20) and subsequently maintained between 300 and 350 mg⋅dL−1. At 210 min, 1 mg of glucagon was given intravenously. C peptide measurements were obtained at 0, 150, 180, 210, 212, 213, 214, and 215 min.
For both the arginine and glucagon challenge paradigms, plasma glucose concentrations were measured using an YSI STAT 2700 analyzer, and plasma C peptide samples were analyzed using a double-antibody immunoassay (Siemens Healthcare Diagnostics).
MRI
An MR image of the trunk was acquired for each subject using a Sonata 1.5-T instrument (Siemens) (multi–breath-hold T1-weighted acquisition; field of view, 38.0 × 38.0 cm; matrix, 256 × 256; in-plane resolution; 1.48 mm; contiguous slices, 50; and slice thickness, 5 mm). The pancreas was identified interactively using the BioImage Suite software package (21). The segmentation map was summed to determine total volume of the pancreas for each subject.
PET
All subjects were studied after an overnight fast. Type 1 diabetic subjects were instructed to not take their usual morning insulin dose. A radial arterial catheter was inserted for blood sampling, and an antecubital venous catheter was inserted for radiotracer infusion. When warranted, a second venous catheter was placed for the infusion of glucose in the diabetic subjects. Blood glucose was measured at 30-min intervals, and insulin dosage (via injection or insulin pump rate) or glucose infusions were adjusted as needed to maintain euglycemia in the diabetic subjects. Heart rate, blood pressure, and electrocardiogram were monitored continuously throughout the imaging procedure.
Subjects were scanned using an ECAT EXACT HR+ PET camera (CTI/Siemens) with reconstructed spatial resolution of approximately 6 mm (22). Data acquisition occurred over a period of up to 360 min, with breaks of approximately 30-min duration at 120 and 240 min. Transmission scans at each of 3 bed positions were acquired at the beginning of each session. Dynamic PET measurements were acquired in 2-dimensional mode, cycling between 3 sequential bed positions that covered a 420-mm axial field of view over the abdomen. 18F-FP-(+)-DTBZ (348 ± 30 MBq) was administered as a slow bolus over 5 min immediately after the start of the scan. The specific activity of 18F-FP-(+)-DTBZ at the time of injection was 29.2 ± 9.7 MBq⋅nmol−1. There were no differences between control and T1DM subjects in injected radioactivity (342 ± 35 vs. 356 ± 23 MBq, P = 0.36) or mass (7.57 ± 3.70 vs. 7.34 ± 1.77 nmol, P = 0.88). PET images were reconstructed using an ordered-subsets expectation maximization (16 subsets, 2 iterations) algorithm with corrections for scatter, attenuation, scanner dead time, detector normalization, and radioactive decay. Final images had 2.57-mm isotropic voxels of dimension 256 × 256 × 163.
Arterial Input Function Measurement
Arterial cannulation was successfully performed in 6 T1DM patients and 8 healthy controls. For these subjects, radioactivity concentration in arterial blood was measured continuously using an integrated peristaltic pump and calibrated radioactivity detector (PBS101; Veenstra Instruments) for the first 10 min after radiotracer administration, with 1 discrete sample manually obtained at 7 min. Serial samples were collected manually thereafter, with progressively increasing duration between blood draws. Manual samples were measured on a γ-counter to determine radioactivity concentration in whole blood and centrifuged to determine plasma radioactivity concentration. The whole-blood plasma ratio was determined and applied to scale the continuous whole-blood concentration data measured by the continuous blood counter used at the beginning of the scan.
Arterial samples collected at 7, 12, 20, 30, 45, 60, 90, 120, 180, and 240 min after injection were analyzed for the fraction of unchanged 18F-FP-(+)-DTBZ and its metabolites using a column-switching high-performance liquid chromatography (HPLC) assay (23). The supernatant plasma samples were obtained through centrifuging ethylenediaminetetraacetic acid whole-blood samples at 2,300g at 4°C for 5 min. Clear plasma mixture with urea at a final concentration of 8 M was then filtered through a 0.45-μm Millipore Millex-HA syringe filter. Activity in the filtrated plasma sample and the filter was counted with the automatic PerkinElmer γ-well-counter for obtaining the sample recovery rate and extraction efficiency. Up to 5 mL of the plasma sample were loaded onto the self-packed capture column with Phenomenex SPE C18 Strata-X sorbent with 1% acetonitrile water at 2 mL⋅min−1. The analytic mobile phase, designated 60:40 0.1 M ammonium formate:acetonitrile at 1.5 mL⋅min−1, coupled with a Phenomenex Luna C18 analytic column (250 × 4.6 mm, 5 μm) gave the FP-(+)-DTBZ parent compound retention time at 10 min. All the HPLC eluent was fraction-collected by an automated Spectrum Chromatography CF-1 fraction collection device. The unmetabolized parent fraction was calculated as the ratio of the sum of radioactivity in fractions containing the parent compound to the total amount of radioactivity collected. The fraction curve was also corrected by the time-varying extraction efficiency of radioactivity in the corresponding filtered plasma sample. The arterial input function used for kinetic modeling was calculated as the product of the total plasma curve and the parent fraction curve.
The fraction of tracer unbound to plasma proteins was determined by ultrafiltration. Six milliliters of arterial blood taken immediately before radiotracer injection were spiked with approximately 370 kBq of 18F-FP-(+)-DTBZ in a volume no greater than 0.2 mL. After 10 min of incubation at room temperature, the spiked blood sample was centrifuged at 2,300g for 5 min. Three replications of 0.2 mL of spiked plasma (supernatant) were counted with the automatic γ-counter. Spiked plasma (0.3 mL) was loaded onto the reservoir of the Millipore Centrifree micropartition devices in triplicate and centrifuged at 1,100g for 20 min. The pass-through unbound 18F-FP-(+)-DTBZ was then collected and counted. The percentage of free fraction was calculated using the following equation: (radioactivity of unbound 18F-FP-(+)-DTBZ)/(total radioactivity in plasma) × 100%.
Kinetic Modeling of PET Data
Summed radioactivity images were generated from each PET acquisition (session 1, 0 through 1.5–2 h; session 2, 2.5 through 3.5–4 h; and session 3, 4.5 through 5.5–6 h). Regions of interest (ROIs) for the pancreas (including the head, body, and tail subregions) were manually delineated on the summed images from all acquisition sessions using the abdominal MR image to guide and confirm placement. ROIs for the kidney were placed on the summed image from the first but not the second or third PET sessions because the renal cortex was not clearly discernible in the summed images from the later PET acquisitions. Radioactivity concentration in each ROI was extracted from the dynamic PET data to generate regional time–activity curves. High, sustained uptake of 18F-FP-(+)-DTBZ was observed in the pancreas, with concentration in the head > tail ≥ body. Kinetics in the renal cortex showed fast uptake with rapid washout. Compartment models using the arterial input function were applied to each time–activity curve to estimate the VT, an index of total tracer uptake relative to arterial plasma concentration (18). The complexity of the compartment model was determined by the quality of the model fits to the data. Time–activity curves from the pancreas were modeled adequately by a model with a 1-tissue compartment for 5 subjects; the remaining datasets were fitted well by a 2-tissue model. Stable estimates of pancreatic VT were typically achieved from 150 min of data, with shorter datasets generally yielding lower VT values. Results from kinetic modeling of pancreas time–activity curves reported in this manuscript are from 210 to 217 min of data, with the exception of 1 control subject for whom only 160 min of data were acquired. Time–activity curves from the kidney cortex were well described by a 2-tissue model. Estimates of renal VT obtained from the first scan session (from injection to 90–120 min) were reliable and used as an index of nondisplaceable uptake for calculation of pancreatic BPND, the equilibrium ratio of specific to nondisplaceable tracer concentration (18), as has been done previously with 11C-DTBZ (9).
Measurement of Radiometabolites in Pancreas of Nonhuman Primate
An 18F-FP-(+)-DTBZ study was performed on a male rhesus macaque (age, 8.2 y; weight, 8.78 kg) to characterize the radioactivity in the pancreas with respect to the fractions of parent compound and radioactive metabolites. All study procedures were performed under a protocol approved by the Yale University Institutional Care and Use Committee. The animal was sedated with an intramuscular injection of ketamine hydrochloride and glycopyrrolate. The animal was transported to the PET facility and was intubated and maintained on oxygen and 2.0% isoflurane throughout the study. A catheter was placed for the delivery of intravenous fluids and bolus injection of the tracer. A percutaneous arterial line was placed for the collection of blood samples. A 3-min bolus of 154 MBq of 18F-FP-(+)-DTBZ was given. Shortly before the end of the study, a blood sample was taken for plasma radioactivity analysis. While still under isoflurane anesthesia, the animal was euthanized 130 min after tracer injection with 3.0 mL of pentobarbital sodium and phenytoin sodium (Euthasol; Virbac Animal Health) via the saphenous vein. Death was verified by the cessation of heartbeat. The animal was transported to a procedure room for the collection of tissues. Four parts of pancreas tissue, including the head, neck, body, and tail, were first homogenized and denatured with an equivalent volume of ethanol, followed by a half amount of saline rinse, and then the mixtures were centrifuged for 10 min at 14,000 rpm to precipitate proteins. Activity in the supernatant from the pancreas tissue was monitored, and up to 1.0 mL of sample was injected onto the reversed-phase HPLC analytic system with a retention time of the parent compound at 8 min. All the HPLC eluent was fraction-collected with an automated device (CF-1 Fraction Collector; Spectrum Chromatography) at 2-min intervals and counted with the aforementioned automatic γ-counter. The counts of fractions were volume- and decay-corrected. The 18F-FP-(+)-DTBZ metabolite profile in plasma and pancreas was calculated as the ratio of the sum of radioactivity in the fraction containing the parent compound to the total amount of radioactivity collected.
Statistical Analysis
Quantitative results are presented as the mean value ± SD unless otherwise noted. Differences between groups were analyzed using a 2-tailed t test with heteroscedastic variance. The relationships between mean pancreatic PET binding parameters and β-cell function as measured by the arginine stimulus test were assessed using the Pearson correlation coefficient. All tests were performed using Prism 5 (GraphPad Software). A P value of less than 0.05 was considered statistically significant.
RESULTS
Measures of β-Cell Function
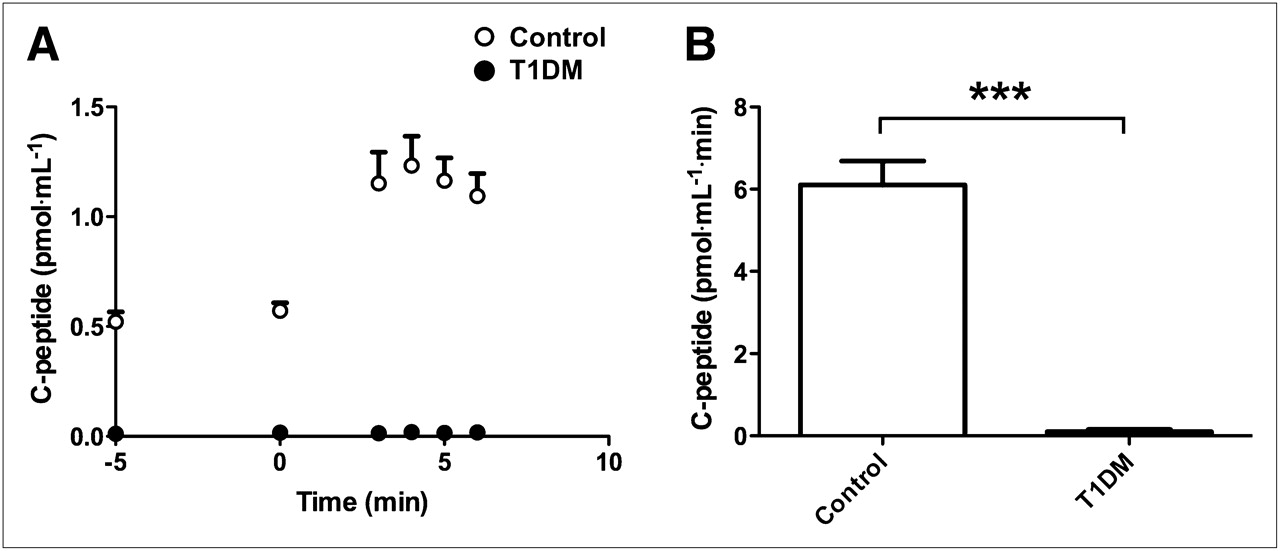
The time course and cumulative amounts of circulating C peptide levels released after arginine administration are shown in Figure 1. Arginine stimulus induced significantly less C peptide (0.117 ± 0.161 vs. 6.25 ± 1.72 pmol⋅mL−1⋅min, P < 0.001) in T1DM patients than controls, evidencing loss of β-cell function in the disease state.

C peptide release as indicator of β-cell function assessed by arginine stimulus test. (A) Circulating levels of C peptide released in response to arginine administration were greater in control subjects (n = 8) than diabetic patients (n = 7), as were areas under curve (B). Data are expressed as mean ± SEM. Error bars represent SEM. **P < 0.01. ***P < 0.005.
In the subset of subjects who underwent hyperglycemic-glucagon stimulation tests (19,20), glucose levels were higher in the T1DM group in the first 30 min during the commencement of insulin infusion but were stable with no statistical difference between the groups for the last 45 min of the euglycemic and hyperglycemic phase of the clamp (Supplemental Fig. 1A; supplemental materials are available online only at http://jnm.snmjournals.org). The C peptide responses in healthy volunteers gradually increased throughout the glucose clamp (Supplemental Fig. 1B). The peak response was seen at 214 min (4 min after the glucagon bolus). The C peptide response in subjects with type 1 diabetes was undetectable both during the clamp and after glucagon administration. These results confirm the absence of functional BCM in the T1DM subjects.
Arterial Blood Measurements
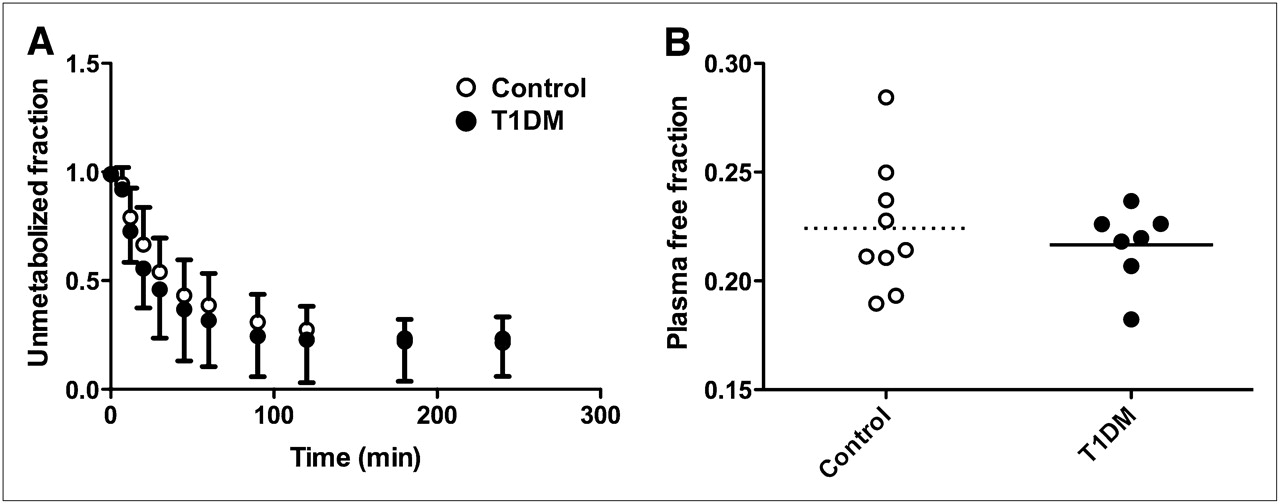
18F-FP-(+)-DTBZ showed a moderate rate of metabolism and clearance, with approximately 50% of the total plasma radioactivity attributable to radiometabolites at 30 min after injection (Fig. 2A). The plasma parent fraction did not differ significantly between groups at any time after injection. The plasma free fraction had low intersubject variability (11.2% coefficient of variation) and did not differ between patient groups (22.4% ± 3.0% in controls vs. 21.7% ± 1.7% in T1DM subjects, P = 0.53; Fig. 2B).

Characteristics of 18F-FP-(+)-DTBZ metabolism and availability in arterial blood. (A) Fraction of radioactivity in plasma attributable to parent compound was not statistically different between groups (0.23 < P < 0.94 for t tests at each individual time point; P = 0.36 for 2-way ANOVA across time points common to all subjects). Data are expressed as mean ± SD. (B) Fraction of radiotracer unbound to plasma proteins did not differ between groups (0.224 ± 0.030 vs. 0.217 ± 0.018, P = 0.53). Horizontal lines represent mean for respective cohort.
Analysis of PET Image Data
Qualitative assessment of PET images showed a striking difference between control and diabetic subjects in pancreatic 18F-FP-(+)-DTBZ concentration, as seen in representative images shown in Figure 3 (images for all subjects are shown in Supplemental Fig. 2, and rotating maximum-intensity-projections are shown in Supplemental Videos 1–16). Concentration of radioactivity normalized by injected dose and body weight (standardized uptake value, or SUV) was significantly lower, by 37.7% (10.7 ± 2.6 vs. 17.2 ± 4.0, P = 0.002), in the pancreas of T1DM patients (n = 7) than in control subjects (n = 9) but did not differ in the kidney cortex (3.01 ± 0.34 vs. 2.90 ± 0.48, P = 0.60), as shown in Figure 4A.
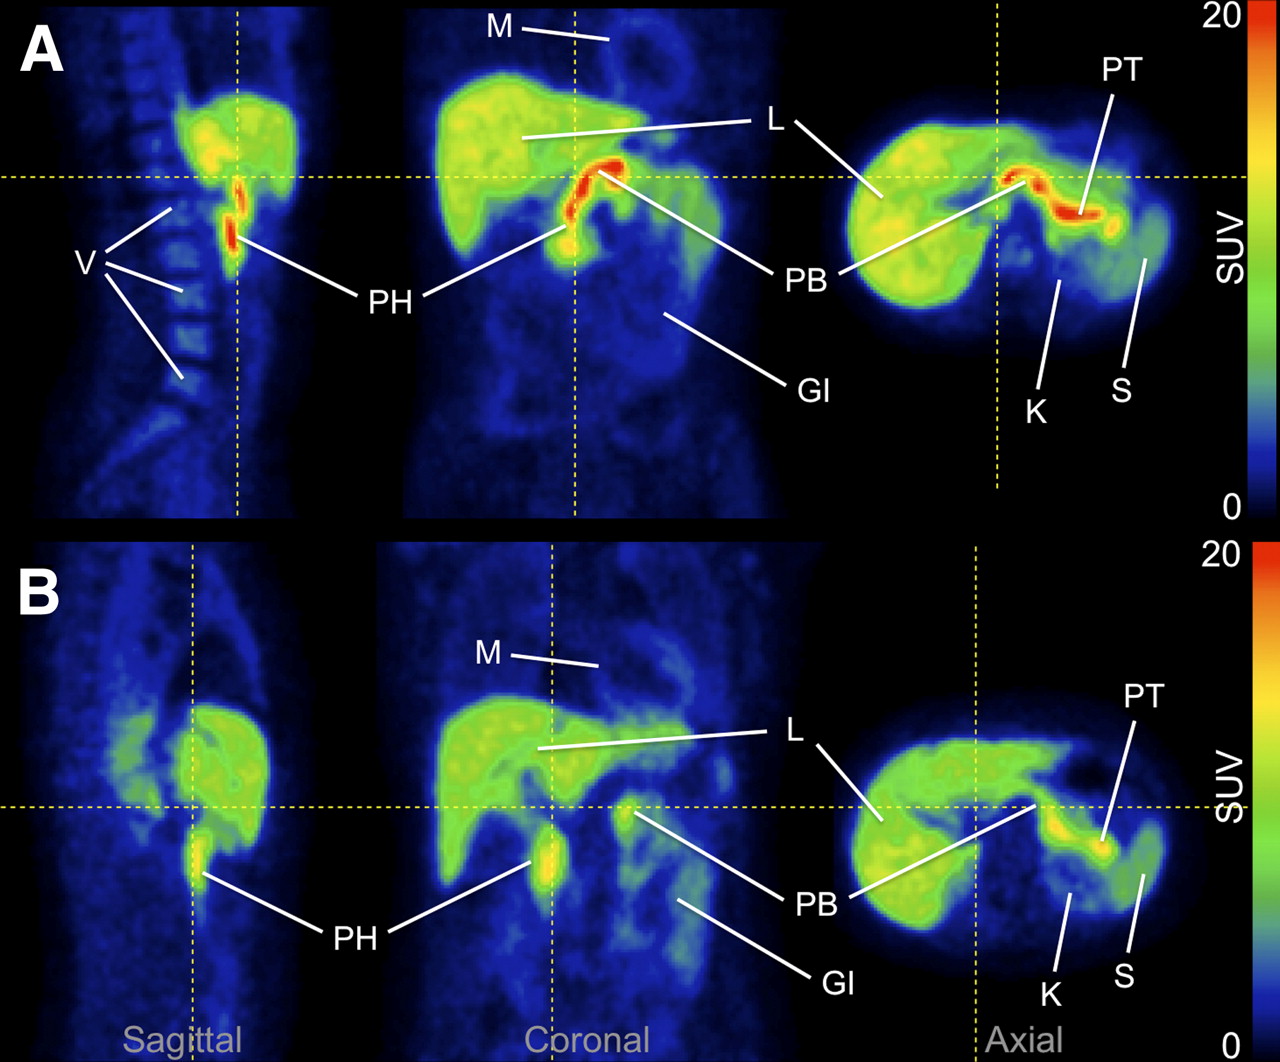
Representative 18F-FP-(+)-DTBZ PET images. (A) Image acquired for healthy control subject showed high uptake of tracer in pancreas. (B) Pancreas uptake was reduced in type 1 diabetes patient. Both images represent PET data summed from 0 to 90 min after injection and are displayed on common scale (0–20 SUV—that is, radioactivity normalized by injected dose and body weight). GI = gastrointestinal tract; K = kidney; L = liver; M = myocardium; PB = pancreas body; PH = pancreas head; PT = pancreas tail; S = spleen; V = vertebrae. Images for entire cohort are displayed in Supplemental Figure 2. Maximum-intensity-projection animations are shown in Supplemental Videos 1–16.

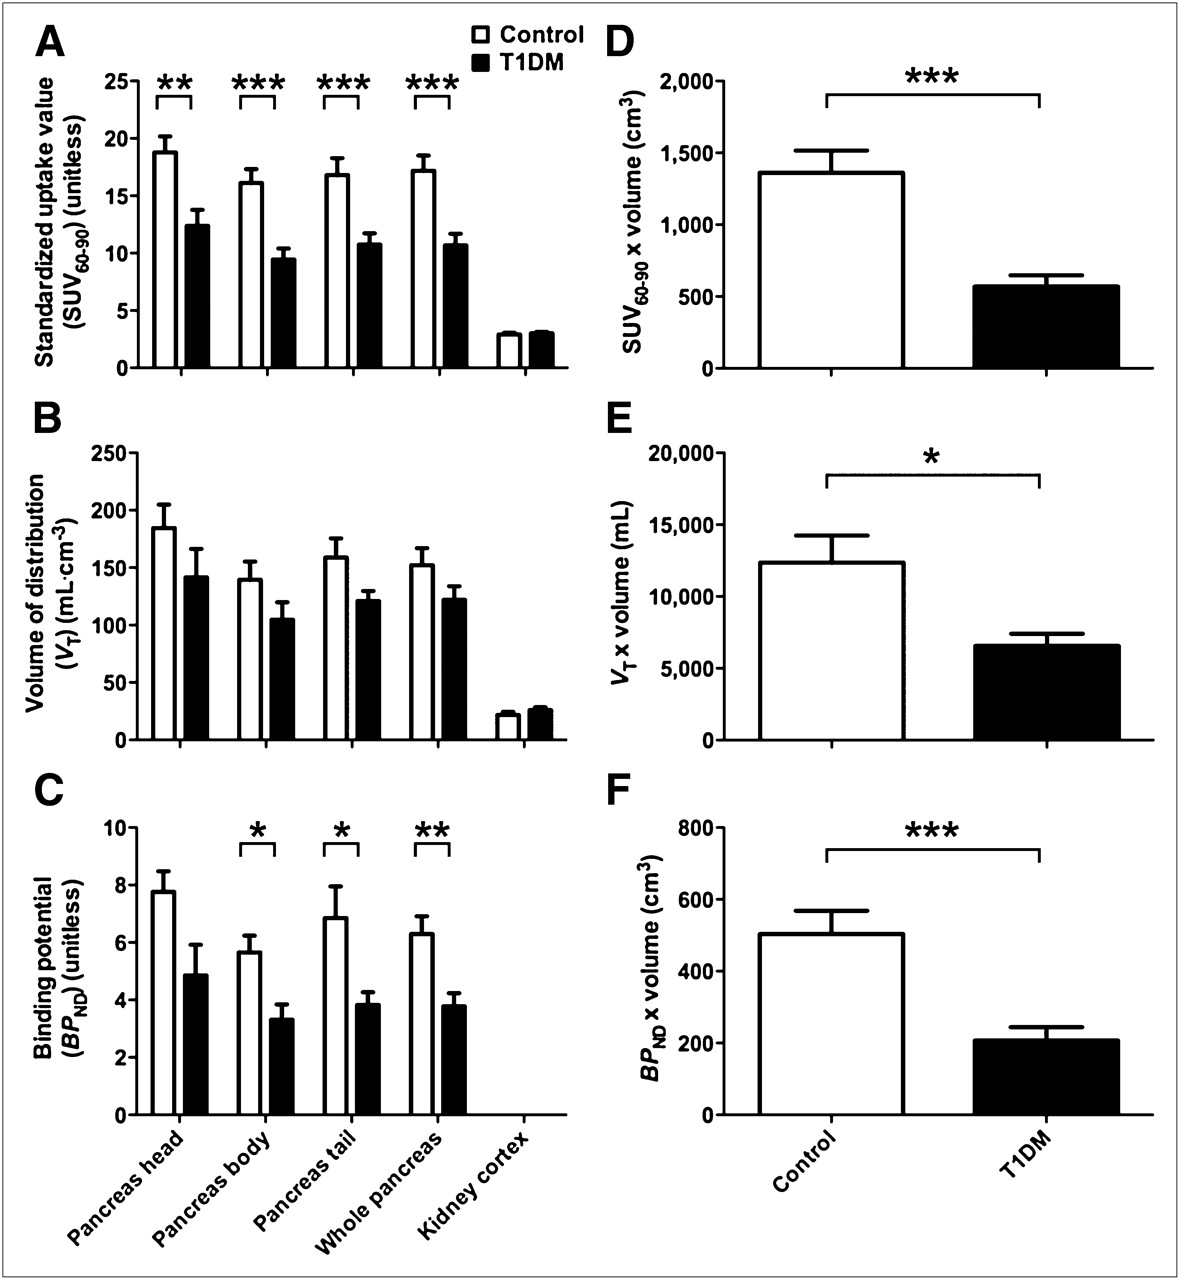
18F-FP-(+)-DTBZ binding was reduced in T1DM patients vs. healthy control subjects. (A) SUV60–90, concentration of tracer from 60 to 90 min normalized by injected dose and body weight, was significantly lower by 38% in pancreas of T1DM patients (n = 7) than controls (n = 9). No significant difference in kidney SUV60–90 was observed. (B) VT, which reflects total uptake and retention of tracer relative to arterial plasma, was estimated in subjects for whom arterial blood was measured (n = 8 controls, n = 6 T1DM subjects). VT was reduced by 20% in pancreas of T1DM subjects at trend level significance. VT in kidney cortex did not differ between groups. (C) BPND, which reflects tracer-specific binding using kidney VT as estimate of nondisplaceable uptake, was significantly lower (by 40%) in pancreas of T1DM patients than in pancreas of healthy subjects. (D–F) Group differences in PET binding parameters estimated from whole pancreas are accentuated after correction for pancreas volume, which provides a measure of total tracer binding reflecting aggregate BCM. Data are expressed as mean ± SEM *P < 0.05. **P < 0.01. ***P < 0.005.
Regional VT (reflecting total uptake of tracer relative to plasma) and pancreatic BPND (indicative of specific binding, compared with a reference region having only nondisplaceable uptake) are compared between groups (n = 8 controls, n = 6 T1DM subjects) in Figures 4B and 4C. Total tracer uptake per unit volume of whole pancreas was reduced by 19.8% in T1DM subjects, compared with controls at trend level significance (VT, 122 ± 40 in T1DM subjects vs. 152 ± 42 in controls, P = 0.14). The VT in the renal cortex was slightly elevated in T1DM subjects relative to controls but did not differ significantly between groups (P = 0.29). A significant reduction of pancreatic specific binding density was observed in diabetic patients, with mean group difference of 40.0% (BPND, 3.78 ± 1.13 in T1DM subjects vs. 6.30 ± 1.75 in controls, P < 0.01). It is improbable that these results reflect anything other than true tracer binding reductions in the pancreas of T1DM patients because groups were well matched in all regards except disease state (Table 1). Binding estimates showed some association with patient age and BMI (Supplemental Fig. 3). The statistical significance of group differences in tracer binding remained intact when age and BMI were included as covariates.
The PET binding parameters SUV, VT, and BPND are density metrics reflecting relative tracer concentrations per unit volume of tissue. To determine total tracer uptake in the pancreas, we multiplied the PET outcome parameters by the whole pancreas volume measured from anatomic MR images. Both absolute pancreas volume and pancreas volume normalized to body surface area (24) were significantly decreased in T1DM patients (Table 1). Scaling the binding parameters to account for pancreas volume enhanced the group differences in pancreatic uptake (Figs. 4D–4F). In particular, the 32% reduction in pancreas volume together with the 40% decrease in BPND gave a calculated 59% loss in total specific binding in the T1DM patients (207 ± 91 cm3 vs. 503 ± 183 cm3 in controls, P < 0.005; Fig. 4F).
Relationship Between Radiotracer Binding and β-Cell Function
The tracer binding parameters SUV, VT, and BPND were plotted against arginine-elicited C peptide release to assess the relationship between 18F-FP-(+)-DTBZ binding in the pancreas and β-cell function (Figs. 5A–5C). The significant correlations of tracer binding parameters with C peptide release suggest that not only does 18F-FP-(+)-DTBZ PET discriminate between healthy controls and T1DM subjects but also that PET binding measures quantitatively reflect β-cell function. Interestingly, the control subject that exhibited much lower BPND than others in the group was also found to have a blunted response to arginine stimulus, further supporting the association between 18F-FP-(+)-DTBZ binding and insulin secretory capacity. Extrapolating the tracer binding measures to reflect total binding within the entire pancreas by accounting for pancreas volume strengthened the correlations of the PET binding parameters, with C peptide released in response to the arginine stimulus (Figs. 5D–5F). If the relationship between tracer binding and β-cell function holds across populations (e.g., T2DM or recent-onset T1DM subjects), 18F-FP-(+)-DTBZ PET would be a valuable tool for prognostics, longitudinal studies in humans, or preclinical animal models for the development of therapeutic strategies or treatment monitoring.

Tracer binding density was associated with insulin secretory capacity. Pancreatic 18F-FP-(+)-DTBZ uptake and binding density parameters SUV (A), VT (B), and BPND (C) correlated positively with arginine-stimulated increases in circulating C peptide, a metric of β-cell function. Multiplying 18F-FP-(+)-DTBZ binding density parameters by pancreas volume to reflect total pancreatic binding improved their quantitative relationships with insulin secretory capacity (D–F).
Radiometabolites in Pancreas of Nonhuman Primate
HPLC analysis of the radioactivity in the pancreas from the nonhuman primate study revealed that 90%–93% of total radioactivity in the pancreas represented the unchanged 18F-FP-(+)-DTBZ, with no noticeable difference among 4 parts (head, neck, body, and tail). In the plasma sample acquired shortly before the end of the study, only 8% of the radioactivity was attributable to parent compound. Those metabolites detected in the pancreas appear to have a retention time similar to that for parts of nonpolar metabolites observed in the plasma. Thus, whereas there were significant radioactive metabolites in the plasma, these data suggest that uptake of radioactive metabolites into the pancreas in the nonhuman primate is minimal, which is an important assumption in the modeling methods used here.
DISCUSSION
18F-FP-(+)-DTBZ is a recently developed PET tracer that can be used for the quantitative measurement of endogenous pancreatic islet β-cell mass in humans. Pancreatic BPND, the tracer-specific binding per unit volume of tissue, was reduced by 40% (P < 0.01) in C peptide–negative T1DM patients, compared with healthy individuals matched for age and BMI. When atrophy of the T1DM pancreas was accounted for, we observed a 59% reduction in total 18F-FP-(+)-DTBZ binding in the pancreas. Moreover, 18F-FP-(+)-DTBZ binding potential correlated positively (R2 = 0.59, P = 0.002) with the insulin secretory capacity of β-cells as measured by an arginine challenge. This relationship was further enhanced by accounting for the pancreas volume to obtain total BCM binding (R2 = 0.78, P < 0.0001). These results indicate that PET of 18F-FP-(+)-DTBZ provides quantitative measures of pancreatic BCM. This noninvasive method is poised for use in interventional studies to prevent or reverse diabetes.
PET with 18F-FP-(+)-DTBZ yields measurements of endogenous BCM, in contrast to alternative methods that detect exogenous β-cells labeled before islet graft transplantation (25,26). Although the imaging of endogenous and exogenous BCM may prove complementary in clinical islet transplantation, quantitative measurements of endogenous BCM such as those provided by 18F-FP-(+)-DTBZ PET are necessary for the pursuit of other avenues in research and medical practice. The ability to noninvasively and quantitatively measure endogenous pancreatic islet β-cell mass is necessary to reach a clearer understanding of the pathophysiology of the islet β-cells before and after the onset of diabetes mellitus. In addition, the noninvasive measurement of innate BCM holds promise as a useful tool to monitor and test the efficacy of newly developed therapeutic approaches targeting preservation or restoration of healthy β-cell function. An appropriate insulin secretory response is ultimately dependent on β-cell capacity, which is determined by both the β-cell mass and its responsiveness to circulating metabolite and hormonal cues that stimulate insulin secretion. Current methods used to evaluate β-cell capacity are limited to those that measure insulin release in response to a mixed meal tolerance test, arginine or glucagon stimulation tests, or hyperglycemic clamps. All of these methodologies suffer from the uncertainty that the insulin secretory response can be modulated by factors such as recent glucose control, adolescence, adiposity, and insulin resistance. Consequently, these measures of β-cell function are unable to distinguish between a robust secretory response from a few islets and a weaker response from a greater number of islets. An assessment of β-cell capacity that can distinguish between mass and function would aid the development of treatments to enhance stimulated insulin secretion of patients with type 1 or type 2 diabetes.
The validity of VMAT2 as a target for β-cell imaging has been a topic of lively debate (27,28). In vitro experiments have yielded discrepant results, with some studies finding that VMAT2 density was highly colocalized with insulin expression (14–16), whereas others reported that total binding signal of VMAT2 ligands reflected mechanisms independent of BCM (29). Yet other histologic studies revealed that VMAT2 is expressed in pancreatic polypeptide cells outside islet β-cells and that 18F-FP-(+)-DTBZ binds saturably at a low-affinity non-VMAT2 site; however, VMAT2 expression and 18F-FP-(+)-DTBZ binding were still strongly correlated with β-cell density despite the contribution of background signal from off-target sites (30,31). Indeed, our own work using 11C-DTBZ and 18F-FP-(+)-DTBZ for in vivo imaging in rats found a significant correlation between VMAT2 binding and insulin expression even though a substantial specific binding signal remained after elimination of β-cells by streptozotocin administration (17). These findings are consistent with the present study in which we found significant quantitative relationships between 18F-FP-(+)-DTBZ binding and insulin secretory capacity despite the fact that T1DM patients exhibited residual pancreatic binding, which could be attributable to tracer binding at non–β-cell sites or residual β-cell mass (32). Although we cannot distinguish background binding due to a non-VMAT2 binding site distinct from the presence of VMAT2 outside β-cells, changes in nonspecific binding can be corrected by the use of an appropriate reference region. Studies in rats using 18F-FP-(+)-DTBZ blocked by the unlabeled compound and preliminary experiments in baboons using 18F-FP-(+)-DTBZ and its inactive enantiomer 18F-FP-(−)-DTBZ demonstrated that the kidney cortex is an appropriate reference tissue for measuring specific binding in the pancreas (17,33). In this study, we found no significant group differences in renal SUV or VT and used this region to calculate our specific binding outcomes, as has been done previously with 11C-DTBZ (9). The spleen has been suggested as an alternative reference tissue and when applied as such yielded overall outcome trends similar to the kidney but with reduced BPND estimates and increased variability. Although preliminary data in baboons show it to be a nonideal reference tissue (33), the spleen should be insensitive to diabetes-induced renal failure and, if further validated, might serve as an imperfect but practical reference region in clinical populations.
A potential limitation of imaging the pancreas with PET is the concept of partial-volume effect, which may lead to an underestimation of the radioactivity concentration measured in a small structure such as an individual islet or lung nodule (34). The PET signal measured in any given location is influenced by the spatial resolution of the scanner, compared with the size of the object being imaged, and the contrast of concentration in the tissue relative to its surroundings. The partial-volume effect describes the underestimation of radioactivity concentration in hot spots that suffer from spill-out of signal and overestimation in low-activity regions that are contaminated by spill-in from adjacent high-activity objects. However, as discussed by Ichise and Harris (28), PET of BCM is conceptually distinct from that of diagnostic imaging of lung nodules, for which partial-volume effects are important. The correction for partial-volume effects is needed for quantifying the tracer concentration in individual lung nodules, for which the goal is to distinguish between benign and malignant tumors. In contrast, the goal of quantifying BCM is not to determine the uptake within individual islets but to measure an integrated signal of 18F-FP-(+)-DTBZ within the pancreas. These studies are exactly analogous to the use of PET tracers for quantitative imaging of neuroreceptors, in which corrections for partial-volume effects are not necessary to determine the density of target sites in a given volume of tissue.
Nevertheless, our analysis methods were designed to minimize any potential partial-volume effects in the measurement of radioactivity concentration in the pancreas. The pancreas tends to be smaller in T1DM patients than in controls, a finding reported previously (24,35) and replicated in our MRI studies (Table 1). This atrophy could potentially lead to underestimation of pancreatic PET signal in T1DM subjects. As a precautionary measure, ROIs were drawn conservatively along the central axis of the pancreas to exclude voxels at the edge of the organ susceptible to signal spill-out. The cross-sectional width of pancreas ROIs rarely exceeded 2 voxels (5.1 mm) in the body and tail or 3 voxels (7.7 mm) in the head of the organ. Previous ultrasound (36) and CT (37) imaging studies reported typical pancreas diameters of 12–20 mm in the head and 9–14 mm in the body and tail of T1DM patients, with slightly greater values in control subjects. Respiratory motion further increases the effective size of the pancreas in our PET images. By comparison, the spatial resolution of reconstructed images from the HR+ PET camera is approximately 6 mm (22). Given the spatial resolution of the scanner, the effective size of the pancreas, and our intentional omission of pancreas voxels susceptible to signal spill-out, any errors introduced by partial-volume effects should be minor. Hence it is highly unlikely that the group differences observed in 18F-FP-(+)-DTBZ binding are attributable to bias induced by partial-volume effects.
CONCLUSION
The results reported here indicate that PET of 18F-FP-(+)-DTBZ can noninvasively and quantitatively measure clinically relevant changes in pancreatic BCM. We validated 18F-FP-(+)-DTBZ PET through quantitative imaging using kinetic modeling with arterial input functions and found markedly reduced 18F-FP-(+)-DTBZ binding density in patients with long-standing T1DM, compared with well-matched healthy controls. In comparison to 11C-DTBZ, 18F-FP-(+)-DTBZ had substantially improved the dynamic range of pancreatic binding parameters correlating with β-cell function, such that the functional loss of β-cell density in T1DM subjects was discernible without depending on anatomic differences in pancreas volume. When parameters indicative of total pancreatic binding were obtained, accounting for pancreas volume enhanced group differences in tracer binding and improved the quantitative relationship between the PET outcomes and insulin secretion capacity. These studies suggest that PET with 18F-FP-(+)-DTBZ can be used to quantify BCM and β-cell capacity when combined with assays of β-cell function. The present work and previous studies indicate that the kidney cortex is an appropriate reference tissue that lacks specific binding and exhibits small intersubject variability (9,17,33). The existence of such a reference region may obviate arterial blood sampling, thereby simplifying data analysis and reducing the cost, complexity, and invasiveness of the imaging procedure. Finally, compared with the half-life of 11C (20.4 min), the longer radioactive half-life of 18F (109.8 min) facilitates distribution of 18F-FP-(+)-DTBZ over wide geographic regions, as is currently done with 18F-FDG. The feasibility of centralized production will minimize costs and enable research trials or clinical applications at imaging centers that lack the radiochemistry infrastructure or expertise necessary to synthesize 18F-FP-(+)-DTBZ on-site.
DISCLOSURE STATEMENT
The costs of publication of this article were defrayed in part by the payment of page charges. Therefore, and solely to indicate this fact, this article is hereby marked “advertisement” in accordance with 18 USC section 1734.
Acknowledgments
This work was funded in part by the Yale-Pfizer Bioimaging Research Alliance; NIH UL1 RR024139, NIH R01 AG-23686, and NIH T32 DA022975; and a Distinguished Clinical Scientist Award from the American Diabetes Association (KFP). Expert technical assistance was provided by the staff of Avid Radiopharmaceuticals, the Yale PET Center, Yale Magnetic Resonance Research Center, and the Yale Center for Clinical Investigation. Timothy J. McCarthy, Roberto A. Calle, and Judith L. Treadway are employees of Pfizer, which provided funding for the experiments through the Yale-Pfizer Bioimaging Alliance. Daniel M. Skovronsky is an employee of Avid Radiopharmaceuticals, which provided the PET radiotracer. No other potential conflict of interest relevant to this article was reported.
Footnotes
Published online May 9, 2012.
- © 2012 by the Society of Nuclear Medicine, Inc.
REFERENCES
- Received for publication November 8, 2011.
- Accepted for publication January 31, 2012.


Jump to section
Related Articles
Cited By...
- Optoacoustic Imaging of Glucagon-like Peptide-1 Receptor with a Near-Infrared Exendin-4 Analog
- Optoacoustic imaging of GLP-1 Receptor with a near-infrared exendin-4 analog
- Validation of 111In-Exendin SPECT for the Determination of the {beta}-Cell Mass in BioBreeding Diabetes-Prone Rats
- Respiratory Motion Compensation for PET/CT with Motion Information Derived from Matched Attenuation-Corrected Gated PET Data
- Evaluation of PET Brain Radioligands for Imaging Pancreatic {beta}-Cell Mass: Potential Utility of 11C-(+)-PHNO
- Event-by-Event Continuous Respiratory Motion Correction for Dynamic PET Imaging
- Pancreatic hyperplasia after gastric bypass surgery in a GK rat model of non-obese type 2 diabetes
- Positron Emission Tomography Ligand [11C]5-Hydroxy-Tryptophan Can Be Used as a Surrogate Marker for the Human Endocrine Pancreas