


Abstract
PET scanners with an elongated axial field of view intended to increase overall system sensitivity, such as the high-resolution research tomograph (HRRT) scanner, have been reported to produce images with decreased signals in the brain stem and cerebellum. The cause of this negative bias of the images was analyzed, and the effects of an inaccurate linear attenuation coefficient (μ-value) of tissue and bones were separately examined. Methods: A new phantom was manufactured, and 18 human subjects were recruited for the study. 18F-FDG PET images were reconstructed using attenuation coefficient maps generated by various algorithms. The algorithms included maximum a posteriori reconstruction for transmission data (MAP-TR) with default priors, MAP-TR with adjusted priors for bone (MAP-TRadj-b), MAP-TR with adjusted priors for tissue (MAP-TRadj-t), and noise-equivalent count TR and CT-TR. Results: With the CT-TR and MAP-TRadj-t algorithms, increased intensity in the brain stem and cerebellum was seen, and negative bias was reduced. With the MAP-TRadj-t algorithm, however, positive bias increased in the central region. Inappropriate attenuation coefficients of brain tissue increased the positive or negative bias of reconstructed images, especially for the central regions of the volume. Poor representation of the skull or bone also locally increased the bias in the near regions where bone detection had failed. Conclusion: An inaccurate μ-map obtained from the MAP-TR algorithm caused the bias problem for the HRRT system. The CT-TR algorithm provided a relatively more reliable μ-map that demonstrated a small degree of intensity bias. Appropriate priors for μ-values of each tissue compartment and better classification to distinguish bone from tissue are necessary for accurate attenuation correction.
Since the emergence of PET (1,2) in medical imaging, great advances in the performance of the modality have been made continuously to observe the nature of brain activity in vivo with sufficient resolution and sensitivity. The development of new detector materials with better characteristics, such as stopping power and light output, has resulted in the fundamental improvement of PET systems. Bismuth germanate and lutetium oxyorthosilicate (3) are representative detector materials that are currently used. A decreased detector width and gantry diameter have enhanced the spatial resolution and the sensitivity, respectively, of the PET systems. Furthermore, a 3-dimensional (3D) PET scanner, which collects additional oblique lines of response by removing septa between the rings, has been proposed and implemented to increase system sensitivity (4). The most advanced commercial 3D PET scanner is the high-resolution research tomograph (HRRT; CTI/Siemens) dedicated to brain research. This state-of-the-art PET scanner can achieve spatial resolution as high as 2.5 mm (5), as expected by the use of small detectors. A small ring diameter and a long axial field of view (FOV) maximize the sensitivity for brain imaging.
Despite the advancements, the HRRT still has some limitations, including increased scatter, which is the typical problem with the 3D scanners (6). In addition, relatively lower signal intensity in the cerebellum and brain stem was recently reported by some HRRT users. This lower signal intensity has been described in the Alzheimer's Disease Neuroimaging Initiative PET Core documents by Robert Koeppe in which the pons was reported to show an intensity approximately 12% lower than the global mean (http://www.loni.ucla.edu/twiki/bin/view/ADNI/ADNIPETCore). Koeppe has postulated that the possible cause of this problem is related to scatter correction or attenuation correction incorporated with the HRRT.
Recently developed PET/CT scanners can provide better μ-maps in terms of spatial resolution and signal-to-noise ratio among commercial PET systems by using CT images. μ-values have nonlinear characteristics when converting the μ-values measured with the low energy of x-rays to the 511 keV of PET. The relationship of these energy-dependent μ-values was approximated to the bilinear model, and this approximation has been successfully applied for the attenuation correction of PET/CT. Radionuclide-based transmission data, such as with 68Ge or 137Cs, have less or no energy-dependent limitation, but the μ-map quality is much poorer. This poor μ-map quality becomes worse as the scanning time of the transmission data becomes shorter. With a decreased detector size for higher resolution such as with the HRRT, the counting rate of each detector severely drops. To overcome a poor counting rate or signal-to-noise ratio of a μ-map for the HRRT, the maximum a posteriori reconstruction algorithm for transmission data (MAP-TR) has been adopted. MAP-TR is a Bayesian reconstruction algorithm for transmission data with predefined smoothness and intensity priors, such as for air, cavity, tissue, and bone (7). However, van Velden et al. (8) reported that default priors in the HRRT system resulted in a thicker skull on the μ-map, and this situation might result in an incorrect attenuation correction. van Velden et al. (8) recommended MAP-TR with newly adjusted priors of bone (MAP-TRadj-b) and noise-equivalent count (NEC)–TR with segmentation as the transmission reconstruction algorithms for the HRRT. NEC-TR applies NEC scaling to the measured blank over transmission sinogram data to restore pseudo-Poisson distribution (9). With these algorithms, the skull on the μ-map became thinner, but the 2 algorithms could not solve the intensity drop in the lower region and the underlying cause of the problem was not clearly identified. More recently, an HRRT user group developed a new transmission reconstruction algorithm that considered the scattering effect of the transmission data. The algorithm, however, will not be evaluated in this article because it has not been published yet.
The μ-values used for the brain in many PET studies have, interestingly, varied in a range from 0.095 to 0.099 cm−1 (10,11). The theoretic μ-value for brain tissue has been reported as 0.0994 cm−1 at 511 keV according to an International Commission on Radiation Units and Measurements report (12). However, the HRRT uses 0.096 cm−1 as a default prior for brain tissue.
In the current study, the effects of defective μ-maps on image intensity were analyzed separately for bone and brain tissue components. Transmission reconstruction methods originally incorporated with the HRRT system and modified priors were evaluated and were quantitatively compared for a newly designed phantom and for human subjects. A PET/CT system was used to provide reference images to compare the intensity of the negative bias. A long transmission scan with positron emission sources provides a better reference image than does a CT transmission scan, but long radioactive exposure for human subjects limits the scanning. We, therefore, assumed that despite the possible conversion errors between CT Hounsfield units to 511-keV μ-values depending on the materials, the expected error is negligible in human scanning.
MATERIALS AND METHODS
HRRT PET and PET/CT systems were used for the study. Detailed descriptions of the 2 systems are given in Supplemental Table 1 (supplemental materials are available online only at http://jnm.snmjournals.org).
Phantom and Subjects
Neuroscience Research Institute (NRI) Attenuation Phantom
To evaluate the attenuation-correction methods quantitatively, we designed and manufactured a new attenuation phantom. The basic design of the phantom was motivated by the μ-map of the human skull, of which some structures in the lower part are not represented on the μ-map. Teflon (DuPont) was chosen as the material for the outer shell, to represent an artificial skull. Although it has been reported that the bilinear method used for PET/CT does not work appropriately for Teflon (13), Teflon has the closest μ-value to the skull among the available materials at the energy level for both x-rays and γ-rays. The outer shell has 2 different thicknesses. For the hemispheric part, the skull was made thicker and the base was made thinner; for the cylindric part, the front was made thinner and the back was made thicker (Supplemental Fig. 1). This design reflects the detectable and undetectable parts among the bones for the transmission data.
Human Subjects
Data for 18 subjects were used for this study. All subjects were men who did not have a neurologic disease. Nine subjects were scanned with the PET/CT system, and 9 subjects were scanned with the HRRT. For the subjects scanned with HRRT, CT images were shortly acquired for the transmission data using PET/CT. All procedures were approved by the Internal Review Board of Gachon University of Medicine and Science.
Transmission Data Acquisition and Reconstruction
Transmission scanning was performed using a typical human brain-scanning protocol (Supplemental Table 2).
The representative 4 transmission reconstruction algorithms implemented in the HRRT system and the bilinear transformation CT method were compared (NEC-TR with segmentation, MAP-TR with default priors [MAP-TRdef], MAP-TRadj-b, and MAP-TR with adjusted tissue priors [MAP-TRadj-t] and CT-based μ-map [CT-TR]).
The reconstruction parameters for the radionuclide-based transmission are described in Supplemental Table 3. HRRT with the MAP-TR algorithm used the scaling methods to adjust the biased attenuation coefficients due to the different energy of 137Cs at 662 keV (supplemental materials). CT-TR was prepared by homemade software converting the Hounsfield units of CT to the μ-value at 511 keV. A single CT energy–scaling method based on bilinear transformation (14) was used. The converted CT-based μ-map was coregistered onto the 137Cs-based μ-map reconstructed by the MAP-TR algorithm using the Vinci software (Max-Planck Institute). Six-parameter rigid-body affine transformation was used for the coregistration, and mutual information was selected as the similarity measurement. To match the resolution of the CT-based μ-map with the HRRT image, smoothing with a 3D gaussian filter with a 3-mm full width at half maximum was performed.
Emission Data Acquisition and Reconstruction
18F-FDG PET was performed for the human subjects and phantom using the same protocol in both PET scanners (supplemental materials).
The 3D ordinary Poisson ordered-subset expectation maximization (OP-OSEM3D) algorithm accelerated by the parallelized computations (15) was used for the reconstruction of the HRRT images. The parameters of the OP-OSEM3D algorithm were as follows: 256 × 256 × 207 image voxels, 6 iterations, and 16 subsets. The PET/CT scanner used the 2-dimensional OSEM algorithm, and the parameters were as follows: 256 × 256 × 81 image voxels, 8 iterations, and 16 subsets. Normalization, random correction, attenuation correction, and scatter correction were applied with the reconstruction method in both scanners. A μ-map for attenuation correction was also used for estimating the scatter effects. Scatter-correction factors were calculated using the single-scatter simulation method (16) with a μ-map for both scanners.
After reconstruction, all reconstructed images were spatially normalized to the Montreal Neurological Institute template and were smoothed with a gaussian kernel of 8 mm in full width at half maximum using SPM2 (Wellcome Trust Centre for Neuroimaging).
Data Analysis
Comparison of Intensity Uniformity in Phantom
To compare the uniformity of each reconstruction algorithm, a 2-dimensional region of interest was chosen in each plane using the threshold method. Average pixel intensity of the region of interest was evaluated and plotted along the planes. The intensity ratio of the lower plane over the upper planes was calculated to quantify the uniformity, that is:
The phantom was placed at the middle of the axial field of view (∼50th to ∼145th planes). IUpper and ILower were the averages of the upper planes (∼62th to ∼92th planes) and the lower planes (∼112th to ∼142th planes), respectively.
Statistical Comparison of PET/CT Versus HRRT in Human Subjects
Unlike the phantom study, we used a statistical comparison for human subjects because it was difficult to define the standardized uptake value for each region. A statistical comparison was used to investigate the negative bias of the HRRT images reconstructed by μ-maps for each algorithm. PET/CT was chosen as the reference system, because it is known to be a quantitatively accurate system and has been clinically proven. In particular, PET/CT has not been reported to have a regional intensity bias. The 2-sample t test was performed using SPM2. Global mean scaling was used to normalize the mean of the intensity between PET/CT and HRRT images.
Intensity Recovery Ratio (IRR)
Reconstructed HRRT images were compared to investigate the effect according to μ-maps obtained by each transmission reconstruction method. The IRR was calculated using the following equation: where IMAP-TRdef and INew μ-map are the reconstructed images from the MAP-TRdef and the new μ-map, respectively.
Analysis of Bone Effect and Tissue Effect
To analyze how the missing or misestimated structures on the μ-maps change the intensity of the HRRT images, 2 simple simulations were used.
Bone effect was simulated for the human data. The μ-maps for the MAP-TR and CT-TR algorithms were segmented as the following 2 compartments: bone and nonbone tissue. This segmentation was accomplished using a simple constant-threshold method. A constant μ-value of 0.105 cm−1 was used as the threshold, and this value was used for the MAP-TRdef algorithm as the boundary between bone and nonbone tissue. Nonbone tissue were replaced by air (0.0 cm−1) to calculate only the contribution of bone for the attenuation correction. The resultant bone μ-map for the MAP-TR and CT-TR algorithms was converted to attenuation-correction factors (ACFs) as a sinogram form. To roughly visualize the brain location affected by the difference in these 2 bone μ-maps (the so-called bone-effect), the MAP-TR ACFs were subtracted from CT-TR ACFs and then backprojection was performed. One sample t test was performed on the subtraction images.
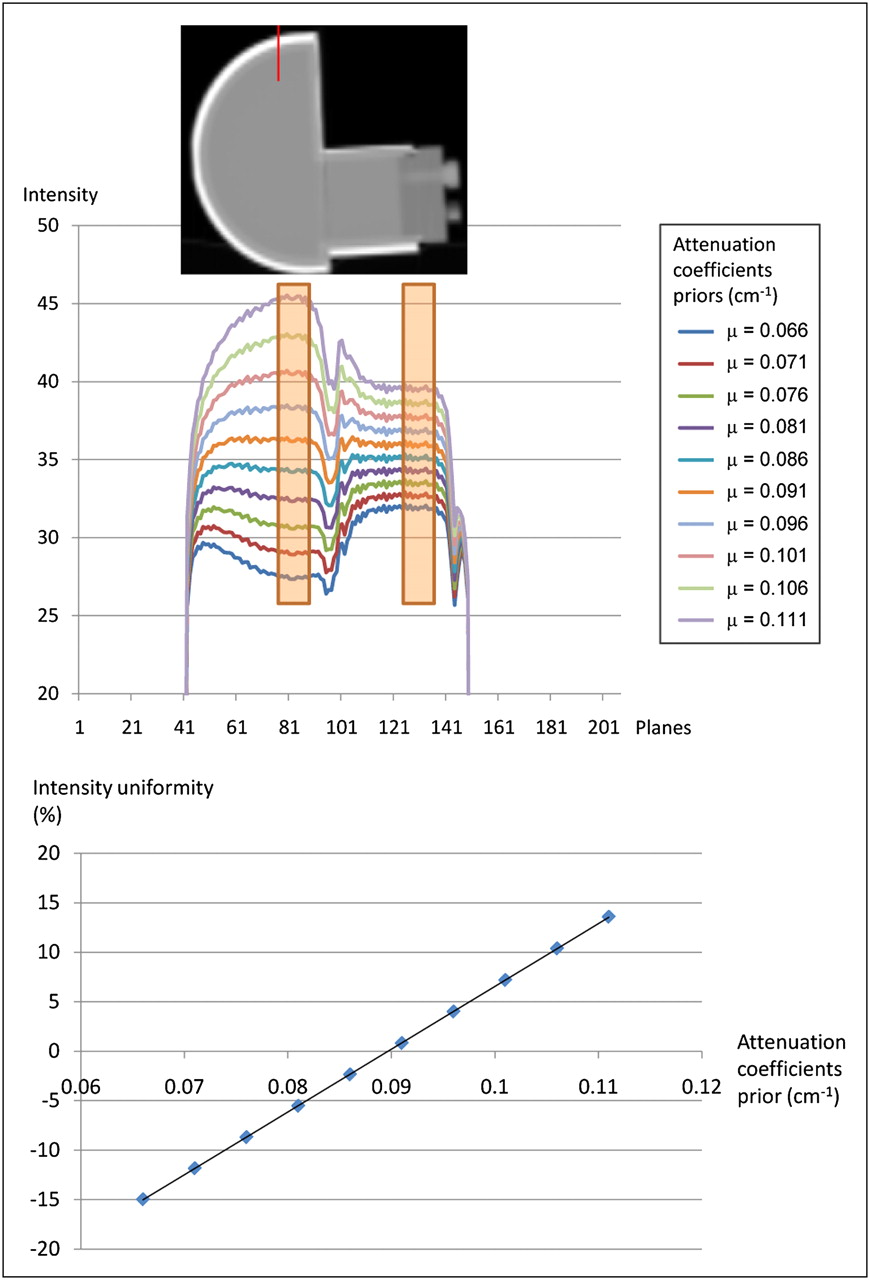
Tissue effect was simulated for the NRI phantom data to see how wrong μ-values of tissue affect the intensity of reconstructed images. The CT-TR μ-map for the phantom was segmented as water and Teflon using the threshold method. The μ-value of the water region for the CT-TR μ-map was replaced by a given value for a range from 0.066 to 0.111 cm−1. With the modified CT-TR μ-map, each image was reconstructed using the same protocol.
RESULTS
Comparison of μ-Maps According to Transmission Reconstruction
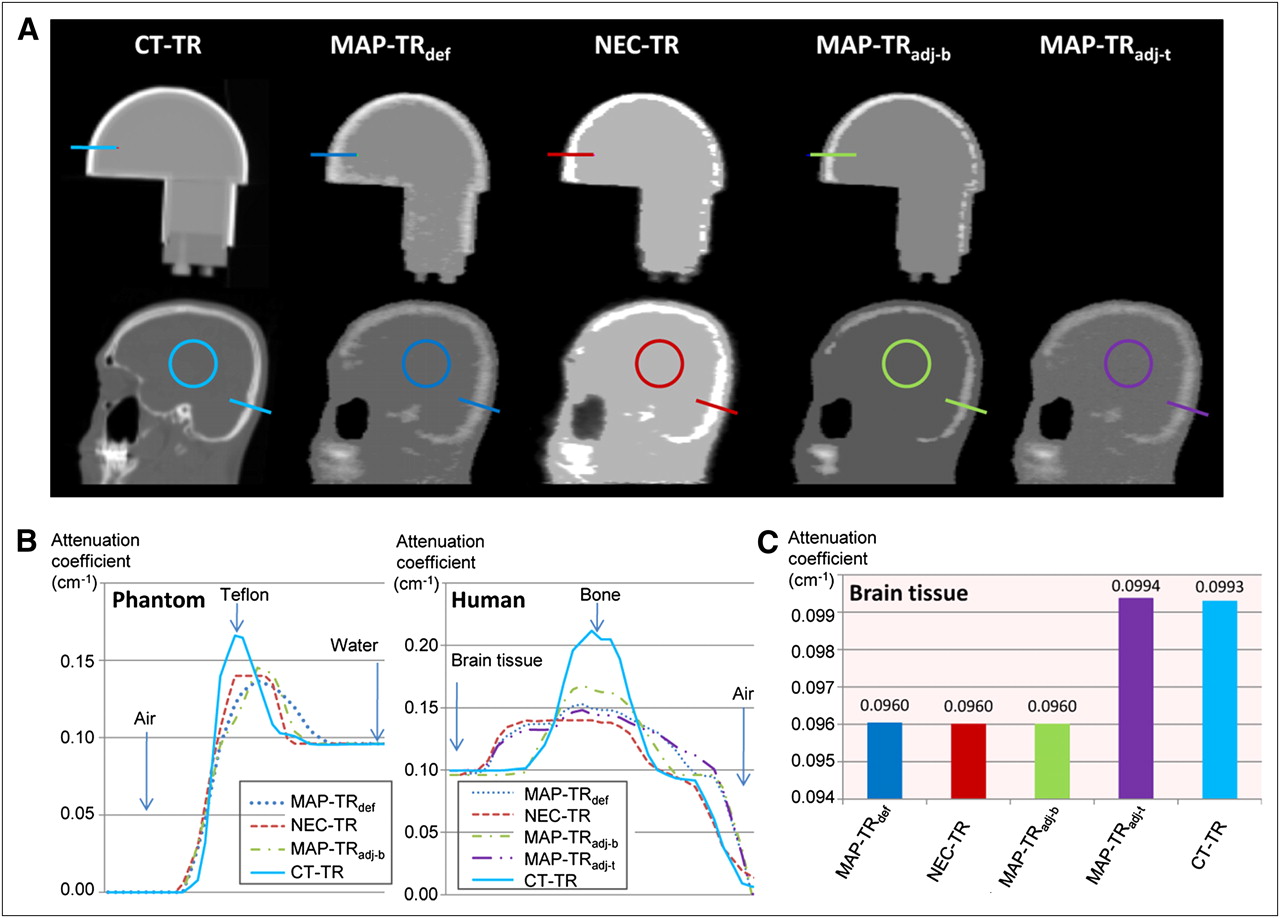
For human subjects, a CT-based μ-map can describe the fine structure of the skull with high resolution. All algorithms based on the use of 137Cs transmission scan data failed to detect thin or low-density bone structures, which exist mainly in the lower part of the skull (Fig. 1A). The MAP-TRdef algorithm resulted in a μ-map with a thicker and more smeared skull than that with the other algorithms. The MAP-TRadj-b algorithm generated a μ-map with adequate thickness in the skull, but many bones below the skull except for the teeth had disappeared on μ-images. The NEC-TR algorithm produced a μ-map similar to the one produced by the MAP-TRadj-b algorithm but with a flattened and thicker skull as seen on μ-images. The μ-values of bone were the highest in the μ-images of the CT-TR and MAP-TRadj-b algorithms (Fig. 1B). In the case of tissue, the μ-values for the CT-TR and MAP-TRadj-t algorithms were approximately 0.0994 cm−1, and the μ-values for the other algorithms were 0.096 cm−1 (Fig. 1C).

(A) Sagittal views of μ-maps according to transmission reconstructions. Upper μ-maps are for NRI phantom and lower ones for human. (B) μ-value profiles of colored lines of A. (C) Comparison among mean μ-values of brain tissue. Pixels in colored circles of A are used to obtain mean μ-values for C. CT-TR algorithm provides most accurate μ-values for brain tissue and shape for bone.
For phantom data, 137Cs-based μ-maps showed a thicker structure for the 5-mm shell than did the CT-based μ-map, and the 2-mm shell was almost not detected on the μ-map, as was similar for the human subjects (Fig. 1A). Even the 5-mm shell was partially missed or disappeared with the MAP-TRadj-b and NEC-TR algorithms, especially for the lower part of the phantom that corresponded to the brain stem. These areas were more smeared on μ-images with the MAP-TRdef algorithm, and the water regions were severely contaminated by the higher μ-values scattered from the Teflon. Measured μ-values of Teflon were the highest on the CT-based μ-maps (Fig. 1B). In contrast, for water the μ-values were about same as the known value, 0.096 cm−1, using all algorithms including CT-TR.
Comparison of Intensity Uniformity in Reconstructed Emission Images
For the water-filled phantom, each plane of the reconstructed image should ideally have the same intensity. As shown in Figure 2, a reconstructed image using the CT-TR algorithm showed less than a 2% difference in intensity between the upper and lower planes along the axial direction. The use of the other algorithms resulted in a more than 5% decrease in signal intensity at the lower slices. That finding was in accord with the fact that only the CT-TR algorithm can represent the thinner shell of the phantom on the μ-map. Although the CT-TR algorithm generates the most accurate μ-map, the small discrepancy between the upper and lower slices was caused by the measured μ-value of water. Interestingly, the values were apparently different between the upper and lower parts of the phantom, at a mean of 0.0961 and 0.0954 cm−1, respectively. This difference was also shown for HU in the original CT image. In addition, transformation of the μ-values for PET from lower-energy CT data is not accurate with a material such as Teflon.
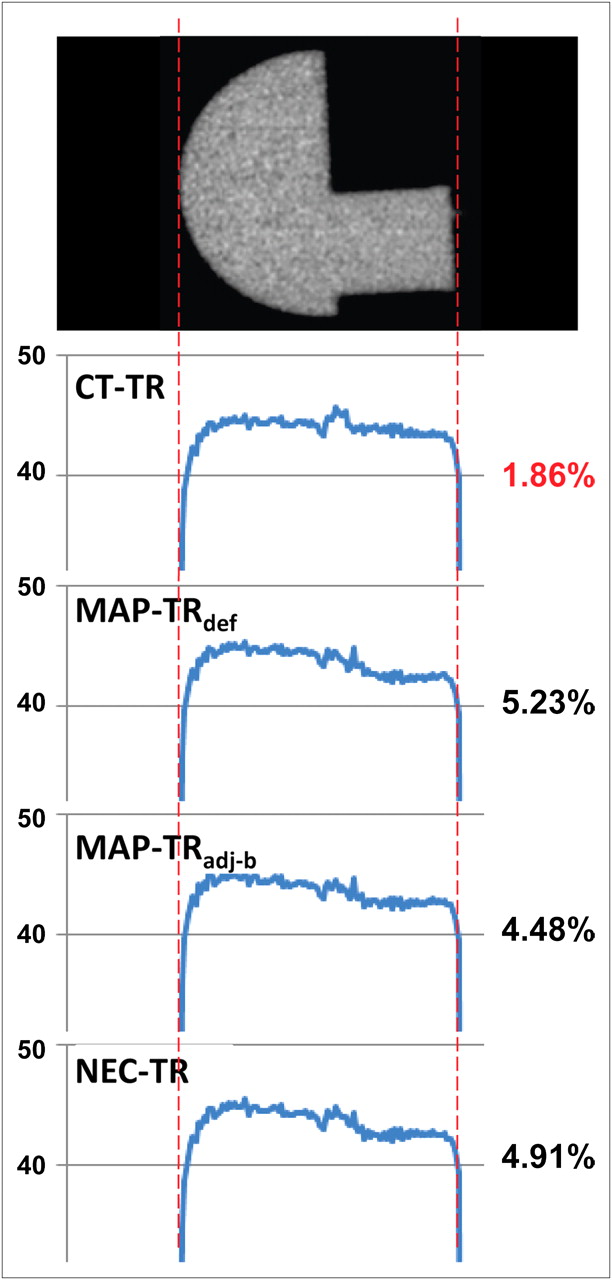
Intensity ratio of upper and lower part of phantom in reconstructed PET image according to transmission reconstruction. CT-TR showed most uniform intensity ratio in phantom.
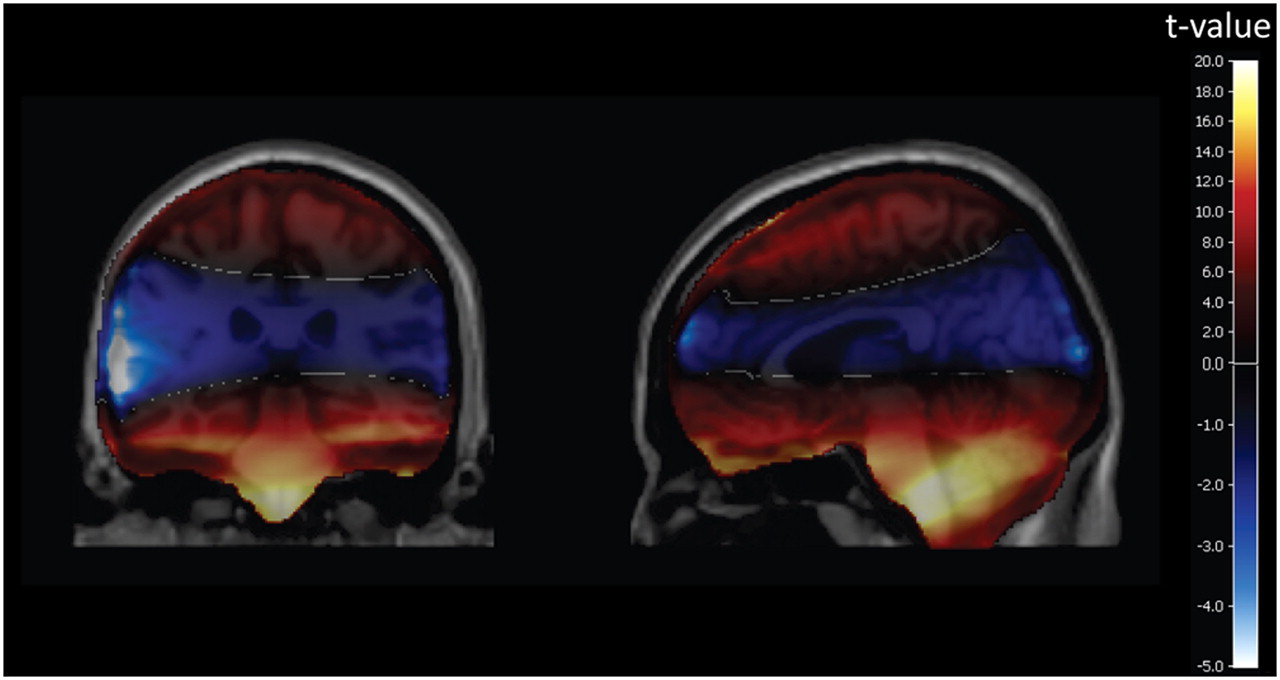
Bias of the reconstructed HRRT PET images, as compared with PET/CT images for human subjects, is shown in Figure 3. Most of the lower regions of the brain showed negative t values, and the upper regions showed positive t values, regardless of the transmission algorithm. The MAP-TRdef algorithm showed the most significantly negative t values in the lower brain. Overall, the CT-TR algorithm showed the least significant t values for both positive and negative t values, which provided images most similar to the PET/CT images. With the MAP-TRadj-t algorithm, as compared with the other algorithms, the negative t values were significantly reduced. In contrast, however, positive t values were more increased using the MAP-TRdef algorithm for the middle part of the brain.
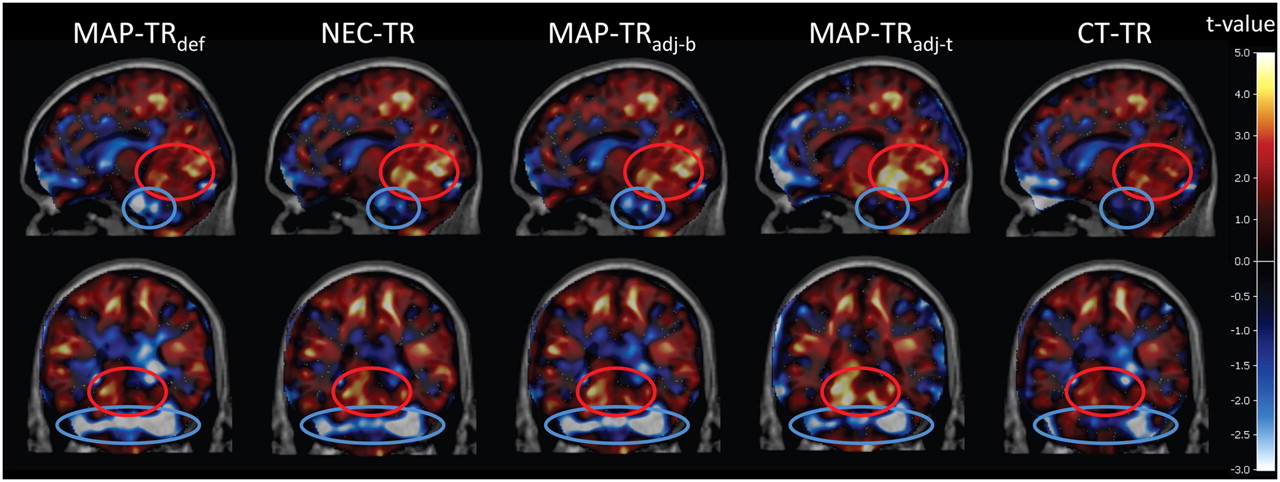
Positive and negative bias of HRRT image, compared with PET/CT image, according to transmission reconstruction. Most significant negative bias was found in lower parts including brain stem and cerebellum as reported (blue circle). Middle parts, such as superior regions of cerebellum and deep occipital cortex, showed significant positive bias (red circle). Both positive and negative biases were minimal in CT-TR. MAP-TRadj-t reduced negative bias effectively; in contrast, positive bias increased most.
To evaluate the appearance of intensity changes with each algorithm, as compared with the MAP-TRdef algorithm, the IRR of all subjects was averaged.
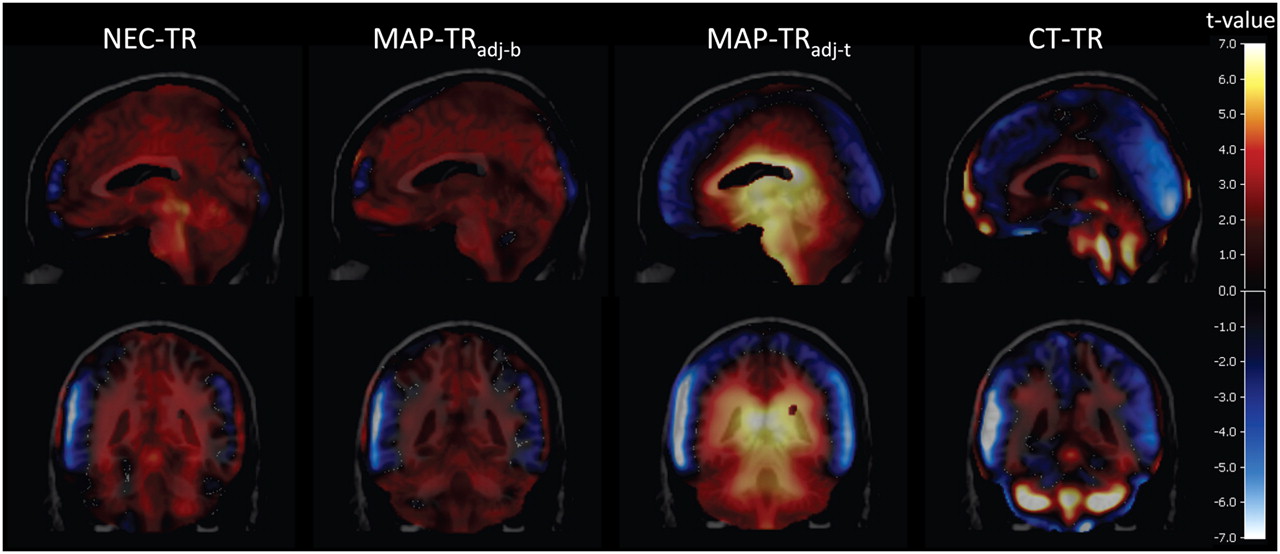
Global intensity scaling of a PET image can roughly normalize the intensity of a PET image according to the use of algorithms. The paired t test was used to evaluate the relative change of intensity for each subject with global intensity scaling as shown in Figure 4. The NEC-TR and MAP-TRadj-b algorithms showed a slight increase in the medial regions of the brain and a slight increase in the brain stem and the cerebellum. The MAP-TRadj-t and CT-TR algorithms showed a more significant and localized increase. The MAP-TRadj-t algorithm resulted in increased intensity in the central regions of the brain including the brain stem and decreased intensity in the neocortex of the brain. The CT-TR algorithm also resulted in increased intensity in the brain stem and the cerebellum but not in the central regions of the brain. The compensation pattern for the MAP-TRadj-t algorithm was more widely spread in the central region of the brain, and the compensation pattern for the CT-TR algorithm was more localized in the brain stem and the cerebellum.

Change of averaged IRR, compared with MAP-TRdef algorithm, after normalization of average intensity of whole brain for each subject. NEC-TR and MAP-TRadj-b increased intensity of PET image in most regions of brain, although amount of recovery ratio was not significant. Intensity of central brain regions was increased in MAP-TRadj-t, and intensity of outer cortices was decreased. Significantly increased regions of CT-TR were localized in the brain stem and cerebellum and the central regions were slightly changed.
Simulation of Bone Effect and Tissue Effect
The CT-TR algorithm could represent more bone structures in the lower regions not represented with the MAP-TRdef algorithm (Fig. 1). As compared with the MAP-TRdef algorithm, the skull as seen with the CT-TR algorithm was thinner, but the μ-values were higher. The influence on the reconstructed image of these differences in the bone parts of the μ-maps between CT-TR and MAP-TRdef algorithms was clearly shown in Figure 5. The positively higher t value demonstrates that the CT-TR algorithm produced a consistently higher ACF in most subjects than did the MAP-TRdef algorithm and vice versa for a negatively higher t value. A positively higher t value was observed in the brain stem and the cerebellum, whereas a negative t value was observed in the middle of the brain. These t values meant that region of the brain stem and the cerebellum had the higher intensity in the reconstructed image by attenuation correction using the CT-TR algorithm than using the MAP-TRdef algorithm. This analysis represents only bone effect.

Effect of bone difference between CT-TR and MAP-TRdef μ-maps on reconstructed PET image. ACFs were calculated from segmented bones after removal of brain tissue parts of each μ-map, and difference of ACFs was backprojected. Bone of CT-TR relatively increased signals of brain stem and cerebellum and decreased signals in central regions.
Unlike bone effect, tissue effect in the CT-TR algorithm can be measured more quantitatively using the phantom as shown in Figure 6. The CT-TR μ-map is used as a template for simulating the effect of wrong μ-value of the tissue. The ratio between the upper and lower regions was linearly proportional to the priors. The upper slices and the lower slices were identical when the μ-value of water became 0.090 cm−1 for the simulation results. Discrepancy in this value might be due to the effect of the inaccurate μ-value of Teflon using the CT-TR algorithm, as previously described.

Effect of attenuation coefficient priors in MAP-TR algorithm on reconstructed PET image. Overestimated μ-priors increased intensity of PET image and vice versa. Increased or decreased change became larger when volume was larger.
Although the value was much lower than the theoretic μ-value of water (0.096 cm−1), this simulation confirmed that the wrong priors for tissue could influence the ratio of the upper and lower slices. This finding indicates that deeper regions of the brain are more susceptible to an incorrect μ-value of brain tissue.
DISCUSSION
Attenuation and scatter correction are the most important correction processes of PET for quantitative and diagnostic analysis. These corrections, however, can be biased because of the incorrect estimation of the attenuator. Attenuation correction is more susceptible to the misestimation of attenuation than is scatter correction, because attenuation correction corrects by multiplication whereas scatter correction corrects by subtraction. Inaccurate μ-values can be generated during acquisition or reconstruction of transmission data. Because of the poor counting statistics of the radionuclide source–based transmission scan, thin bones—especially bones in the lower part of the skull—are often misclassified as tissue on μ-maps. In addition, because of the defects of the transmission reconstruction algorithms, μ-maps can be incorrectly estimated. For the MAP-TR algorithm, for instance, wrong prior information could lead to inaccurate assignment of μ-values. Our studies were basically designed on the basis of these 2 postulations. To simulate these postulations, we designed a new phantom with different volumes in the upper and lower parts of the skull to evaluate uniformity.
As expected, reconstructed PET images using μ-maps generated with the CT-TR algorithm were the most uniform for both phantom and human data. This finding can be explained because of tissue effect and bone effect.
The influence of the misestimated μ-value of tissue on PET images was shown for the simulation with the phantom study. As the defined prior of water was forcibly set to a higher or lower μ-value, signal increase or decrease, respectively, of a PET image for the upper part of the skull became larger than for the lower part of the skull (Fig. 6A). This finding might be due to a larger volume in the upper part of the skull. When ACFs were calculated for each sinogram bin, an erroneous μ-value accumulated along an integral path. Thus, the upper part with a larger diameter was more influenced by the misestimated μ-value. If a spheric phantom was used, the most influenced part became the center of the phantom.
Adjustment of the intensity priors of brain tissue to the ideal values (0.0994 cm−1) increased the signal for the entire area, as shown in Figure 4C. As compared with the MAP-TRdef algorithm, the intensity of central regions including the limbic regions and brain stem showed the greatest increase. The relative signal change in the brain was decreased in the outer cortices and was increased in the central regions. This change restored the intensity in the negatively biased regions with the MAP-TRdef algorithm, but some areas near central regions of the brain, which should not be increased, were contrarily increased too much (Fig. 3D). With the CT-TR algorithm, as compared with the MAP-TRadj-t algorithm, the intensity bias was stabilized in a more balanced way (Fig. 3E). The CT-TR algorithm has almost the same μ-values as the MAP-TRadj-t algorithm for brain tissue, but the restored regions vary slightly. Negative bias in the brain stem and cerebellum was restored, and an excessive increase in the central regions was not shown. It is clearly shown in Figure 4D that increased regions are localized only in the brain stem and cerebellum and not in the central regions. These findings imply that the CT-TR algorithm should have a factor other than tissue effect. Accurate and detailed representation of bone structures, especially for the lower part of skull, is seen with the CT-TR algorithm, as compared with the other MAP-TR algorithms. Effects of missed bones on the μ-map for image intensity as shown in Figure 5 may explain why the CT-TR algorithm, as compared with the MAP-TRadj-t algorithm, could more accurately correct the attenuation of the image. The CT-TR algorithm can represent, in the μ-map, details of bones that not all other radionuclide-based transmission data could describe. These bones are characterized by thinness and low density. The complemented μ-map for these bones showed increased intensity in the brain stem and cerebellum, as shown in Figure 5. More interestingly, intensity in the middle areas was decreased with the CT-TR algorithm, as compared with the MAP-TRdef algorithm. This result may have been caused by a smeared and inaccurate μ-valued skull with the MAP-TRdef algorithm in the frontal and occipital regions. The result of Figure 5 is based only on a bone effect. The μ-values for the tissue compartments are the same between the CT-TR and the MAP-TRdef algorithms, as shown in Figure 5.
To summarize the results, the 2 effects are mingled for the CT-TR algorithm. One result of using the CT-TR algorithm is that the tissue effect makes the μ-value of tissue more accurate than when using the MAP-TRdef algorithm. The other result of using the CT-TR algorithm is that the bone effect is a more accurate description of bone structures on the μ-map than when using the MAP-TRdef algorithm. The tissue effect causes an increase in the intensity of the central and lower regions of the brain, and the bone effect causes a decrease in the intensity of the central regions and increases the intensity of the lower regions of the brain. Therefore, an intensity decrease due to the bone effect may suppress the intensity increase in the central region by the tissue effect, and the CT-TR algorithm—as compared with PET/CT—resulted in a better-balanced intensity in the brain, as shown in Figure 3. These effects are verified by the comparison of Figures 3A and 4D. The CT-TR algorithm almost exactly restores or suppresses the decreased or increased regions of the MAP-TRdef algorithm, respectively. More details are shown in Supplemental Figure 2.
Although the misestimation of a μ-map is presumed to be the major cause of the negative bias for the cerebellum and brain stem, it is still unknown why other commercial PET systems previously developed do not have this bias. Therefore, differences between the HRRT PET system and other commercial systems should be noted. The HRRT system uses a 137Cs point source and fanbeam scanning for the transmission scan; most of the other systems use a rotating 68Ge rod source. The μ-map of the 137Cs point source is, however, known to have a signal-to-noise ratio superior to other radionuclide sources (17). Accordingly, for μ-map quality, the transmission data of the HRRT is not the cause of the problem. Another difference between the HRRT and other commercial systems is the geometry of the gantry, with a lengthened bore of the HRRT in the axial direction. The axial FOV of most commercial PET scanners is approximately 16 cm, but the axial FOV of the HRRT is approximately 25 cm. Consequently, most μ-maps for the commercial PET systems do not contain bone structures below the skull and only the skull is dominant on a μ-map. The skull, as compared with the other bones below the skull, is not relatively influenced by the quality of the μ-map because it has a uniform thickness and a simple shape. Although a radioisotope-based method, as compared with a CT-based method, cannot provide a precise μ-map, the quality is sufficient for the skull region. The axial FOV of the HRRT includes many other bones with complicated structures, such as the teeth, jaw, and neck. However, these bones were out of the FOV for the μ-map of existing PET systems. A lengthened axial FOV, consequently including the bone structures below the skull, might cause underestimation of the ACFs and inaccurate results.
Not only attenuation correction but also scatter correction will be influenced by transmission reconstruction for currently used PET systems, including the HRRT, because they estimate the scatter-correction factors using single-scatter simulation methods based on the μ-map. We evaluated scatter correction, as compared with attenuation correction, by changing the μ-map of the various algorithms, but the effect was not significant.
CONCLUSION
Among the proposed algorithms for transmission reconstruction, the CT-TR algorithm provided the most accurate attenuation correction for the HRRT system. The CT-TR algorithm, however, has some pitfalls, because the algorithm requires the installation of additional hardware for CT or scanning from another CT scanner. For the latter case, inaccurate coregistration may cause additional problems, and for the former case, additional costs will be incurred. In addition, metallic artifacts with CT are major weaknesses. The MAP-TR algorithm, with appropriate priors minimizing the bias, is another choice without any additional hardware installation for the system. A validation study of the optimized priors for each tissue component is necessary. A μ-value of brain tissue of 0.0994 cm−1 is sufficient. However, more studies are needed to determine the μ-value for bone. Finally, for a PET scanner with a long axial FOV, a new method should be proposed to describe thin or low-density bones for the transmission data, unless the PET scanner is equipped with CT.
Acknowledgments
This work was supported by the Basic Science Research Program through the National Research Foundation (NRF) funded by the Ministry of Education, Science and Technology (2008-04159 and 2009-0081933).
Footnotes
-
COPYRIGHT © 2010 by the Society of Nuclear Medicine, Inc.
References
- Received for publication September 5, 2009.
- Accepted for publication February 12, 2010.


Jump to section
Related Articles
Cited By...
- No citing articles found.