


Abstract
The purpose of this study was to compare the accuracy of lesion detection and diagnostic confidence between 18F-FDG PET/CT, gadolinium-ethoxybenzyl-diethylenetriamine pentaacetic acid (Gd-EOB-DTPA)–enhanced MRI, and retrospectively fused PET and MRI (PET/MRI). Methods: Thirty-seven patients (mean age ± SD, 60.2 ± 12 y) with suspected liver metastases underwent PET/CT and Gd-EOB-DTPA–enhanced MRI within 0–30 d (mean, 11.9 ± 9 d). PET and Gd-EOB-DTPA–enhanced MR image data were retrospectively fused. Images were reviewed independently by 2 readers who identified and characterized liver lesions using PET/CT, Gd-EOB-DTPA–enhanced MRI, and PET/MRI. Each liver lesion was graded on a 5-point confidence scale ranging from definitely benign (grade of 1) to definitely malignant (grade of 5). The accuracy of each technique was determined by receiver-operating-characteristic analysis. Histopathology served as the standard of reference for all patients with malignant lesions. Results: A total of 85 liver lesions (55 liver metastases [65%] and 30 benign lesions [35%]) were present in 29 (78%) of the 37 patients. Twenty-four (65%) of the 37 patients had liver metastases. The detection rate of liver lesions was significantly lower for PET/CT than for Gd-EOB-DTPA–enhanced MRI (64% and 85%; P = 0.002). Sensitivity in the detection and characterization of liver metastases for PET/CT, Gd-EOB-DTPA–enhanced MRI, PET/MRI in reader 1, and PET/MRI in reader 2 was 76%, 91%, 93%, and 93%, respectively; the respective specificity values were 90%, 100%, 87%, and 97%. The difference in sensitivity between PET/CT and PET/MRI was significant (P = 0.023). The level of confidence regarding liver lesions larger than 1 cm in diameter was significantly higher in PET/MRI than in PET/CT (P = 0.046). Accuracy values (area under the receiver-operating-characteristic curve) for PET/CT, Gd-EOB-DTPA–enhanced MRI, PET/MRI in reader 1, and PET/MRI in reader 2 were 0.85, 0.94, 0.92, and 0.96, respectively. Conclusion: The sensitivity of Gd-EOB-DTPA–enhanced MRI and PET/MRI in the detection of liver metastases is higher than that of PET/CT. Diagnostic confidence was significantly better with PET/MRI than with PET/CT regarding lesions larger than 1 cm in diameter. Compared with Gd-EOB-DTPA–enhanced MRI, PET/MRI resulted in a nonsignificant increase in sensitivity and diagnostic confidence.
- hepatology
- MRI
- oncology
- PET/MRI
- PET/CT
- PET/MRI
- liver metastases
- multimodality imaging
- positron emission tomography
Imaging of liver metastases is still challenging. In the last few years, dynamic contrast-enhanced CT has become the primary imaging modality for detection of liver metastases, with reported sensitivities of 73%−85% (1,2). 18F-FDG PET has been reported to be superior to CT for detecting liver metastases from colorectal cancer (3) and by some was found the most sensitive noninvasive imaging investigation for detecting liver metastases (4,5). 18F-FDG PET/CT has been performed with the objective of improving detectability and increasing diagnostic performance and has shown sensitivities of between 61% and 97% in the detection of liver metastases (6–10).
Dynamic contrast-enhanced MRI techniques improve diagnostic accuracy in detecting liver metastases (11,12). Rapid sequential imaging with gadolinium-based contrast agents in the extracellular space is superior to unenhanced imaging and helical CT for detecting metastatic liver disease (13). With the recent availability of hepatobiliary contrast medium with uptake into hepatocytes, the detectability and characterization of liver lesions and especially small liver metastases have further improved (14–18).
For overall patient management, 18F-FDG PET and PET/CT have the added advantage over MRI and CT of providing not only anatomic but also functional information. Thus, improved assessment of therapeutic response becomes possible, as 18F-FDG activity is seen only in vital tumor cells (19). CT and MRI rely on only the indirect Response Evaluation Criteria in Solid Tumors to assess therapeutic response. The combination of functional information derived from 18F-FDG PET with anatomic information derived from MRI may be of further help in the detection and characterization of liver metastases and in preoperative planning and therapeutic follow-up of patients with liver metastases from gastrointestinal or pancreatic cancer. Compared with using 18F-FDG PET alone, combining the advantages of 18F-FDG PET (detection of extrahepatic disease and evaluation of therapeutic response) with the advantages of MRI (higher spatial resolution and tissue contrast) may lead to improved lesion detection and characterization (20).
The purpose of this study was to compare the accuracy and diagnostic confidence of PET/CT, gadolinium-ethoxybenzyl-diethylenetriamine pentaacetic acid (Gd-EOB-DTPA)–enhanced MRI, and retrospectively fused PET and MRI (PET/MRI) for depiction of liver lesions. Surgery and histologic analysis served as the standard of reference.
MATERIALS AND METHODS
This study followed Declaration of Helsinki principles (21) and was approved by the ethical review board at our institution. Informed patient consent was waived for this retrospective evaluation.
Patients
We retrospectively included 51 consecutive patients, in whom PET/CT and Gd-EOB-DTPA–enhanced MRI of the liver had been performed within 30 d and a clear standard of reference for hepatic lesions was available (Supplemental Fig. 1; supplemental materials are available online only at http://jnm.snmjournals.org).
Data Acquisition
PET/CT and Gd-EOB-DTPA–enhanced MR images were acquired separately without special prerequisites with regard to the planned image fusion.
PET/CT
All data were acquired on 1 of 2 combined PET/CT in-line systems (Discovery STE or Discovery RX; GE Healthcare).
The patients fasted for at least 4 h before scanning, which started approximately 45–60 min after the injection of 370–400 MBq of 18F-FDG. The glucose level (range, 80–120 mg/dL [4.4–6.7 mmol/L]) was measured before scanning. Patients with elevated glucose levels were rescheduled and scanned when glucose levels were normal. Patients were examined in the supine position. Initially, a low-dose CT scan was acquired starting from the level of the head using the following parameters: 40 mAs, 140 kV, 0.5 s/tube rotation, a slice thickness of 4.25 mm, a scan length of 867 mm, and a data acquisition time of 22.5 s. The CT scan was acquired during breath holding in the normal expiratory position. The CT data were used for attenuation correction and lesion localization. PET raw data were iteratively reconstructed using a standard algorithm: ordered-subset expectation maximization (28 subsets, 2 iterative steps) for 2-dimensional (2D) PET, and a fully 3-dimensional (3D) ordered-subset expectation maximization iterative reconstruction algorithm for 3D PET.
Immediately after the CT acquisition, PET emission scans were acquired with a time of 90 s to 3 min per cradle position with a 1-slice overlap in 2D and a 7-slice overlap in 3D reconstruction mode (matrix, 128 × 128). Acquisition time per cradle position was 3 min in 2D mode and 1.5 min in 3D mode. The 8–9 cradle positions starting from the head and continuing to the knees resulted in an acquisition time of approximately 12–27 min.
Gd-EOB-DTPA–Enhanced MRI
All individuals underwent MRI of the liver using a 1.5-T MRI system (Signa EchoSpeed EXCITE HD; GE Healthcare). For signal reception, an 8-channel anteroposterior phased-array surface coil was placed around the individual and covered the entire liver. Imaging protocols included unenhanced and contrast-enhanced sequences. Unenhanced sequences consisted of single-shot fast spin-echo, T2-weighted fast spin-echo, and in- and out-of-phase gradient-echo sequences. Contrast-enhanced MRI was performed during the hepatic arterial, portal venous, and extracellular phases after intravenous injection of Gd-EOB-DTPA (gadoxetic acid [Primovist; Bayer Schering Pharma]) at a dose of 25 μmol/kg of body weight and a flow rate of 2 mL/s, followed by a 20-mL saline flush. In addition, delayed imaging in the hepatospecific phase of the contrast agent was performed 20 and 30 min after contrast injection. Contrast-enhanced MRI was performed using a breath-hold fat-suppressed 3D T1-weighted gradient-echo sequence with parallel imaging. Imaging parameters and plane orientations are displayed in Table 1.
Acquisition Parameters for Gd-EOB-DTPA–Enhanced MRI
Image Registration
For image registration and fusion, a software prototype, currently under development and not commercially available in any markets yet, was used (Integrated Registration; GE Healthcare). This software is being developed with the goal of becoming a multimodality registration package. Its intended use is for automatic propagation of registration across series acquired in the same examination based on 3 registration methods: automatic, manual, and landmark-based. These can be combined to provide an optimal result. In our study, we used an automatic quaternion-based algorithm for rigid registration.
Image Analysis
Images were analyzed on a dedicated workstation (Advantage Windows, version 4.3; GE Healthcare Europe). Three sets of images were analyzed for each patient: PET/CT (image set A), unenhanced and Gd-EOB-DTPA–enhanced MRI (image set B), and unenhanced and Gd-EOB-DTPA–enhanced MRI with PET/MRI (image set C). Separately and independently, 1 experienced nuclear medicine physician and radiologist (reader 1) evaluated image set A, and 1 experienced radiologist (reader 2) evaluated image set B. Subsequently, in a second image reading session, both readers evaluated image set C. When the readers evaluated image set C, they had available image set B, the PET part of the PET/CT dataset, and the fused PET/MRI dataset (Supplemental Fig. 2). To minimize any recall bias, the reading sessions were separated by 5 wk. Neither reader was aware of the results of other imaging studies, the results of the other reader, or the findings of surgery or histopathologic examination.
All images of each image set were evaluated in random order on an Advantage Windows workstation.
In image sets A, B, and C, the presence, location, and size of any liver lesions were recorded using a grid reference and segmental location. The diameters of the lesions were measured, and confidence of each liver lesion with regard to malignancy was assessed using a 5-point Likert scale (1, definitely benign; 2, probably benign; 3, indeterminate; 4, probably malignant; 5, definitely malignant).
In determining whether a tumor was malignant or benign on Gd-EOB-DTPA–enhanced MRI, the readers used the criteria of Reimer et al. (22). At PET/CT, suggestive lesions were defined as previously reported by Rappeport et al. (23). Standardized uptake values were not calculated.
Standard of Reference
The imaging findings were carefully correlated to surgical and pathologic records by an author other than those who performed the masked reading. All patients with malignant liver lesions (n = 24) underwent hemihepatectomy or segmental resection (n = 19), postmortem autopsy (n = 2) or open biopsy (n = 3). Patients with only benign liver lesions (n = 5) underwent imaging follow-up (n = 3; mean ± SD, 21.2 ± 6.3 mo), postmortem autopsy (n = 1), or intraoperative biopsy (n = 1) (Supplemental Fig. 1).
Statistical Analysis
Methods were compared on a per-lesion and per-patient basis. Lesion detectability was determined regardless of evaluation of malignancy of the respective lesion. Sensitivity and specificity in detecting and characterizing liver metastases were determined by counting as liver metastases only those lesions that were graded 4 or 5. To address clustering of lesions within patients, lesion detection rates, sensitivities, and specificities were compared between PET/CT and Gd-EOB-DTPA–enhanced MRI using the multilevel mixed-effects logistic regression routine xtmelogit of Stata (Intercooled Stata, version 10.0; Stata Corp.) for Macintosh (Apple Inc.). A receiver-operating-characteristic curve was fitted to each reader's confidence rating for liver lesions. The accuracy of the 3 methods and the 2 readers was estimated by calculating the area under the receiver-operating-characteristic curve (AUC).
Patient-based lesion detectability, sensitivity, and specificity were analyzed using the McNemar test. For the analysis of confidence for classification of benign and malignant lesions, a confidence level of 1 was considered best confidence in benign lesions, whereas a confidence level of 5 was considered best confidence in malignant lesions. To address clustering of lesions within patients, mean confidence within patients was computed and analyzed using the Wilcoxon signed rank test. A P value of less than 0.05 was considered to indicate a statistically significant difference. The unweighted k-statistic with binary data was used to assess interreader variability in the assessment of PET/MRI. Binary values of 0 (not malignant) and 1 (malignant) were assigned to lesions with a malignancy rating of 3 or less and to lesions with a rating of 4 or more, respectively. Statistical analyses were performed with statistical software SPSS (version 15.0; SPSS Inc.) and Stata.
RESULTS
Patients
Of the 51 patients, 14 were excluded because they underwent surgery (n = 3) or chemo- or radiotherapy less than 30 d before imaging (n = 6) or between examinations (n = 5). The final study group comprised 37 patients (23 men and 14 women) with a mean age of 60.2 y (range, 35–82 y). The mean interval between PET/CT and Gd-EOB-DTPA–enhanced MRI was 11.9 ± 9 d, and the range was 0–30 d. Nineteen (51%) of the 37 patients never had chemo- or radiotherapy before imaging. The remaining 18 (49%) of 37 patients had chemo- or radiotherapy between 32 and 808 d before imaging (mean, 209.7 ± 226 d).
The primary tumor that initiated evaluation of the patient for liver metastasis was colorectal cancer (n = 20); pancreatic cancer (n = 11); ear, nose, and throat cancer (n = 1); breast cancer (n = 1); lung cancer (n = 1); hepatocellular carcinoma (n = 1); cholangiocellular carcinoma (n = 1); or melanoma (n = 1).
Liver Lesions
A total of 85 liver lesions (55 liver metastases and 30 benign lesions) were present in 29 patients. In 8 patients, no liver lesion was present. Five patients had only benign lesions. The size distribution of lesions is shown in Table 2. Benign lesions included liver cysts (n = 18), liver cell adenomas (n = 5), focal nodular hyperplasias (n = 4), and postoperative lesions (n = 3). Twenty-four patients had a total of 55 liver metastases (mean, 2.3 ± 2.1; range, 1–8). All 24 of those patients underwent definitive surgery, operative biopsy, or postmortem autopsy with histopathologic examination. Forty-five liver metastases were confirmed histologically in these 24 patients. The remaining 10 liver metastases were confirmed by follow-up imaging (mean, 11.9 ± 2.7 mo).
Size Distribution of the 85 Hepatic Lesions
Lesion Detectability
Regarding all 85 lesions (independent of the diameter of the lesion), detection rate in determining the presence of a lesion differed significantly between PET/CT and Gd-EOB-DTPA–enhanced MRI (64% and 85%; P = 0.002).
For lesions 1 cm in diameter or smaller, the difference in detection rate between PET/CT and Gd-EOB-DTPA–enhanced MRI was significant (29% and 71%; P = 0.013) (Fig. 1).

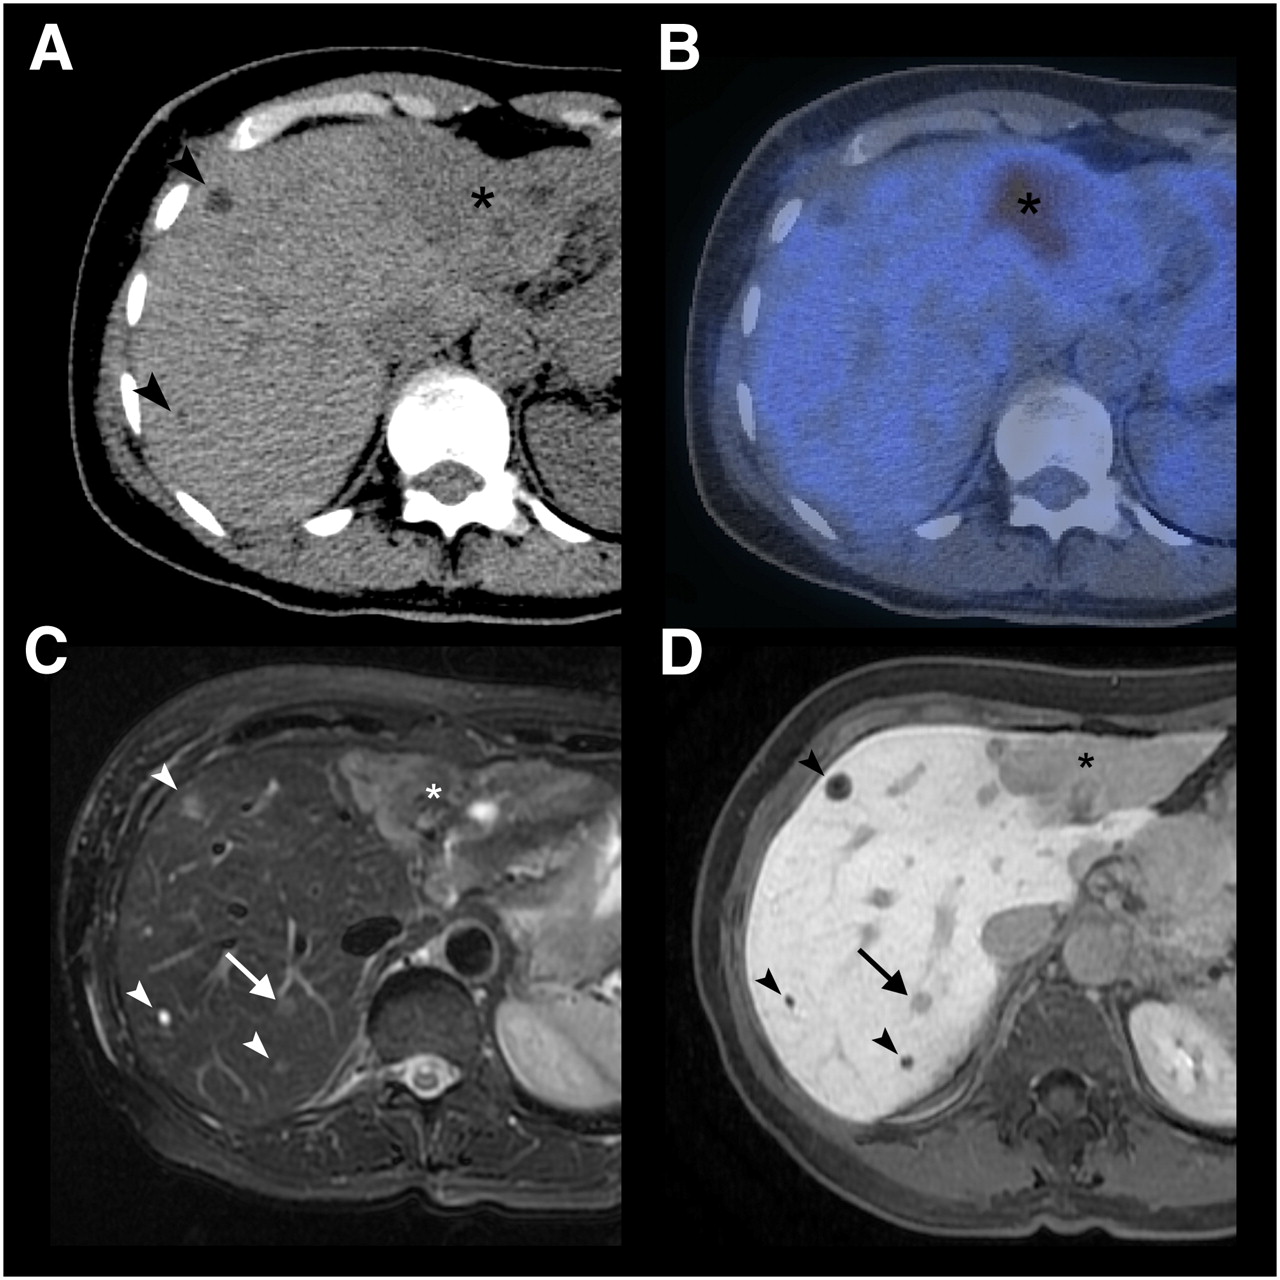
A 64-y-old patient with multiple liver metastases due to breast cancer. (A) On CT, 2 small (arrowheads) and 1 large (asterisk) hypodense lesion are noted. (B) Only the large lesion, in liver segment II/III, shows 18F-FDG uptake on PET/CT. (C and D) In liver segment VII, 2 additional lesions not visible on CT and PET/CT images are seen on T2-weighted fast spin-echo MRI (C) and Gd-EOB-DTPA–enhanced 3D gradient-echo MRI in hepatobiliary phase (D). One lesion (arrow) corresponds to metastasis as confirmed by intraoperative biopsy; other lesion (arrowhead) corresponds to cysts.
Also for lesions larger than 1 cm in diameter, the difference in detection rate between PET/CT and Gd-EOB-DTPA–enhanced MRI was significant (77% and 90%; P = 0.03) (Table 3).
Detection Rate for Liver Lesions (Benign and Malignant)
Sensitivity and Specificity in Detection of Liver Metastases
Regarding all 85 lesions (benign and malignant combined), consistent with the higher detectability, the sensitivity in detecting and correctly characterizing liver metastases was significantly higher for PET/MRI than for PET/CT (93% and 76%; P = 0.023). The sensitivity of Gd-EOB-DTPA–enhanced MRI (91%) was not significantly different from that of PET/MRI (Table 4).
Sensitivity and Specificity in Detection of Liver Metastases
For the subgroups of lesions 1 cm in diameter or smaller (n = 24), the sensitivities for PET/CT, Gd-EOB-DTPA–enhanced MRI, and PET/MRI were 30% (3/10), 80% (8/10), and 70% (7/10), respectively. Specificities were 86% (12/14) and 100% (14/14) for PET/CT and Gd-EOB-DTPA–enhanced MRI. For PET/MRI, specificities were 71% (10/14) for reader 1 and 100% (14/14) for reader 2. There were too few lesions to reveal significant differences between methods (Table 4).
For lesions larger than 1 cm, the sensitivities for PET/CT, Gd-EOB-DTPA–enhanced MRI, and PET/MRI were 87% (39/45), 93% (42/45), and 98% (44/45), respectively. Specificities were 94% (15/16) and 100% (16/16) for PET/CT and Gd-EOB-DTPA–enhanced MRI. For PET/MRI, specificities were 100% (16/16) for reader 1 and 94% (15/16) for reader 2 (Table 4). Differences between modalities were not significant.
On a per-patient basis, the sensitivity of PET/CT, Gd-EOB-DTPA–enhanced MRI, PET/MRI for reader 1, and PET/MRI for reader 2 was 100%, 96%, 96%, and 100%, respectively. The respective specificity values were 92%, 100%, 92%, and 100%.
Accuracy in Lesion Characterization
When all 85 lesions were considered, the AUC was higher for Gd-EOB-DTPA–enhanced MRI than for PET/CT (0.94 and 0.85, respectively). For reader 1, AUC was higher for PET/MRI than for PET/CT (0.92 and 0.85, respectively). For reader 2, AUC was 0.94 and 0.96 for Gd-EOB-DTPA–enhanced MRI and PET/MRI, respectively. Regardless of lesion size, PET/MRI was the most accurate technique for both readers (Supplemental Fig. 3).
For lesions 1 cm in diameter or smaller, Gd-EOB-DTPA–enhanced MRI showed a higher AUC than did PET/CT (0.84 and 0.54). For reader 1, AUC was higher for PET/MRI than for PET/CT (0.66 and 0.54, respectively). For reader 2, AUC increased only slightly when PET information was added to MRI (Gd-EOB-DTPA–enhanced MRI and PET/MRI, 0.84 and 0.87, respectively).
For reader 1, the AUC for lesions larger than 1 cm was higher for PET/MRI than for PET/CT (0.99 and 0.93, respectively). The increase in the AUC for reader 2 between Gd-EOB-DTPA–enhanced MRI and PET/MRI was slight (0.96 and 0.97, respectively) (Table 5).
AUC in Detection of Liver Metastases
Diagnostic Confidence
Evaluation of diagnostic confidence regarding all benign and malignant lesions larger than 1 cm showed a significant difference between PET/CT and PET/MRI. On a per-lesion basis, reader 1 was more confident with PET/CT in 7 cases and more confident with PET/MRI in 16 cases (Supplemental Fig. 4). In 38 cases, the level of confidence remained the same (P = 0.046 in patient-based analysis).
Considering all lesions, the diagnostic confidence between PET/CT and Gd-EOB-DTPA–enhanced MRI and between PET/MRI and Gd-EOB-DTPA–enhanced MRI did not reveal significant differences, but in selected cases, PET/MRI could improve diagnostic confidence over Gd-EOB-DTPA–enhanced MRI (Figs. 2 and 3).

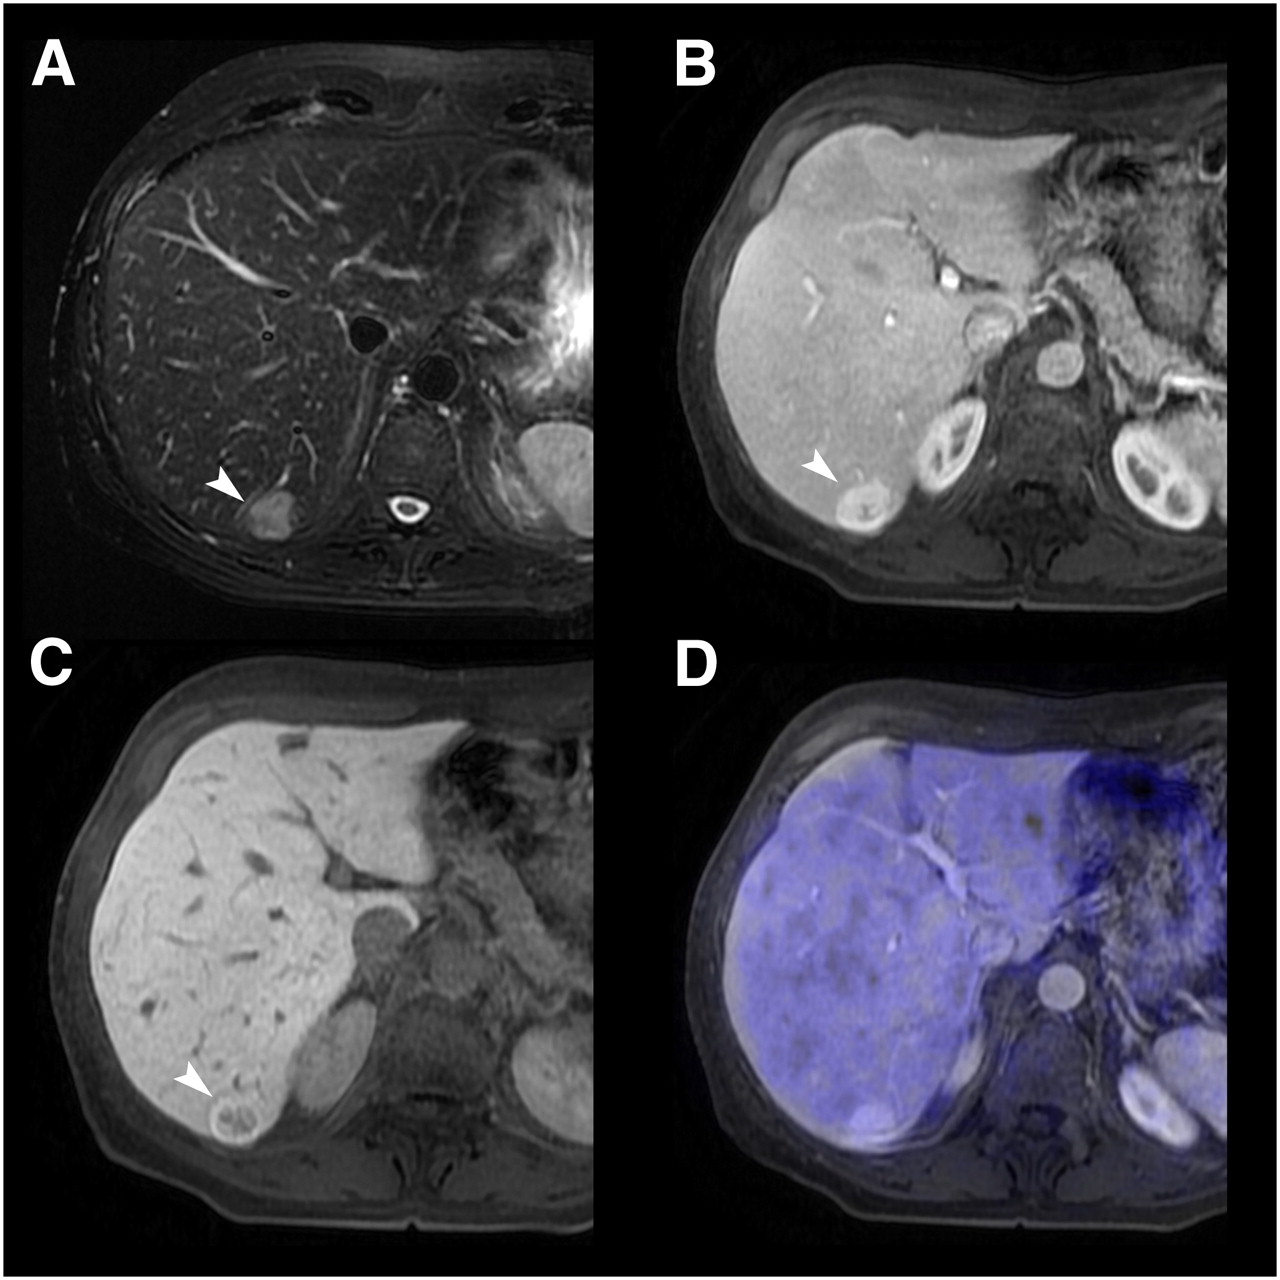
A 56-y-old patient with incidental liver finding on sonography. (A) T2-weighted MRI shows hyperintense lesion (arrowhead) in segment VI. (B and C) On Gd-EOB-DTPA–enhanced MRI, lesion shows contrast uptake during portal venous phase (B) and no contrast uptake during hepatobiliary phase (C). Lesion was first graded as indeterminate (grade 3). When information from PET was added to MRI (D), lack of 18F-FDG uptake indicated that lesion was definitely benign (grade 1). Histopathology confirmed diagnosis of focal nodular hyperplasia.

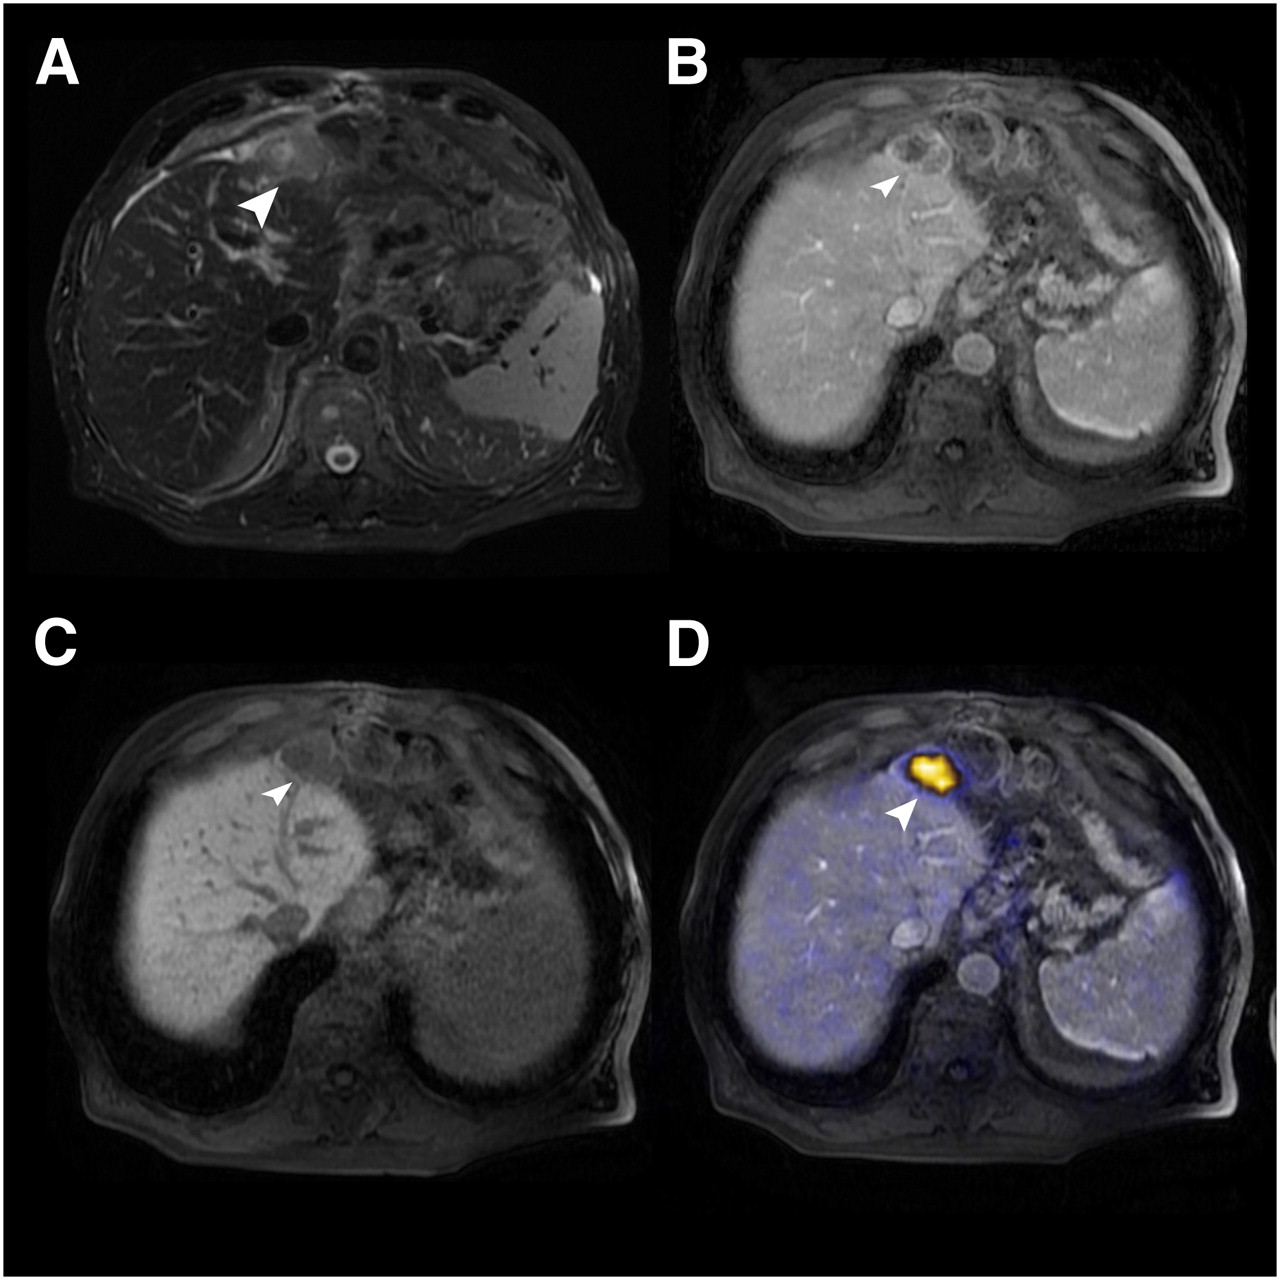
An 82-y-old gastric cancer patient after left hemihepatectomy. (A) On T2-weighted fast spin-echo MRI, subcapsular lesion (arrowhead) is hyperintense. (B) Lesion shows slight rimlike contrast uptake during portal venous phase. (C) Lesion shows no contrast medium uptake during hepatobiliary phase after injection of Gd-EOB-DTPA. Based on MRI findings, lesion was graded as probably malignant (grade 4). (D) When information from PET was added to MRI, 18F-FDG uptake indicated that lesion was definitely malignant (grade 5). Histopathology confirmed diagnosis of hepatic metastasis from gastric carcinoma.
Interreader Variability
Reader agreement was assessed for the 85 lesions. There was good agreement in grading liver lesions as benign or malignant on PET/MRI, with a κ-value of 0.72.
DISCUSSION
Our results demonstrate a superior detection rate and higher confidence in characterization of liver metastases for Gd-EOB-DTPA–enhanced MRI or PET/MRI than for PET/CT. Gd-EOB-DTPA–enhanced MRI was significantly more sensitive in the detection of liver lesions than was PET/CT. Also, sensitivity in detection and correct classification of lesions as malignant was significantly better for either of the 2 MRI-based techniques than for PET/CT. However, a significant difference in sensitivity between Gd-EOB-DTPA–enhanced MRI and PET/MRI could not be observed. Several factors contribute to the higher sensitivity of the MRI-based modalities than of PET/CT. The most important factor is the higher spatial resolution of MRI than of 18F-FDG PET and the better soft-tissue contrast in comparison to PET/CT. Second, the use of hepatocyte-specific contrast medium additionally improves the sensitivity of Gd-EOB-DTPA–enhanced MRI and PET/MRI.
The 76% sensitivity of PET/CT in detecting liver metastases in our study lies within the wide range of reported sensitivities and might have been improved further if PET/CT had been performed with dedicated contrast-enhanced CT. Recent studies (3,24–26) and metaanalyses (4,5) of PET for detecting liver metastases have reported sensitivities from 61% to 94%. The few studies that have investigated the sensitivity of PET/CT in detection of liver metastases have reported values between 61% and 97% (6–10,27). The fact that our sensitivity for PET/CT is rather at the lower end of the range may be explained in part by the relatively high number of liver metastases with a diameter of 1 cm or less (18%). From the studies mentioned above, PET/CT is known to have a relatively low sensitivity in the detection of liver metastases smaller than 1 cm. Our reported PET/CT sensitivity of 30% for small lesions is comparable to the sensitivity found by Coenegrachts et al., who reported a detection rate of 36% for liver metastases smaller than 1 cm (10).
Only a few studies have compared lesion detection and characterization between contrast-enhanced MRI and PET/CT (20,23,28,29), but in none of them was Gd-EOB-DTPA used as the liver-specific contrast medium. Our results for the sensitivity of Gd-EOB-DTPA–enhanced MRI are comparable to results from studies examining detection of metastasis using MRI with liver-specific contrast agents, superparamagnetic iron oxide in most (18,23,29–32). Sahani et al. retrospectively compared mangafodipir trisodium–enhanced MRI of the liver with whole-body 18F-FDG PET in patients with adenocarcinoma of the colon or pancreas (29). Their reported sensitivities of 67% for PET and 81% for MRI were slightly lower than the sensitivities in our presented study. The marked increase in sensitivity of Gd-EOB-DTPA–enhanced MRI and PET/MRI over PET/CT in lesions measuring 1 cm or less in diameter is certainly due to the higher soft-tissue contrast of MRI than of PET/CT, as several studies have demonstrated (14,28,33). In addition, especially small liver lesions are hard to detect if no intravenous contrast medium is used for PET/CT. Another factor that may conceal these small lesions is the background noise and beam-hardening artifacts that are apparent using low-dose CT for PET/CT. Therefore, our results for the detection of small hepatic lesions by PET/CT may have been negatively influenced by the applied PET/CT protocol.
PET/MRI has been suggested mainly for brain malignancies so far (34,35), whereas our results show the potential use of PET/MRI in an oncologic setting. To the best of our knowledge, no studies have evaluated detection of liver metastases by retrospective PET/MR image fusion. The already high diagnostic confidence and sensitivity of Gd-EOB-DTPA–enhanced MRI in the detection and characterization of liver metastases showed that neither AUC for diagnostic accuracy nor sensitivity or diagnostic confidence differed significantly between Gd-EOB-DTPA–enhanced MRI and PET/MRI. This finding is due to the fact that Gd-EOB-DTPA–enhanced MRI alone already demonstrates high sensitivity and diagnostic accuracy in liver metastasis detection. However, in some cases, PET/MRI increased diagnostic confidence when compared with Gd-EOB-DTPA–enhanced MRI.
In liver metastases smaller than 1 cm, in which sensitivity for Gd-EOB-DTPA–enhanced MRI also drops, the addition of PET to Gd-EOB-DTPA–enhanced MRI is not of much benefit as such small lesions rarely show pathologic 18F-FDG uptake (27,36,37). However, a significant increase in diagnostic confidence of PET/MRI over PET/CT can be noted in lesions larger than 1 cm.
One limitation of our study is that PET/CT was obtained using a low-dose CT scan (40 mAs) without the administration of intravenous contrast material. Recently, 1 study has shown an increase in tumor-to-background ratio and hypermetabolic lesion diameter using a dual-time-point acquisition protocol for the liver (8). Therefore, our protocol was not optimized for the detection and characterization of liver metastasis. A multiphase contrast-enhanced CT scan with arterial and portal venous phase and dual-time-point PET acquisition would be preferred. Further studies, comparing optimized PET/CT versus Gd-EOB-DTPA–enhanced MRI and PET/MRI, are needed.
A second limitation of our study is that extrahepatic metastases were not evaluated and therefore no statement can be made about staging of patients. The ability to image the whole body is a major advantage of PET and PET/CT regarding staging and evaluation of extrahepatic disease (28,38–40). In our retrospective study design, we evaluated Gd-EOB-DTPA–enhanced MRI focusing on detection of intrahepatic metastases. Possible extrahepatic disease was not in the field of view of the Gd-EOB-DTPA–enhanced MRI examinations. As of now, a whole-body examination as obtained by PET/CT remains necessary for the detection of extrahepatic disease. Once hybrid PET/MRI systems for body imaging are commercially available, they will enable high sensitivity and specificity in the detection of liver metastases and will detect extrahepatic disease in the same examination—a promising feature for the evaluation of potential surgical candidates.
A third limitation of our study is its retrospective nature. However, the fact that our study was retrospective allowed us to show the feasibility of and good visual results for retrospective image fusion, even in patients for whom fusion of PET and Gd-EOB-DTPA–enhanced MRI was not intended at the time of acquisition and for whom, therefore, no specially prepared imaging protocols were applied.
A fourth limitation is the relatively small size of our patient sample. Our sample was small mainly for 2 reasons. First, Gd-EOB-DTPA is a relatively new contrast agent and therefore has been used in only a limited number of examinations. Second, we set a relatively short interval of 30 d between the PET/CT and Gd-EOB-DTPA–enhanced MRI acquisitions. This short interval was necessary to minimize the growth of liver metastases between imaging studies.
A final limitation is the inclusion of a patient who had hepatocellular carcinoma as the primary tumor. Hepatocellular carcinoma lesions are less 18F-FDG–avid than other malignancies. However, this particular patient did not present any secondary liver lesions and therefore did not falsify the results.
CONCLUSION
Our results suggest that, compared with PET/CT, Gd-EOB-DTPA–enhanced MRI and PET/MRI are more sensitive in the detection of liver metastases. The increase in detection is especially relevant in small liver metastases 1 cm or less in diameter. For lesions larger than 1 cm in diameter, diagnostic confidence was significantly better with PET/MRI than with PET/CT. However, compared with Gd-EOB-DTPA–enhanced MRI, the addition of functional information from PET did not significantly increase sensitivity or diagnostic confidence.
Footnotes
-
COPYRIGHT © 2010 by the Society of Nuclear Medicine, Inc.
References
- Received for publication July 17, 2009.
- Accepted for publication January 15, 2010.


