


Abstract
In the diagnosis of giant cell arteritis (GCA) with aortic involvement, 18F-FDG PET has been demonstrated to be a powerful tool. No other imaging method is able to directly detect acute inflammation within the aortic wall. However, because GCA is a rare PET indication, the assessment of GCA with 18F-FDG PET remains difficult and highly dependent on the experience of the investigator. This study aimed to semiquantify the relationship between aortic and liver uptake and to introduce a receiver operating characteristic (ROC)–based cutoff ratio to allow investigator- and experience-independent GCA diagnosis with optimal sensitivity and specificity. Ratios of aortic wall uptake versus liver uptake were calculated in a group of GCA patients and a control group. These data were assessed in an ROC analysis, and finally, a cutoff-ratio–optimizing strategy was applied. Methods: Twenty-three patients with initially suspected GCA (18 positive for GCA criteria, 5 negative) and 36 matched controls were included. The control subjects underwent PET for oncologic diagnostics. None had intrathoracic or hepatic disease or therapy-related tracer accumulation. Additionally, physiologic liver metabolism was ensured by the presence of normal liver enzymes. After defining regions of interest over the thoracic aorta and the liver, we calculated maximal standardized uptake value ratios. Sensitivities and specificities for cutoff ratios from 0.1 to 2.5 were estimated and were ultimately used to assess an optimal cutoff ratio for separating GCA patients from controls. To further investigate the usefulness of the resulting cutoff ratio, we tested it in a second control group with changed hepatic metabolism and elevated liver enzymes. Results: ROC analysis revealed optimal selectivity for a cutoff ratio of 1.0. This ratio led to a sensitivity of 88.9%, a specificity of 95.1%, and an accuracy of 94.4%. When this aorta-to-liver ratio was applied to the control group with pathologic liver metabolism, the resulting specificity was 95.6%. Conclusion: The 18F-FDG PET region-of-interest analysis with aorta-to-liver maximal standardized uptake value ratios is a reliable, investigator-independent indicator of GCA not affected by minor inflammation-associated changes in hepatic metabolism. Our results for a cutoff ratio of 1.0 prove that 18F-FDG PET is a method of high sensitivity and specificity for GCA-related large-vessel inflammation.
Giant cell arteritis (GCA) is the most common generalized vasculitis affecting medium and large vessels, with an incidence of 7–18 cases per 100,000 individuals (1,2). The American College of Rheumatology (ACR) has defined 5 criteria for establishing the diagnosis of GCA: an age of more than 50 y at onset, a new headache, abnormalities of the temporal artery on palpation, an elevated erythrocyte sedimentation rate, and histologic changes in a temporal artery. If at least 3 of these 5 criteria are present, the diagnosis is established with a high sensitivity of 93.5% and specificity of 91.2% (2). However, these results were acquired in a preselected population. Because the prevalence of at least 3 of these diagnostic criteria is fairly high in the general clinical setting, the specificity of the scoring system in that setting is limited to providing only a high negative predictive value (3).
Temporal artery biopsy is the cornerstone in the diagnostic work-up (1,2). However, the overall sensitivity of this procedure is low, with a high false-negative rate of 15%–40% (4). In addition, large-vessel involvement beyond the extracranial branches of the carotids is frequently evident, with an increased risk of the development of ischemic heart disease or thoracic aortic aneurysm with a fatal outcome (5–7). Pathophysiologic changes in the aortic wall and the superior branches of the aortic arch are challenging to diagnose and have until recently been underrecognized. To overcome this diagnostic shortcoming, a variety of noninvasive imaging techniques have been introduced in the diagnostic algorithms for functional and structural vessel changes: namely, CT, MRI, aortography, duplex ultrasound, and PET with 18F-FDG (1,8,9). However, only 18F-FDG PET is capable of functionally and directly assessing inflammatory changes within the vessel walls. Duplex ultrasonography, CT, and high-resolution MRI can demonstrate only indirect signs such as a periluminal halo or thickening of the vessel wall.
In the context of inflammatory vessel diseases, PET was introduced in 1999 (10). In recent years, a variety of case reports and observations have been published on a limited number of patients with prototypical 18F-FDG PET uptake patterns due to GCA (for a complete list, please contact the corresponding author). In a larger study of 22 consecutive GCA patients with additional vessel changes seen on duplex sonography, 18F-FDG PET demonstrated large-artery involvement in all patients with hypoechoic halo signs at large vessels but failed to detect inflammation restricted to the temporal arteries (11). Other studies explored the close correlation of GCA and polymyalgia rheumatica in terms of clinical symptoms and vessel uptake patterns (10,12). These surveys depicted a high rate of large-artery involvement in patients with a clinical diagnosis of polymyalgia rheumatica. Comparison of PET and MRI pointed to a higher sensitivity of the former when investigating inflammatory changes of the aortic subregions (13). In addition, 18F-FDG uptake correlated with laboratory measures of inflammation (erythrocyte sedimentation rate, C-reactive protein, leukocyte and thrombocyte counts, hemoglobin), as well as with these measures during administration of antiinflammatory therapy (13–16). Another focus was the use of 18F-FDG PET during follow-up and therapy control of GCA. A small series of reinvestigated patients receiving therapy indicated that follow-up PET is closely related to both clinical and biochemical responses (10,13,15,17–19).
All these PET studies on patient groups with vasculitis applied different diagnostic criteria to differentiate between affected and unaffected vessels. Some diagnoses were established solely on the basis of qualitative changes as revealed by experts in nuclear medicine (11,20). In addition to the qualitative rating, other studies introduced a scoring system ranging from no vessel visualization through minimal and increased tracer accumulation up to marked 18F-FDG uptake (10,12,18). An alternative relational analysis was adopted by visually comparing the arterial wall 18F-FDG uptake with hepatic uptake (13,15,16) or pulmonary uptake (19), followed by a qualitative 4-level scoring system ranging from 0 (no vessel uptake) to 3 (high-grade vessel uptake greater than that of the respective reference organ). Andrews et al. used a combined relational and qualitative rating strategy by initially calculating the ratio of the maximal standardized uptake value (SUVmax) in a region of interest (ROI) of the affected vessel divided by the SUVmax of a pulmonary ROI (17). In a second step, these results were assigned to a 4-level scoring system ranging from no increase to greatly increased uptake. Finally, Moosig et al. analyzed their data in a semiquantitative way, placing ROIs over defined vascular areas and a peripheral lung area (14). In summary, different strategies have been applied to establish the diagnosis of vasculitis, but most were not suitable for broader clinical use because of high susceptibility to interobserver variability and investigator experience.
Hence, the aim of our study was to introduce a semiquantitative measure that permits the diagnosis of large-vessel arteritis with high sensitivity and specificity. To this end, we extended the relational approach comparing arterial wall and liver uptake by defining vessel and hepatic ROIs and quantifying the respective SUVmax. The liver as reference organ was preferred over the lungs because of the homogeneous 18F-FDG distribution of the former and its higher intra- and intersubject reliability in 18F-FDG accumulation (21–23). Then, ratios of SUVmax were calculated in a patient group with an initial tentative diagnosis of GCA and a control group with physiologic hepatic metabolism. Finally, a receiver operating characteristic (ROC) curve was computed to identify the cutoff ratio that had optimal sensitivity and specificity. However, because GCA is frequently accompanied by changes in hepatic metabolism, with increases of γ-glutamyl transferase (GGT), aspartate aminotransferase (AST), or alanine aminotransferase (ALT) (24), and 7 of 18 patients finally diagnosed with GCA demonstrated this liver enzyme elevation, we further tested the resulting cutoff ratio in a second control group with changed liver metabolism as revealed by increased liver enzyme serology in order to validate the robustness of the analysis in a less preselected clinical setting.
MATERIALS AND METHODS
Patients
GCA Group.
Between October 2003 and August 2007, 23 patients (19 women and 4 men; mean age, 64.3 ± 5.7 y) fulfilling at least 3 of 5 ACR criteria were referred to our PET center with a tentative diagnosis of GCA and suspected large-vessel involvement. Detailed clinical data are given in Table 1. In 18 (15 women and 3 men), GCA was finally confirmed by an additional diagnostic work-up including biopsies, duplex sonography, and other angiographic diagnostics. In most patients with 3 or more of the ACR criteria and positive findings on duplex sonography (which further support the diagnosis of GCA), a temporal artery biopsy was not performed. This combined noninvasive diagnostic approach appears justifiable given the high sensitivity (87%) and specificity (95%) of duplex sonography (25). In 3 patients, the final diagnosis was established by the combination of ACR criteria and aortography and CT (patients 6 and 14) or MRI (patient 16). These 18 patients were regarded as GCA true-positive patients. Of the remaining 5 patients, 1 was finally diagnosed with a paraneoplastic syndrome due to malignant melanoma, 1 with rheumatoid arthritis, 2 with elevated erythrocyte sedimentation rate/C-reactive protein with no detectable cause despite an extensive work-up, and 1 with polymyalgia rheumatica. These 5 patients were regarded as GCA true-negative. At least 1 liver enzyme (GGT, AST, or ALT) was elevated in 7 of 18 GCA true-positive patients (Table 1). To correct for interlaboratory reference range differences, we calculated the liver enzyme levels as a percentage of the upper threshold value (100% means the upper threshold). In those 7 GCA patients with altered hepatic metabolism, GGT was 208% ± 138% of the upper reference range, AST 107% ± 44%, and ALT 143% ± 88%.
GCA Group: Detailed Clinical Patient Data
Control Group I.
Thirty-six patients (30 women and 6 men; mean age, 64.3 ± 5.5 y) served as an age- and sex-matched control group. They underwent PET for oncologic reasons. The inclusion criteria were no previous history of mediastinal, pulmonary, or liver involvement by malignancy and no pathologic thoracic or hepatic 18F-FDG uptake in terms of metastasis. To avoid uncontrolled effects on the ratio induced by general changes in hepatic metabolism, we selected only those patients with liver enzymes (GGT, AST, and ALT) within the reference ranges.
Control Group II.
To test for a potential analytic bias induced by selecting controls with normal liver function, we included a second control group comprising a further 18 age- and sex-adapted patients (14 women and 4 men; mean age, 62.2 ± 7.9 y) with at least 1 pathologically elevated liver enzyme (GGT, AST, or ALT). As in the GCA group, liver enzyme levels were reported as a percentage of the upper threshold value. All other inclusion criteria were analogous to those applied to control group I. In this second control group, the optimal cutoff ratio taken from the ROC analysis of the GCA group and control group I was applied to test the specificity of that ratio in less carefully selected patients.
18F-FDG PET
A dedicated full-ring PET scanner (ECAT EXACT HR+; Siemens) with an axial field of view of 15.5 cm was used for data acquisition. Before undergoing scanning, patients fasted for at least 8 h. Immediately before 18F-FDG injection, their blood glucose level was tested to ensure normoglycemia. All patients were euglycemic, and no one received insulin to reduce blood glucose to normal levels. After injection of 361 ± 54 MBq (GCA group), 348 ± 35 MBq (control group I), or 374 ± 47 MBq (control group II) of 18F-FDG, plus 20 mg of furosemide for diuresis, patients were asked to drink 700 mL of water. One hour later, emission and transmission scans (a total time of 10 min per bed position, two thirds of that time being for emission scanning and one third for transmission scanning) in 3-dimensional mode were collected from the mid thigh to the base of the skull. All images were iteratively reconstructed and corrected for attenuation.
Region-of-Interest Analysis and Semiquantitative Ratio
On axial slices, circular ROIs including the vessel lumen were placed over the ascending aorta, the aortic arch, and the thoracic part of the descending aorta to assess the maximal aortic 18F-FDG uptake. The exact ROI location was additionally confirmed by the coronal and sagittal views (Fig. 1). In both the GCA group (transverse views, Figs. 1C and 1D) and the control groups (transverse views, Figs. 1A and 1B), the ascending aorta, the aortic arch, and the thoracic part of the descending aorta were for the most part distinguishable from the surrounding tissues and organs. While we were placing the ROIs within the mediastinum, we directed special attention to carefully excluding adjacent bone marrow or myocardial 18F-FDG uptake near the descending aorta. However, both structures were easily identifiable when we were confirming the location of the ROI on the additional coronal and sagittal slices.

18F-FDG PET images and SUVmax ratios of selected patients: patient from control group I with no history of atherosclerosis (A), patient from control group I with atherosclerosis of aorta and iliac arteries (confirmed by CT) (B), and GCA patients 3 (C) and 13 (D), both of whom had histologically proven GCA. On axial views, ROIs (black lines) were drawn over aortic arch (A–C) and ascending and descending parts of aorta (D). On coronal and sagittal views, arrows indicate 18F-FDG uptake into aortic vessel wall. Coronal view of B additionally shows uptake into iliac vessel wall.
Reference ROIs were placed on contiguous 2-dimensional axial slices covering the whole liver, resulting in a 3-dimensional assessment of the maximal intrahepatic 18F-FDG uptake. In this respect, special attention was paid to adjacent 18F-FDG–accumulating structures such as the stomach, the transverse colon, and the upper right renal pole to exclude extrahepatic uptake in the ROIs that might interfere with the subsequent SUVmax estimation.
SUVmax was then calculated for both the aorta and the liver by correcting the counts per gram of tissue for injected dose and body weight. At first, the SUVmax was determined separately for every axial ROI. From these 2-dimensional ROI-based values, the highest was chosen to represent the SUVmax for the aorta and the liver, respectively. Afterward, the ratio of the aortic SUVmax divided by the hepatic SUVmax was determined for every patient.
Statistics
After testing for normality (Kolmogorov-Smirnov test), we estimated group differences in age, injected 18F-FDG dose, vessel uptake, and hepatic uptake, as well as the aorta-to-liver ratio, by applying 2-sided unpaired t tests.
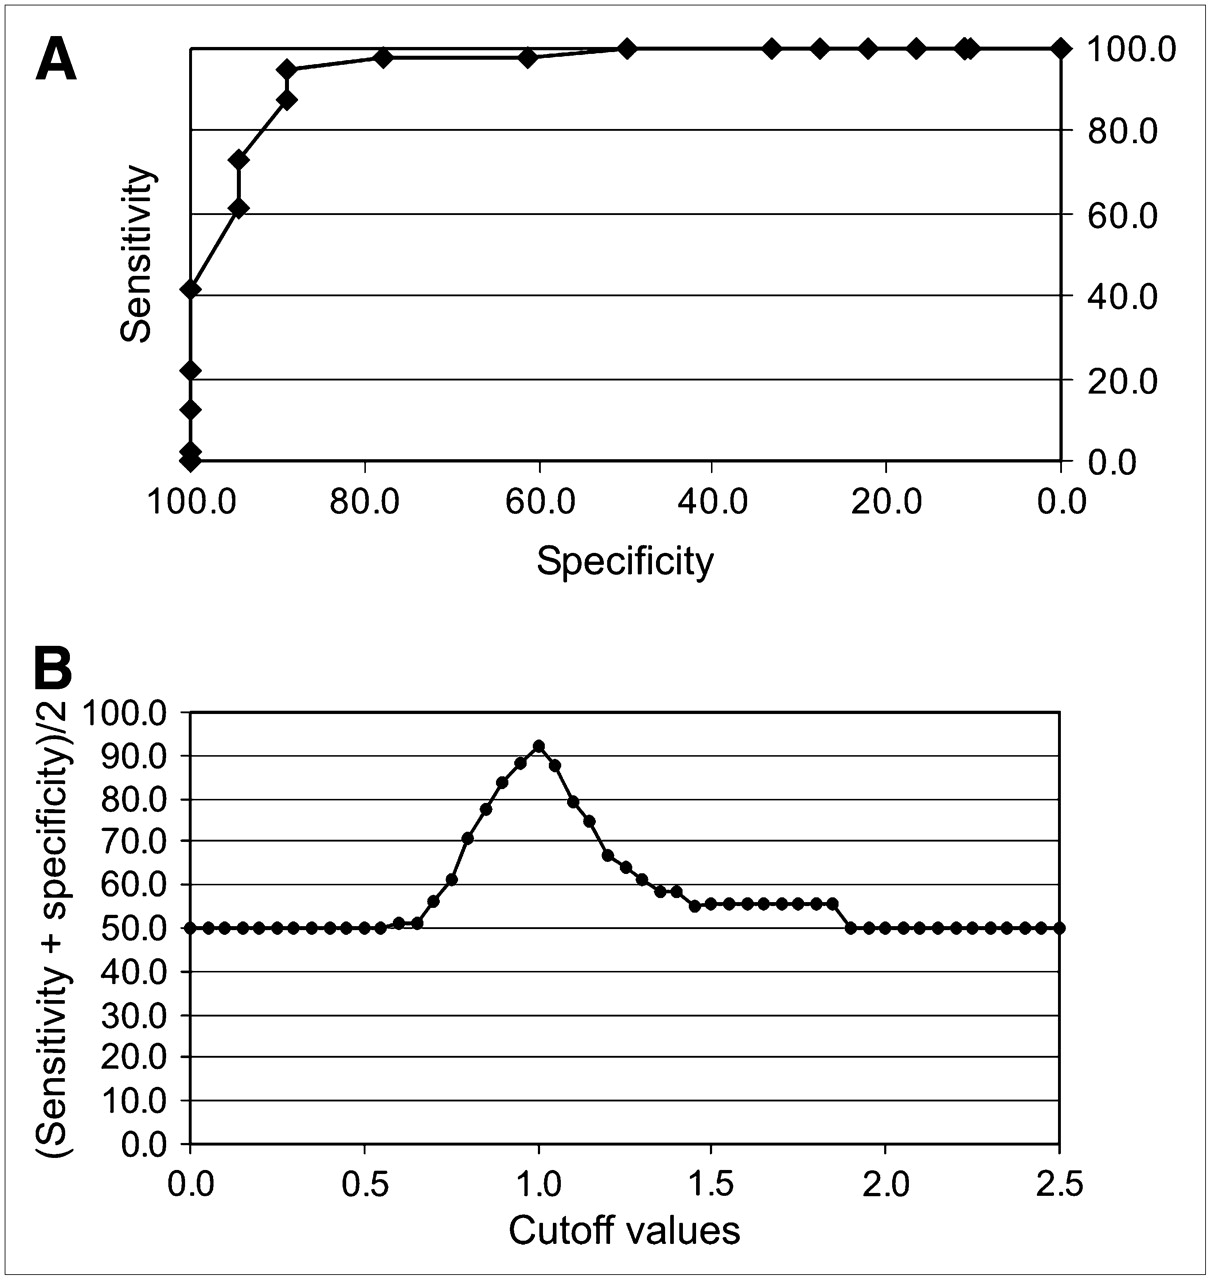
For the ROC analysis, sensitivities and specificities for different cutoff points were calculated within a ratio range of 0.1–2.5 using the GCA and control group I. This calculation was followed by a cutoff optimization strategy in accordance with the guidelines of the Clinical and Laboratory Standards Institute (CLSI/NCCLS) (26). In essence, the sums of the corresponding sensitivity and specificity for any given cutoff point divided by 2 were collected. Then, the cutoff point with the peak value was regarded as the aorta-to-liver ratio with an optimal relationship between sensitivity and specificity.
For the resulting optimal aorta-to-liver ratio, accuracy and the corresponding positive and negative predictive values were determined, first for the given GCA prevalence of 30.5% in our study (comparison of GCA group vs. control group I) and then for a GCA prevalence of 17%, as had been reported for a patient group with fever of unknown origin (FUO) and an age of more than 50 y (27).
Finally, the established optimal ratio was additionally tested for a presumptive metabolic susceptibility due to biochemical liver changes. Therefore, the GCA group was compared with control group II.
RESULTS
Comparison of GCA Group and Control Group I
The GCA group and control group I did not show any significant differences in age (P = 0.49) or injected dose (P = 0.43).
In the GCA true-positive group, the mean aortic SUVmax was 3.0 ± 0.8 and the hepatic SUVmax 2.5 ± 0.5 (Figs. 1C and 1D), whereas in control group I, the corresponding values were 2.3 ± 0.5 and 2.7 ± 0.5, respectively (Figs. 1A and 1B). Unpaired t tests revealed a highly significant group difference in the vessel SUVmax (P < 0.01), whereas the intergroup difference in liver SUVmax was not significant (P = 0.13). The aorta-to-liver ratio was 1.21 ± 0.28 in the GCA group and 0.84 ± 0.11 in control group I (P < 0.01).
Applying the CLSI/NCCLS guidelines, we found that an optimal relationship of sensitivity to specificity was achieved at an aorta-to-liver ratio of 1.0 (Fig. 2B). For this cutoff point, the ROC analysis revealed a sensitivity of 88.9% and a specificity of 95.1% (Fig. 2A). The corresponding accuracy was 93.2%.

(A) ROC analysis comparing GCA group with control group I: at cutoff of 1.0, sensitivity was 88.9% and specificity was 95.1%. (B) Cutoff optimization according to CLSI/NCCLS guidelines.
In the GCA group and control group I, the GCA prevalence was 30.5% (18 true-positive GCA cases of a total of 59 patients). For this given prevalence, the positive predictive value was 88.9% and the negative predictive value 95.1%. Recalculating the predictive values on the basis of 17% GCA prevalence (27) resulted in a positive predictive value of 78.8% and a negative predictive value of 97.7%.
Comparison of GCA Group and Control Group II
In control group II, GGT was 204% ± 115% of the upper reference range, AST 113% ± 62%, and ALT 103% ± 57%.
Similar to the first comparison, the GCA group and control group II did not show any significant differences in age (P = 0.36) or injected dose (P = 0.38). However, the hepatic SUVmax (3.1 ± 0.7) of control group II was significantly higher than that of the GCA group (P < 0.02), whereas the vessel SUVmax (2.7 ± 0.7) did not differ between these 2 groups (P = 0.30). Comparison of the aorta-to-liver ratio of the GCA group (1.21 ± 0.28) and control group II (0.89 ± 0.11) revealed a significant difference (P < 0.01).
Applying the aorta-to-liver ratio of 1.0 to distinguish the GCA group from control group II revealed a specificity of 94.4% and an accuracy of 91.7%.
DISCUSSION
The proposed semiquantitative ROI analysis for establishing the diagnosis of large-vessel inflammation with the aid of 18F-FDG PET is an observer- and experience-independent approach. Placing appropriate ROIs over the aortic wall solely requires knowledge of the anatomic structures in the mediastinum. In this respect, attention should be drawn to bone marrow and myocardial 18F-FDG accumulation by verifying the exact location of the ROIs in all 3 dimensions. For a patient group with GCA and a control group, the ROC curve revealed an optimal cutoff ratio of 1.0 between large-vessel and hepatic 18F-FDG uptake, with high sensitivity and specificity. Therefore, this ROI analysis is appropriate for use in a clinical context, especially in patients with unspecific symptoms such as FUO or other inflammatory signs. In contrast, the more simplistic method of relating vessel uptake to hepatic uptake by pure inspection and by using the cutoff score “vessel similar to liver uptake” proposed earlier to separate affected from unaffected patients results in a false-positive rate of up to 35% (13).
Despite the fact that GCA involves additional larger arteries, ROIs were located over the thoracic parts of the aorta only. This choice was made for several reasons. First, the subclavian arteries, which are frequently affected by GCA (9,18), were not included because of the fact that in control subjects a reliable identification is almost impossible. In this regard, the use of PET/CT with direct anatomic coregistration would be beneficial. Second, even in the case of correct localization of the subclavian arteries, one needs to consider partial-volume effects, which might confound SUVmax and subsequent ratio calculations. Third, the abdominal aorta was not included either, because Lie reported a preferential involvement of the thoracic aorta in GCA (6). In a histopathologic study exploring 1,204 surgically removed aorta specimens, aortitis occurred in 4.3% of all cases (28). Among these cases, 96% were confined to the thoracic aorta. A postmortem survey found that 87% of all nonsyphilitic cases of aortitis were within the thoracic region (29). In contrast, atherosclerosis emerges more frequently in the abdominal aorta (Fig. 1B) (28).
Differentiation between inflamed arterial plaques due to atherosclerosis and vasculitis remains a major issue in vascular 18F-FDG uptake. Autoradiographic and animal studies demonstrated a close correlation between 18F-FDG uptake and macrophage infiltration of atherosclerotic plaques (30,31). In humans, Dunphy et al. found an overall increase in aortic 18F-FDG uptake in 74% of their patients, whereas Tatsumi et al. reported a focal increase in uptake in 56% (32,33). Investigating the abdominal aorta, the iliac arteries, and the femoral arteries, Yun et al. demonstrated increased 18F-FDG uptake in 51%, 51%, and 63% of the cases, respectively, and related this increase to possible atherosclerotic changes (34). In addition, a correlation between 18F-FDG vessel uptake and age was observed. A careful evaluation of every patient was recommended, taking into account possible risk factors and the distribution of pathologic arterial uptake, with thoracic vessel accumulation being more predominant in vasculitis, and iliac, femoral, and distal vessel accumulation being more predominant in atherosclerosis (35). At least part of the arterial 18F-FDG uptake in our control group might be attributable to atherosclerosis. In fact, Figure 1B depicts a 69-y-old woman from control group I with CT-confirmed atherosclerosis of the aorta and iliac arteries and a focally distributed 18F-FDG uptake pattern into these vascular structures as mentioned by Tatsumi et al. (33). Comparing the 18F-FDG distribution in this case of proven atherosclerosis with that of GCA patients showed that differentiation was possible not only by the dichotomy of focal versus distributed 18F-FDG uptake but also by the semiquantitative ROI analysis. If the degenerative changes in the arterial wall were to unfavorably influence the ROI analysis, a major portion of control subjects would demonstrate high aortal SUVmax and consequently an aorta-to-liver ratio of 1.0 or more. However, aortic uptake was significantly smaller in control group I than in the true-positive GCA group (P < 0.01), and only 2 control subjects had an aortohepatic ratio of 1.0 or more. Besides this indirect evidence of a potential differentiation between vasculitis and atherosclerosis by 18F-FDG PET and our proposed ROI analysis, a comparison of GCA patients with a group of histologically proven atherosclerotic patients is required to directly address this question.
Choosing the liver as a reference organ might compromise the SUVmax-based semiquantitative approach if changes in hepatic metabolism occur. Varying insulin levels have been shown to alter hepatic 18F-FDG uptake (36), and it is not known how pathologic changes in liver metabolism leading to slight to moderate liver enzyme increases might influence SUVmax. Because concomitant elevations of liver enzymes frequently occur in GCA (24), we further validated our relational approach with a second control group of patients, who had elevated liver enzymes but otherwise matched the GCA group and the first control group in sex and age. Interestingly, the cutoff ratio of 1.0 also reliably differentiated GCA patients from these unaffected patients in control group II with high sensitivity and specificity. This result proves the method to be valid even under more realistic conditions in a clinical setting without highly preselected control groups. However, caution is needed in diabetic patients receiving insulin therapy because hyperinsulinemia induces increased hepatic 18F-FDG uptake (36).
Regarding future prospects for 18F-FDG PET as a possible screening tool in complex diagnostic settings, increasing evidence points to considerable value in FUO (37–39). Accordingly, PET soon will be more frequently applied for this special use. Because large-vessel vasculitis contributes about 6% in an unselected population of FUO patients and up to 17% in elderly FUO patients, nuclear medicine specialists need to be well aware of this differential diagnosis (27,40). Therefore, a routine investigator-independent strategy for establishing the diagnosis with high accuracy is mandatory. When corrected to the 17% reported prevalence of vasculitis in elderly FUO patients, the positive and negative predictive values obtained with the present method remain reliable, at 78.8% and 97.7%, respectively.
Finally, extending a previous study on GCA treatment effects (18), it appears worthwhile to introduce and validate the proposed SUVmax-based analysis in the follow-up of GCA patients for potential use in monitoring therapy.
CONCLUSION
The presented ROI-based semiquantitative analytic technique relating aortic SUVmax to liver SUVmax for the diagnosis of GCA with large-vessel involvement is easy to use and has high sensitivity and specificity, even in patients with altered hepatic metabolism other than hyperinsulinemia.
Footnotes
-
COPYRIGHT © 2008 by the Society of Nuclear Medicine, Inc.
References
- Received for publication February 19, 2008.
- Accepted for publication April 3, 2008.


Jump to section
Related Articles
Cited By...
- Comparing Semiquantitative and Qualitative Methods of Vascular 18F-FDG PET Activity Measurement in Large-Vessel Vasculitis
- Imaging in diagnosis, outcome prediction and monitoring of large vessel vasculitis: a systematic literature review and meta-analysis informing the EULAR recommendations
- Positron Emission Tomography/Computerized Tomography in Newly Diagnosed Patients with Giant Cell Arteritis Who Are Taking Glucocorticoids
- Positron emission tomography assessment of large vessel inflammation in patients with newly diagnosed, biopsy-proven giant cell arteritis: a prospective, case-control study
- Imaging of Inflammation by PET, Conventional Scintigraphy, and Other Imaging Techniques
- Letter by Lensen et al Regarding Article, "Anti-Tumor Necrosis Factor-{alpha} Therapy Reduces Aortic Inflammation and Stiffness in Patients With Rheumatoid Arthritis"
- Increased Metabolic Activity Highlighted by Positron Emission Tomography/Computed Tomography in the Wall of the Dissected Ascending Aorta in a Patient With Horton Disease
- EANM/SNMMI Guideline for 18F-FDG Use in Inflammation and Infection
- 18F-Fludeoxyglucose PET/CT in the evaluation of large-vessel vasculitis: diagnostic performance and correlation with clinical and laboratory parameters
- Imaging of Inflammation by PET, Conventional Scintigraphy, and Other Imaging Techniques
- Imaging Atherosclerotic Plaque Inflammation by Fluorodeoxyglucose With Positron Emission Tomography: Ready for Prime Time?