


Abstract
In this study, we compared the diagnostic performance of the standard SPECT with motion-frozen (MF) myocardial perfusion SPECT (MPS) in obese patients. Methods: A total of 90 consecutive obese patients (body mass index, 30.1–46.8, average, 34.3 ± 3.6; age, 63 ± 12 y; 30% women) underwent standard supine rest 201Tl/stress 99mTc dual-isotope gated MPS and cardiac catheterization within 3 mo. MF images were obtained by nonlinear warping of cardiac phases to the end-diastolic position. Total perfusion deficit (TPD) was obtained for summed (S-TPD) and motion-frozen (MF-TPD) datasets with sex-specific standard and MF normal limits. Results: The area under the receiver-operating-characteristic (ROC) curve for detection of coronary artery disease (CAD) by MF-TPD was significantly larger than that for S-TPD (0.93 ± 0.25 vs. 0.88 ± 0.32, P < 0.05). MF-TPD had higher specificity (77% vs. 55%, P < 0.05) and accuracy (89% vs. 80%, P < 0.05) than did S-TPD. Conclusion: MF processing of MPS improves CAD detection in obese patients.
- gated SPECT
- myocardial perfusion
- image registration
- image warping
- coronary artery disease
- motion correction
We have previously shown that it is feasible to correct gated myocardial perfusion SPECT (MPS) for cardiac motion using the motion-frozen (MF) technique (1). This technique tracks the left ventricle (LV) through all cardiac phases and subsequently shifts the counts from most phases of the cardiac cycle (excluding the systolic frames) to the end-diastolic (ED) position by means of nonlinear image warping. Such warped images are summed to provide perfusion images registered to the ED phase. We have shown that with the MF approach we can obtain higher-quality images than with the standard summation of gated frames (1).
In obese patients, image quality of summed MPS images is often problematic because of count-poor perfusion images in each phase (blurring caused by cardiac motion), which is further complicated by differences between systolic and diastolic phase photon attenuation. Therefore, we hypothesized that the use of the MF technique in the obese population with body mass index (BMI) greater than or equal to 30 could improve the diagnostic performance of quantitative MPS for detection of coronary artery disease (CAD).
MATERIALS AND METHODS
Patient Population and Acquisition Protocols
Healthy Database Population.
Normal limits were obtained retrospectively from a group of 80 patients (40 women, 40 men) with a very low likelihood of CAD (<5%) as previously described (2). Separate male and female normal limits were created for standard summed perfusion data from summed short-axis images and for MF MPS data using 16-frame gated MPS data. Normal limits were created for the general population and were not BMI-matched; however, we have previously shown that normal limits for high and low BMI groups are not significantly different (3).
Test Patient Population.
We studied 90 consecutive obese patients (BMI, 30.1–46.8; average, 34.3 ± 3.6) without known CAD, who underwent both standard supine rest 201Tl/stress 99mTc dual-isotope gated MPS and cardiac catheterization within 3 mo. Clinical characteristics are listed in Table 1.
Characteristics of Obese Patients Comprising Study Population
Acquisition and Reconstruction Protocols.
MPS acquisitions were obtained using noncircular orbits and 64 projections over 180° (45° right anterior oblique to 45° left posterior oblique) at 25 s/projection for 99mTc-sestamibi and 35 s/projection for 201Tl images (4). MPS images were acquired by 1 of 2 cameras (ADAC Forte or Vertex; Philips, and e.cam; Siemens). All images were subject to standard clinical quality-control measures. No attenuation or scatter correction was used. After reconstruction of gated data with filtered backprojection (FBP), image reconstruction was performed with a Butterworth filter (cutoff, 0.83 cycles/cm; order, 5), and short-axis slices were automatically generated (5). Iterative ordered-subset expectation-maximization reconstruction was performed for summed perfusion data. A total of 29 patients had 16-frame gated MPS; 61 patients had 8-frame gated MPS.
Coronary Angiography.
Coronary angiography was performed with the standard Judkins approach, and all coronary angiograms were interpreted visually by 2 experienced physicians who were unaware of MPS results. Coronary angiographic findings are presented in Table 2.
Angiographic Characteristics
MF Technique
The MF technique, which has been described previously (1), used automatically derived LV contours (6–8) in combination with thin-plate spline image warping. Image data from 63% of the cardiac cycle were used, excluding 3 phases for 8-frame MPS or 6 phases for 16-frame MPS closest to the end-systolic phase. These parameters were previously established for optimal image quality (1). Nonlinear image warping of selected cardiac phases to the spatial position of the ED phase is subsequently performed on the basis of the 3-dimensional displacement vectors (9).
Automated Perfusion Quantification.
Summed and MF total perfusion deficit (S-TPD and MF-TPD, respectively) parameters were automatically derived and calculated on the basis of sex-specific normal limits obtained from the same healthy population using standard Cedars-Sinai software (10), with previously established criteria for abnormality (11). The same average deviation threshold (3.0) was used for summed and MF images. The MF-TPD and S-TPD parameters were expressed in the same units (percentage of myocardium). The 17-segment American Heart Association model (12) was used to display the quantitative distribution of both summed and MF perfusion studies.
Statistical Analysis
All continuous variables are expressed as a mean ± 1 SD. Paired t tests were used to compare the differences in the paired continuous variables. A P value of less than 0.05 was considered significant. For all statistical analysis tasks, we used analysis software (Analyze-It, version 1.71; Analyze-It Software, Ltd.). The receiver-operating-characteristic (ROC) curves were created to analyze the diagnostic performance of standard and MF-TPD for detection of ≥70% or ≥50% stenosis. The Hanley and McNeil method (13) was used for comparing curves, because all the tests were performed on the same subjects. Analyze-It generated the ROC curves with 40–50 threshold points, depending on the data.
RESULTS
Average computing time for MF image creation was 5.1 ± 2.2 s for the 16-frame study, with the software implemented in C++ language on a Windows platform (XP Professional operating system [Microsoft] and Pentium 4 processor [Intel]; 2.80 GHz, 2 GB of RAM).
In 7 of 90 patients, which included four 8-frame gated MPS studies and three 16-frame gated MPS studies, manual adjustment of the LV contours derived from gated MPS data was required for MF analysis, whereas in 12 ungated LV contours, which included eight 8-frame gated MPS studies, manual contour correction was needed for summed perfusion analysis. None of the patients in the healthy database population required any manual adjustment.
Average segmental count distributions derived from sex-specific normal databases are presented in Figure 1. The average count distributions are significantly different between MF and standard databases in 6 of 17 segments in male and 7 of 17 segments in female patients studied. MF normal perfusion distribution in the apex shows a relative decrease in both sexes, whereas the basal anterior, lateral, and inferior walls of MF analysis show significant relative count increases in both sexes.
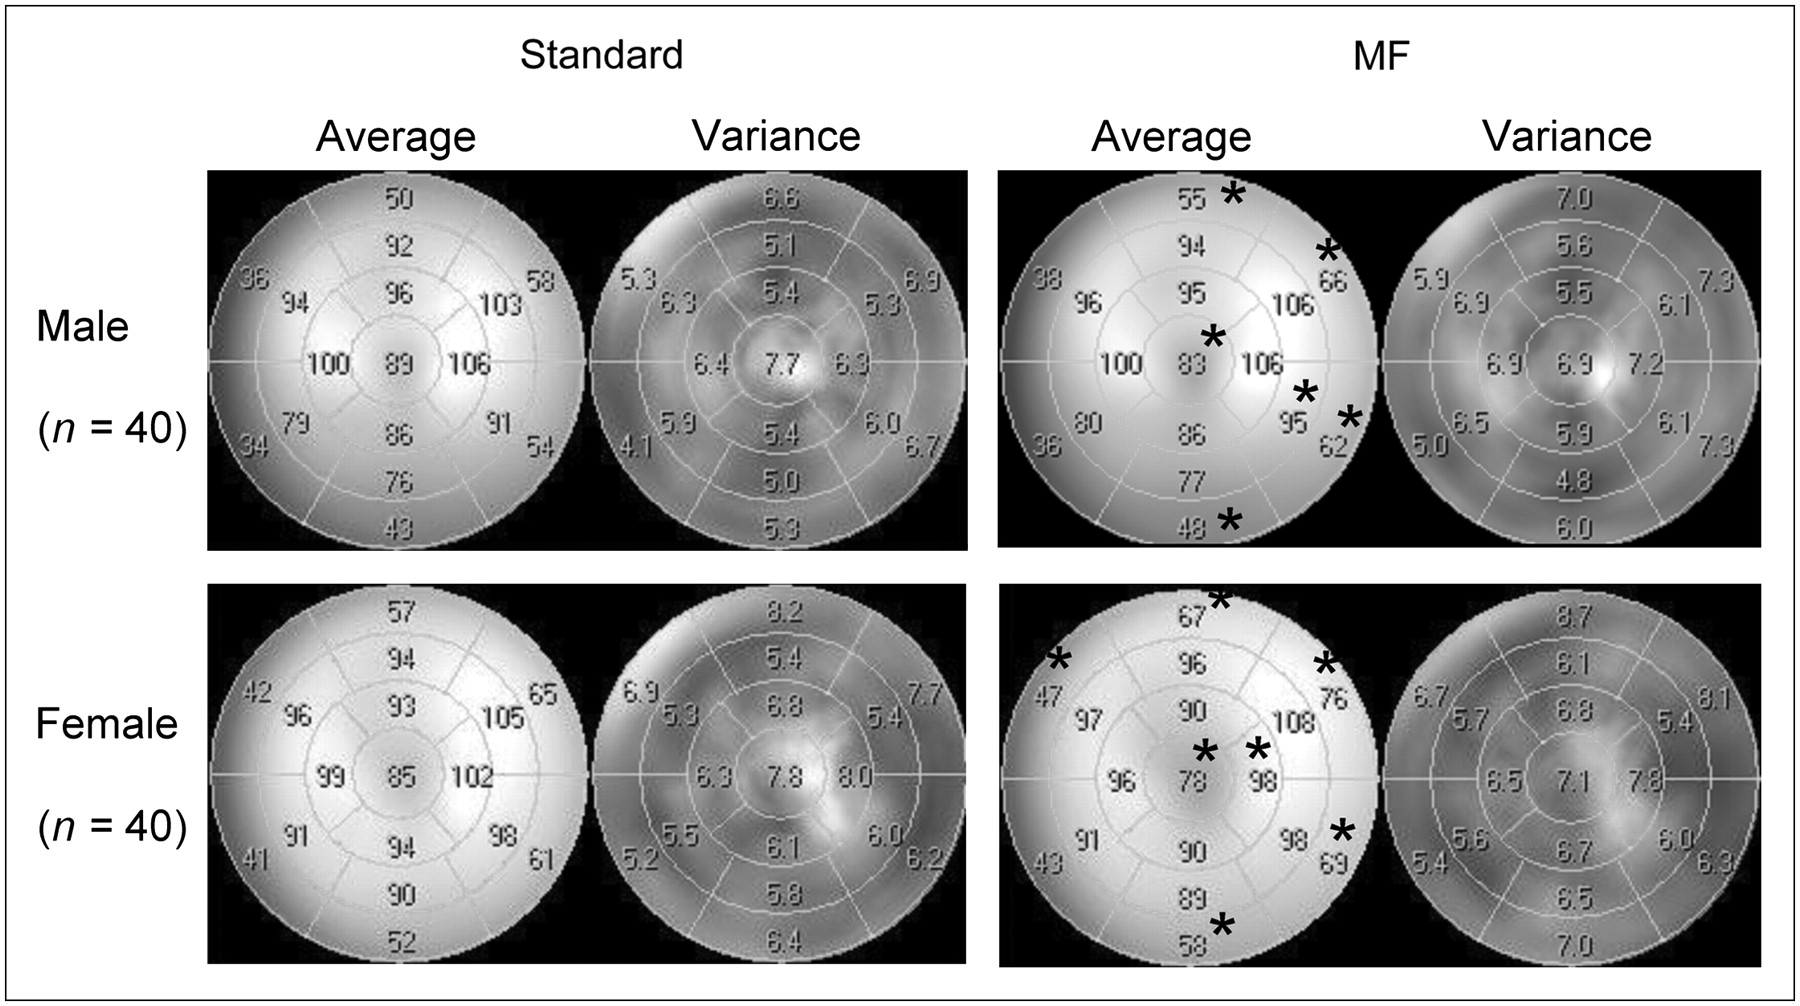
Segmental comparison of sex-specific standard and MF normal limits for male and female patients. Asterisks in polar-map segments denote significant differences between standard and MF databases (P < 0.05).
The average TPD values in the healthy population and patients with a likelihood of CAD, as defined by coronary angiography, were significantly smaller for MF-TPD than for S-TPD in the healthy group (3.9% ± 2.6% vs. 5.2% ± 3.4%, P = 0.0003) and in patients with significant CAD (14.1% ± 7.9% vs. 15.9% ± 9.1%, P < 0.0001). The ROC curves for detection of CAD by MF-TPD and S-TPD are shown in Figure 2. The areas under the ROC curves for detection of CAD by MF-TPD and S-TPD were 0.93 ± 0.025 versus 0.89 ± 0.032 (P = 0.014) for ≥70% stenosis and 0.94 ± 0.024 versus 0.88 ± 0.033 (P = 0.006) for ≥50% stenosis, respectively.

ROC curves for detection of ≥50% stenosis (A) and ≥70% stenosis (B) by measures of S-TPD and MF-TPD in obese patients (n = 90).
The previously established threshold of 5% for the TPD (2) was applied as the criterion for abnormality. Figure 3 demonstrates diagnostic performance using this cutoff value for detection of CAD with ≥50% (Fig. 3A) and ≥70% (Fig. 3B) stenosis criteria. Although sensitivity was the same, MF-TPD showed significantly higher specificity (P < 0.05) than did S-TPD, resulting in a significant increase in overall accuracy (P < 0.05).
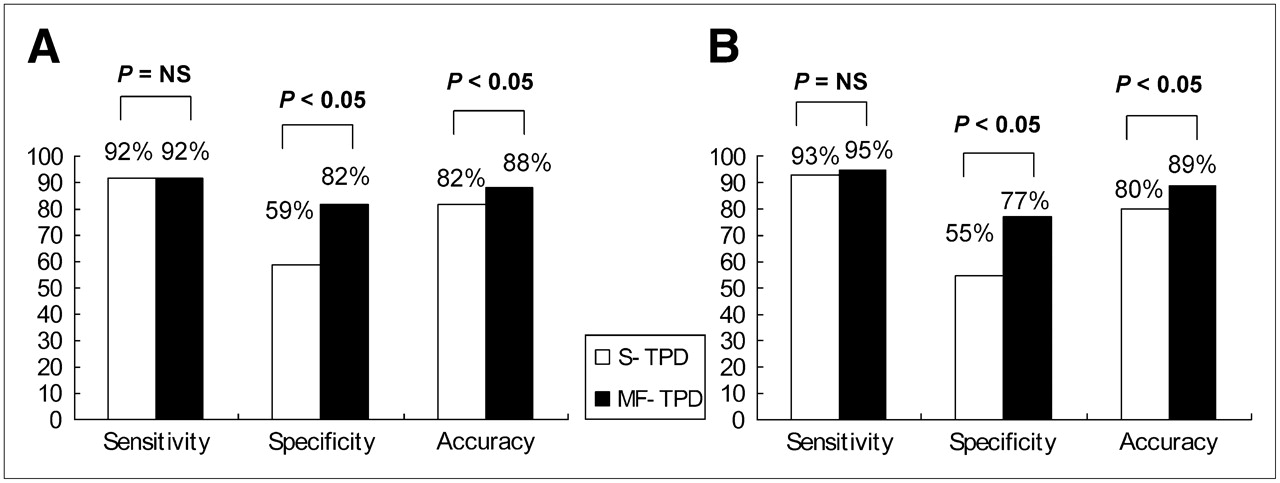
Sensitivity, specificity, and accuracy for detection of CAD with ≥50% stenosis criterion (A) and ≥70% stenosis criterion (B) by S-TPD and MF-TPD in obese group. NS = not significant.
In 6 of 27 patients without ≥50% stenosis and in 7 of 31 patients without ≥70% stenosis, MF analysis corrected false-positive standard results. There were no false-positive MF-TPD results corrected by S-TPD for detection of ≥50% or ≥70% stenosis. Concordance and discordance between S-TPD and MF-TPD results are shown in Table 3. Patient characteristics for each of the cases in which false-positive S-TPD was corrected by MF-TPD are presented in Table 4. An example of a study with normal coronary angiography findings but in which MF-TPD corrected a false-positive S-TPD finding is shown in Figure 4.

An example of false-positive summed perfusion results corrected by MF analysis in 68-y-old asymptomatic woman with hypertension, hypercholesterolemia, and ST depression during adenosine stress. Subsequent coronary angiogram showed no significant stenosis. Her left ventricular ejection fraction at stress was 76%. Selected stress images are shown in distal (apical) short axis (SA), mid-horizontal long axis (HLA), and mid-vertical long axis (VLA). MF perfusion images appear larger than summed images because they are warped to ED position. MF images show brighter anterior and lateral wall from base to midsegments than standard perfusion images. On VLA and SA, MF images show brighter distal anterior wall than standard summed image, whereas MF images show count reduction in apex likely due to anatomic apical thinning. Quantitative analysis (right) shows insignificant apical thinning on MF MPS (TPD 3%) and significant defect in same location on standard MPS data (TPD 8%).
Concordance and Discordance Between S-TPD and MF-TPD Results
Characteristics of Patients Who Had False-Positive S-TPD Corrected by MF-TPD for Detection of ≥70% Stenosis
DISCUSSION
Blurring of gated images in the process of forming an ungated summed perfusion image is a source of reduced image quality in MPS. To improve the diagnostic performance of nuclear cardiology studies in obese patients, we have applied the previously developed MF technique, which allows recovery of the resolution lost by cardiac motion (1). We have used previously established methods for creating normal limits (2) and derived them from MF scans of patients with a low likelihood of CAD. We have compared the diagnostic performance of automatically derived MF-TPD and S-TPD parameters from MF and summed images, respectively. We demonstrated a significant improvement of specificity and unchanged sensitivity for the MF technique, compared with the standard technique, in detection of CAD.
In the present study, the majority (67%) of the MPS data in the obese patient group were the 8-frame gated data. On the basis of the number of studies that needed the adjustment of the contours in the 8-frame and 16-frame groups, 8-frame gated MPS does not affect the accuracy of contour detection. Count distribution of myocardial perfusion in the healthy population derived with MF processing differed from the summed count distribution in the same population (Fig. 1). Relative counts for MF normal limits, compared with standard limits, were higher in both sexes in basal anterior, lateral, and inferior segments, whereas they were lower in both sexes in apical segments. This reduction of the counts in the apical region in the MF healthy population appears to be consistent with the anatomic apical thinning (14); consequently, count reduction in some adjacent lateral wall segments in the female patients can be explained by partial-volume effects (PVEs). Therefore, one potential reason for the improvement of accuracy by MF processing is a more correct depiction of apical thinning in the MF images. Thus, the increased relative activity in the basal area (Fig. 1) may be related to the significant motion of the valve plane along the long axis of the LV and consequently blurred perfusion, resulting in reduced basal counts when ED and end-systolic frames are summed without MF correction.
In this study, FBP reconstruction was applied to gated data before MF processing, whereas static summed perfusion data were reconstructed with iterative techniques according to our standard protocols; raw gated data were not available in all cases for reprocessing. Although FBP is often used in the clinical setting because computational time is shorter, especially for 16-frame gated studies, iterative reconstruction may further add diagnostic advantage to MF analysis because the process of generating projections can incorporate such variables as attenuation, scatter, and depth-dependent blur (15), which could be more significant in obese patients. Therefore, it is likely that the improvement observed with the MF correction of FBP-reconstructed gated data could be further enhanced with iterative reconstruction.
This study had the following limitations. Although the study population contained a mix of 8- and 16-frame data, the majority of the images were collected with 8-frame gating. Iterative reconstruction was not applied to gated data, which may potentially result in a reduction of diagnostic performance. The MF technique depends on correct contour definition of LV for a gated study and requires visual quality control, which adds an element of subjectivity. Small heart sizes and PVEs may reduce image resolution and may lead to a lower quality of MF images. Relatively few cases were analyzed in this study. No subjective visual analysis was performed; therefore, the results of visual analysis of MF and summed images are unknown. However, the results were obtained by an automated analysis and not influenced by observer experience and variability.
CONCLUSION
Quantitative MF MPS analysis improves detection of CAD in obese patients by improvement in specificity. Normal limits of MF MPS differ from summed perfusion normal limits; therefore, these limits are not interchangeable.
Acknowledgments
This research was supported in part by grant R0HL089765-01 from the National Heart, Lung, and Blood Institute (NHLBI)/National Institutes of Health. Its contents are solely the responsibility of the authors and do not necessarily represent the official views of the NHLBI.
Footnotes
-
COPYRIGHT © 2008 by the Society of Nuclear Medicine, Inc.
References
- Received for publication January 23, 2008.
- Accepted for publication April 3, 2008.


Jump to section
Related Articles
Cited By...
- Dual-Gated Motion-Frozen Cardiac PET with Flurpiridaz F 18
- Evaluating the Role of Routine Prone Acquisition on Visual Evaluation of SPECT Images
- Feasibility of FDG Imaging of the Coronary Arteries: Comparison Between Acute Coronary Syndrome and Stable Angina
- Stress Thallium-201/Rest Technetium-99m Sequential Dual Isotope High-Speed Myocardial Perfusion Imaging